Candlestick Patterns - Steemit Crypto Academy Season 4 - Homework Post for Task 10
HELLO EVERYONE,
Hope you all are doing well. My name is Syed Huzaifa and I intend to write about Candlestick Patterns today. In this post, I'll be particularly focusing on the Japanese candlestick chart. This is Crypto Academy Season 4 Beginners' course - Task 10 homework post assigned by @reminiscence01. Let's move on to the topic.

Homework Post Task-10
Explain the Japanese candlestick chart? (Original screenshot required). In your own words, explain why the Japanese Candlestick chart is the most used in the financial market. Describe a bullish and a bearish candle. Also, explain its anatomy. (Original screenshot required)

The Japanese candlestick chart:
.png)
This is how the Japanese candlestick chart looks like. One can observe the chart of any cryptocurrency on candlecharts.com
Why the Japanese Candlestick chart is the most used in the financial market?
The price movement in the Japanese Candlestick chart is more detailed and accurate providing signs which gain the trust of a trader to invest. Detailed information can be acquired by studying the trend of any currency in a given period.
By studying the Japanese Candlestick chart one can know the open/close and high/low points of a trade.
One can easily keep the track of the direction of the market which helps in identifying the pattern quickly.
Describe a bullish and bearish candle. Also, explain its anatomy. (Original screenshot required)
From the above screenshot of the Japanese Candlestick chart, there are 2 types of candlestick namely:

- bullish candlestick
- bearish candlestick
(Image source)
Bullish candlestick:

Simply put, When the closing price is higher than the starting price it will be bullish candlestick. A bullish candlestick is like a bull that will always hit the trend upward with its horns.
Anatomy of a Bullish candlestick:
- Open
- Close
- High
- Low
Open:This indicates the opening price of an asset. This opening price is marked and the trend starts going up for a particular time.
Close:It referred to the closing point of an asset. It indicates the last price of the candle within a specific duration.
High:It means the highest value recorded on the chart at a particular time.
Low:It means the lowest value recorded on the chart at a particular time.
.png)
Bearish candlestick:
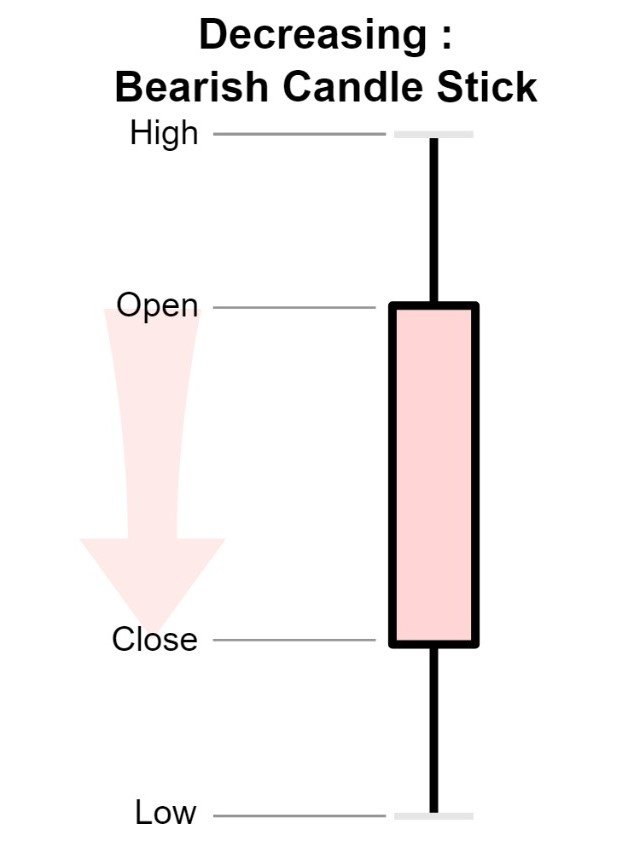
Bearish is a pattern that will show the downward trend of a currency or an asset. When the starting price is higher than the closing price it will be a bearish candlestick. It is indicated by the red candle and it means that the bears are taking control over the assets. Price movement towards the bearish trends marks the greater supply and demand. Image source
In short, a bearish trend is like the bears who are pulling down the prices showing the downward trend of a currency.
Anatomy of a Bullish candlestick:
Likewise in Bullish candlestick, bearish also have four specific points:
- Open
- Close
- High
- Low
Open: It is the point where the price movement is started in a bearish direction, indicates the opening of the price.
Close: It is the closing point, the point where the price movement is stopped. The last point of an asset over a particular time.
High: It is the highest point touches by the currency at a time. This ranges from the open point or above it.
Low: This indicates the lowest point touched by an asset in a time frame.
.png)
Conclusion:
In the above lecture, we have learned about a new method of analyzing the price movement of currencies known as The Japanese Candlestick chart. This chart plays a significant role in the world of finance.
We discussed the types of it, how it works, and its anatomy. The screenshots above show the graphical representation of the Bullish and Bearish trends.
I hope you like today's post and learn something new. Take care, Goodbye.
Regards,
@syedhuzaifa123.
Cc.
@reminiscence01