Building a Ryzen 2 Gaming & Streaming PC - Part 5 - Benchmark Results Are In... And They Are GOOD!
Finally, after 3 months of waiting for parts, and the new CPU to release, I have finally got the system up to its full potential.
You may remember back in January, just after I finished building and testing @Deeviras' new Very Compact Gaming PC, I decided that I should build my own Gaming and Streaming PC for myself. After all, it has been over 5 years since I did buy myself a new computer.

After finding the Steemit platform to blog on, and finding out about the #Dlive side of things for live streaming, I wanted a PC that was capable of doing all the work I wanted to do, play all the latest titles and stream... all at the same time. The system I had was OK. But it did struggle to do what I wanted. Now I have the means, and now I think its about time I show all of you the benchmark scores for this new beast of a build.
Here is a quick rundown of the hardware inside this new system...
| CPU / Processor | AMD Ryzen 5 2600 Overclocked @ 4.22Ghz |
| Motherboard | ASUS ROG Strix X370-F AM4. |
| GPU / Graphics Card | PowerColor Red Dragon Radeon RX 580 8Gb |
| RAM / Memory | G-Skills Trident Z RGB 16Gb (2 x 8Gb) |
| Storage | OS - Seagate Firecuda SSHD 2Tb Storage - 10Tb HDD's |
| PSU / Power Supply | GameMax 1050Watt 80+ Silver Semi Modular |
| Cooling | Corsair H55 120mm AiO (Push Pull) 3 x Corsair SP120 RGB 120mm Case Fans 2 x Cooler Master MF200R RGB 200mm Case Fans |
| Case | NZXT Phantom 820 Full Tower |
While there are some parts that are exactly what was on my initial ''wish list'', I had to make some changes to accommodate budget and the amount of time it has taken to get it up and running.
Originally, I wanted a Ryzen 7 1800X CPU as it was, well, top of the AMD tree at the time, but with the impending release of the new gen CPU's from AMD, and very little budget, I opted to wait and get a cheaper alternative that could still outshine the competition. So I ended up with a Zen+ architecture based Ryzen 5 2600. It was about £40 cheaper than the 2600X, but because I already had a cooling solution ready to go, I knew I could overclock the chip to beyond the 2600X turbo clock.
I also wanted a better cooling solution with a triple 120mm fan AiO, but again, budget restraints forced my hand, and I opted to use what I already had. And it was the same story with the Case also. So instead, I just grabbed a can of paint and went to town and spruced them up a little.

AMD Ryzen 5 2600.
This is the next evolution of the Ryzen CPU's and the Zen Architecture and I am very impressed by its overall performance in both workload and gaming performance.
The first Ryzen chips were based of a 14nm process and was a very capable CPU line. But the architecture and thermal limits of the 1000 series severely limited the overclocking ability, even with LM2 cooling, the chip just wouldn't overclock all that much when compared to the offerings from Intel.
Now with the new 2000 series chips, AMD have solved all the small problems the 1000 series highlighted. With better thermals, better overclocking abilities and improved overall performance by using a new 12nm design from Global Foundries. Combined with there Precision Boost technology, the 2000 series chips not only offer better workload based performance, but are also a cheaper alternative to Intel's alternatives.

I have already covered and reviewed the rest of the parts in this system which you can find below if you want more information about the individual hardware...
- ASUS ROG Strix X370-F Motherboard Review
- Powercolor Red Dragon RX 580 8Gb GPU Review
- GameMax 1050 Watt 80+ Silver Power Supply Review
- G-Skills Trident Z RGB 3200 16Gb (2 x 8Gb) Review
On With The Benchmarks!
- With such a huge leap in performance from AMD, it is hard to argue that this new platform is hard to ignore. Benchmark after Benchmark can be found everywhere online. But I want to benchmark my new system, not putting up against anything else, just a simple comparison between this new system and the old 6 year old one it replaced.
If you do decide to build a similar system and are competent enough to get stable overclocks, you should expect to see similar performance.
Workload performance is incredible and I am actually shocked by how much this mid tier CPU is better in performance when compared to there Vishera based flagship chips, the FX 8350. Lets take a look at some of the results.
Workload Benchmarks.
Cinebench.
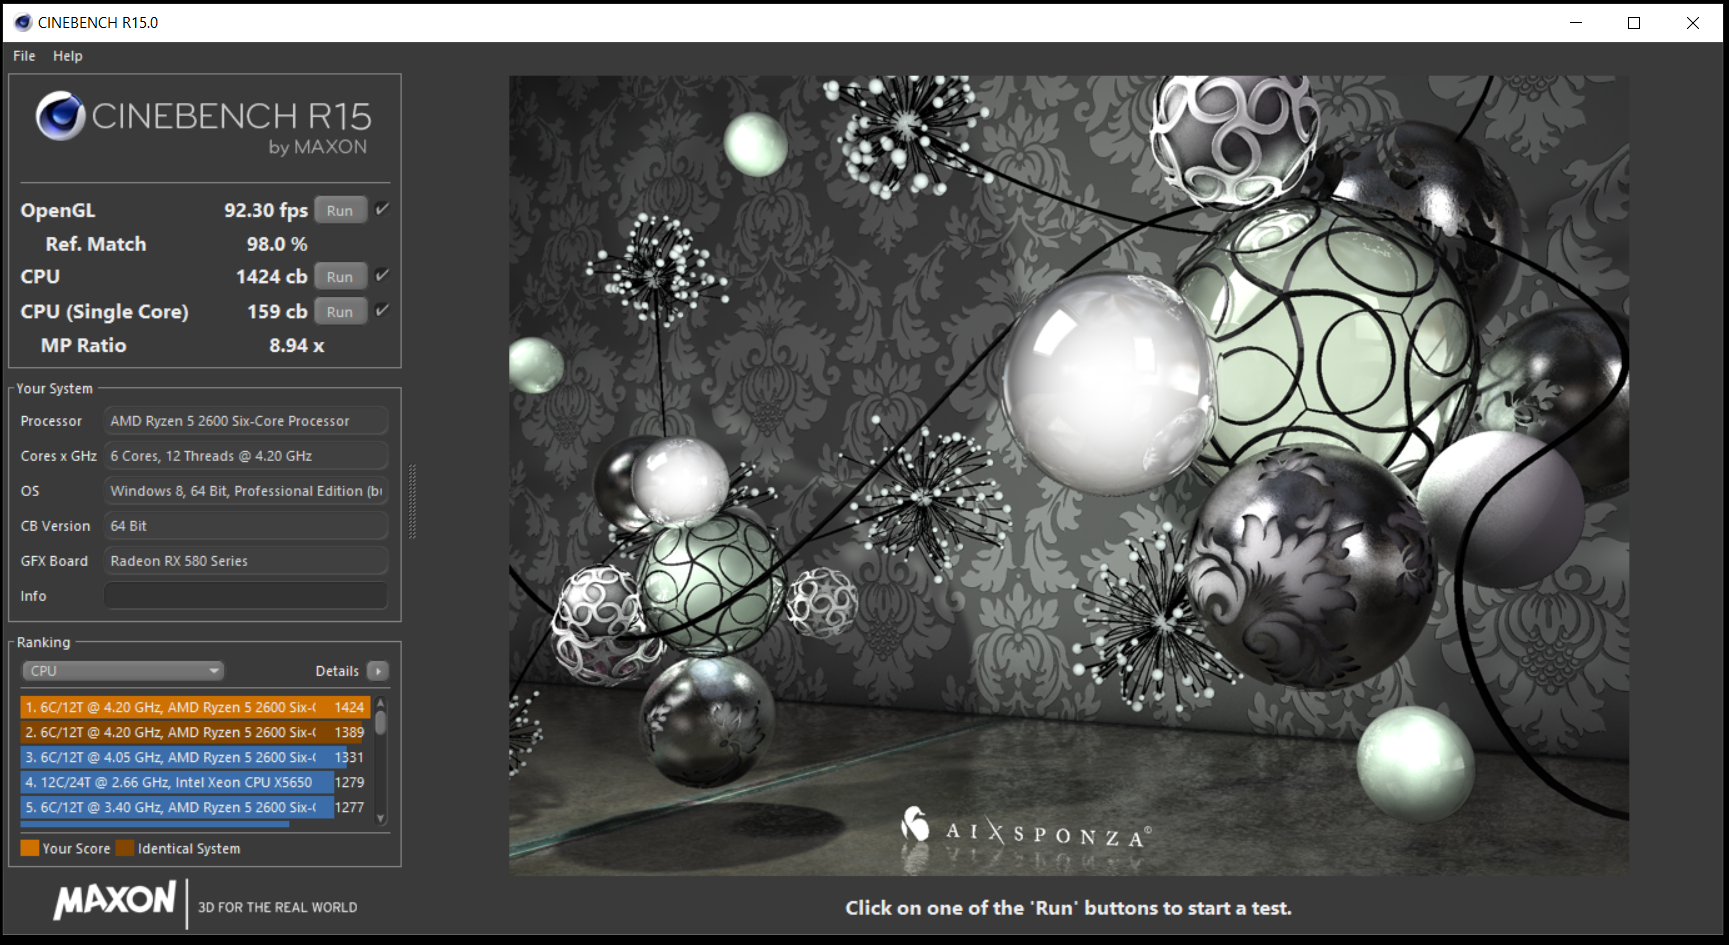
This test seems to be the industry ''go to'' benchmark when wanting to know the performance of a CPU.
Its free, which means anyone can download it and test there own CPU. This means there are scores floating about the internet. All you have to do is search Cinebench and your CPU model to find other peoples scores to compare with your own.
Cinebench is a 'Real World' benchmark and not a synthetic as most people assume. (To find out more, read 'Benchmarks in a Nutshell' HERE). The workload that the CPU has to execute is a high resolution image render. Once finished it spits out a number that compares to a set of other CPU's it already has scores for, and for you to compare with others online. The multi core test lets all the logical cores in your CPU work together to complete the workload faster. And the single core test is exactly that, 1 core to do all the work.
As you can see from the screen capture, my multi core score is 1424. to put that in perspective, my last system which had a 6 year old CPU scored just over 600. that's a 230% improvement in less than 2 generations, with the older being a flagship and this being a mid tier CPU. It is quicker than Intel's i7 7700k at 5Ghz, and there new i5 8600k. While Intel still retain the Single core performance crown, AMD owns in Multi Threaded applications.
PCMark 7.
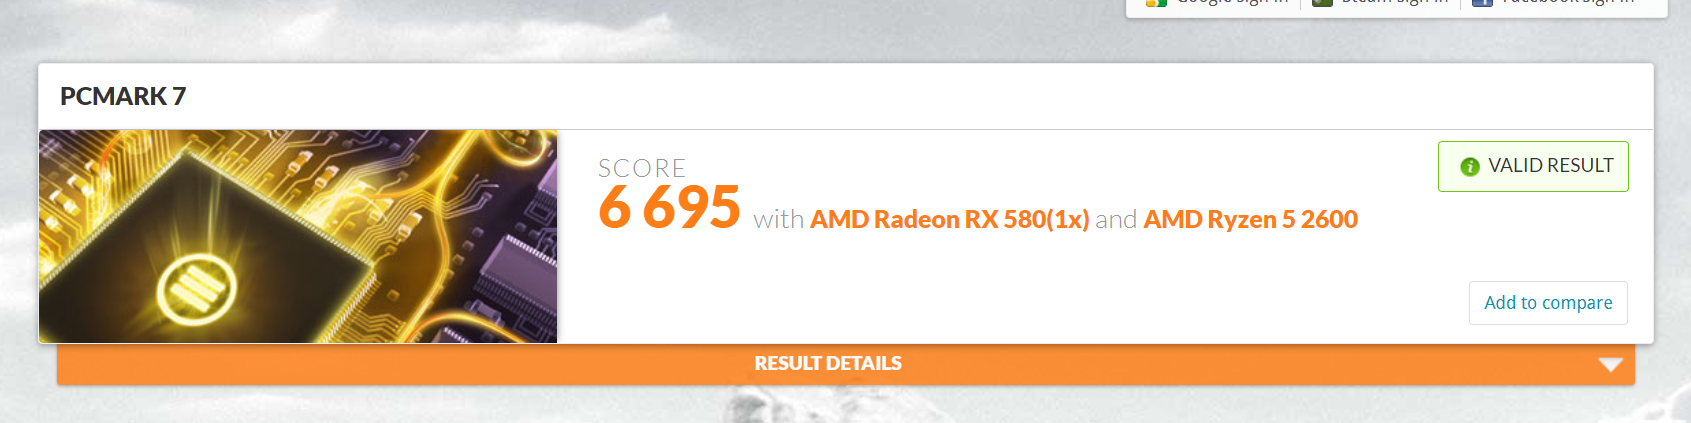
While Cinebench concentrated solely on CPU performance, PCMark is a full system benchmark that uses a combination of Synthetic and Real World workloads to determine the performance of your PC.
The tests include everything from Web browsing, to image importing, video encoding, 3D rendering, computations, storage among others. The benchmark is carried out 3 times one after the other and uses the average of all 3 to determine what your system score is. Fortunately, the software, when completed, allows you to compare your score online with other people who have performed the same test.
The system score I got was 6695. it is hard to put this into context for you. So I would suggest you download the software for yourself and upload your score for comparison.
Let me know in the comments what your score was.
Real Bench.
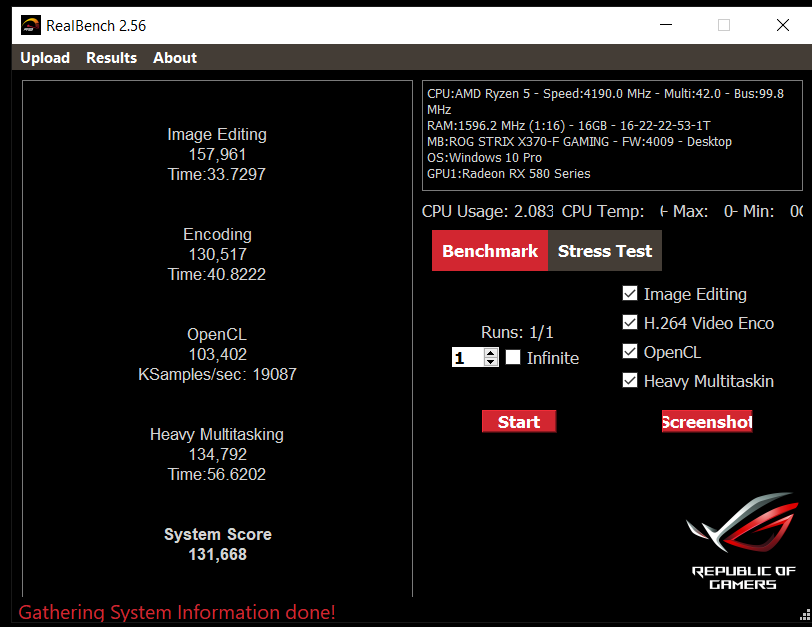
Just like PCMark, this is somewhat of an all in one test to determine the performance of your PC, in particular workload performance for both your CPU and your GPU. And just like PC mark, you can upload your scores to compare with others around the world on the ROG Site HERE.
The first test is Image Editing, and it is just exactly that. It takes a set of commands to edit various images one after another, with each being different in size and type of edit being made. This is a fairly light test, but can easily determine how fast your CPU and GPU work together to accomplish this task.
Encoding is more CPU bound as it encodes a Video file as quickly as possible. Your CPU will most likely hit 100% across all cores during this test, and if you have an unstable overclock, your PC will simple lock up or reset.
OpenCL is very intensive and uses Luxmark to complete this bench. Open CL is basically a computer language that many workload based programs use. Lux mark makes use of this by letting the CPU and GPU render an image using many types of Open CL including Ray Tracing. The more workload that can be accomplished during a set time period will give you a higher score.
Heavy Multi Tasking does exactly what it says on the tin. It uses a combination of the previous tests along with a video complete with music to complete this portion of the benchmark. With the older system, I had to sit through the video twice before the test was complete, so imagine the surprise I had when it finished half way through....
The total score is the average of all the previous tests. Mine was 131'668, when compared to everyone who has completed this benchmark and uploaded. I end up somewhere on page 42 of the leader board. But when compared with others of a similar system. I'm on page one.
CPU-Z
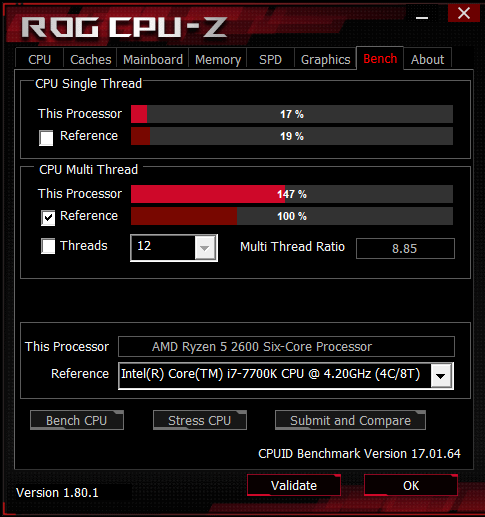
This is more of a comparison test than anything. While yes it does bench your CPU. It doesn't give you a score that can be compared with others. Only compared with a list of pre benchmarked CPU's available in the software.
So I compared mine with an i7 7700K at 4.2Ghz. As you can see from the image, the R5 2600 is 47% faster on the multicore performance, but is 2% slower on single core performance.
Performance Conclusion.
I am extremely happy with the results of the Workload performance tests. Apart from Gaming, I like to play around with applications such as blender, Adobe Photoshop and Premiere, as well as doing some music recording every now and then with Cakewalks Sonar Platinum. All of these workload based programs utilize multicore processors better and spread the work to accomplish the tasks quicker. This will mean that I have much more performance here than Intel's equivalent, and more than there previous gen flagship CPU's. So if all you do is Workload based stuff on your PC. Ryzen 2000 series will not let you down.
Synthetic Gaming Benchmark's.
All the benchmarks in this portion are all set at the highest graphical settings possible with any extras like antialiasing, real hair and others like them disabled, with the resolution set at 1440p. This is done to not only keep the benchmarks consistent, but also be a compromise between 1080p and 4k resolution. So if you game at 1080p you can expect higher framerates and vice versa if you game at 4k.
FurMark.

This is more of a GPU stress test than an actual gaming benchmark, but I thought I would include it anyway as it does have an online leader board. And even though it is more GPU intensive, The CPU speed can have an impact on the Frame rate that can mean the difference between playable and unplayable.
The average Frames Per Second (FPS) I got was 72 with a score of 4336. the score is only important when comparing to others online. The main number is the 72 FPS. Had this been a game, this would be very playable indeed.
Unigine Valley.

This is a synthetic benchmark with a pre rendered workload designed just to test the GPU, but just like the FurMark test, the CPU speed can impact the framerate a little.
Here I scored a framerate of 62.8 FPS, with a maximum of 112.6 and a low of 25.3. Valley is a direct X 11 based benchmark that is very stunning to watch. It is hard to try and compare with another system, but if you want to compare yours, you can download from Unigine and benchmark your own.
At over 60FPS, this is well in the realms of very playable frame rates.
Unigine Superposition.

Just like Valley, this is another Synthetic benchmark that is designed to test the GPU without impacting the rest of the system. Unlike Valley, this is Unigine's latest benchmark and it can push even the most powerful gaming machines to there limit. So the fact I got a reasonable score is amazing.
I averaged exactly 30 FPS in this test witch is what most consoles frame rate is, but at 1440p. I have ran this test several times on my previous system, and I have gained a full 4FPS. I used the same GPU as I did then, and that 4FPS is down to the CPU, memory and chipset.
Real World Game Benchmarks
So instead of trying to organize a whole bunch of images and meaningless descriptions. I simply compiled all the scores into one easy to read chart.
| Old System FPS | New System FPS | |
|---|---|---|
| Alien Isolation | 112.50 | 121.50 |
| Assassins Creed Origins | 33.00 | 55.00 |
| Hitman | 54.26 | 68.8 |
| Metal Gear Solid The Phantom Pain | 54.20 | 82.00 |
| Rise of the Tomb Raider | 58.90 | 80.90 |
| Batman Arkham Knight | 88.00 | 102.50 |
| Ashes of the Singularity | 31.10 | 61.30 |
| Crysis 3 | 45.00 | 69.85 |
| GTA V | 58.85 | 71.38 |
I compared the scores I have previously got on my old PC compared to the new one. However, I have had the Radeon RX 580 for a few months now and I have used it extensively in the old system, so the only impact on the frame rates is the CPU, Memory and Motherboard Chipset.
Across the board, you can easily see that with the new Ryzen 5 2600 and the Trident Z Memory has had a profound effect on the average framerates in all the games tested, with the biggest increase being Ashes of the Singularity by over 200%. the main reason for testing this game was because it is a very CPU intensive game, and even though I have the latest mid tier CPU, it is still a bottleneck for this game. The same can be said about Assassins Creed Origins. Another CPU intensive game that sees a massive jump in framerate, thanks to the increased performance in the CPU.
Even though Hitman is an AMD sponsored title, it still didn't see that much of a jump in the frame rate. But I will take that extra 14FPS and enjoy it later tonight as I play a few contracts.
Another game that saw some big improvements was Rise of the Tomb Raider with 22 FPS. That is almost a films frame rate gained over the original system.
Gaming Conclusion.
Intel still take the gaming crown in this category, but at a cost of CPU utilization. Let me explain. When benchmarking all the games, and even the synthetic ones, I noticed how low the CPU utilization was. Thinking it was an issue with my overclock, I went straight to the web for answers, and as it turns out, everyone's is the same. When reading up on comparisons between the Ryzen 5 and the Intel i5's, it is apparent that the reason behind Intel being superior in gaming is because they utilize more of the CPU. While this is good for gaming. It leaves little headroom for anything else. I built this PC specifically for Gaming and Streaming at the same time as well as running more Apps in the background. So the fact that the Ryzen chips have more performance headroom is ideal as they can multitask while gaming better than any Intel Chip. This is only confirmed with a video on you tube I came across by Gamer Nexus HERE that shows side by side comparison between the R5 2600 and the i5 8600k as he pushes the streaming limit of both chips, with the Intel chips sliding across a floor littered with glass on there face as they try to keep up with the AMD CPU.
In a nutshell, the System is awesome and I can not wait to start gaming and streaming. So if you will excuse me.
As an added bonus, here are some vanity shots of the hardware …..


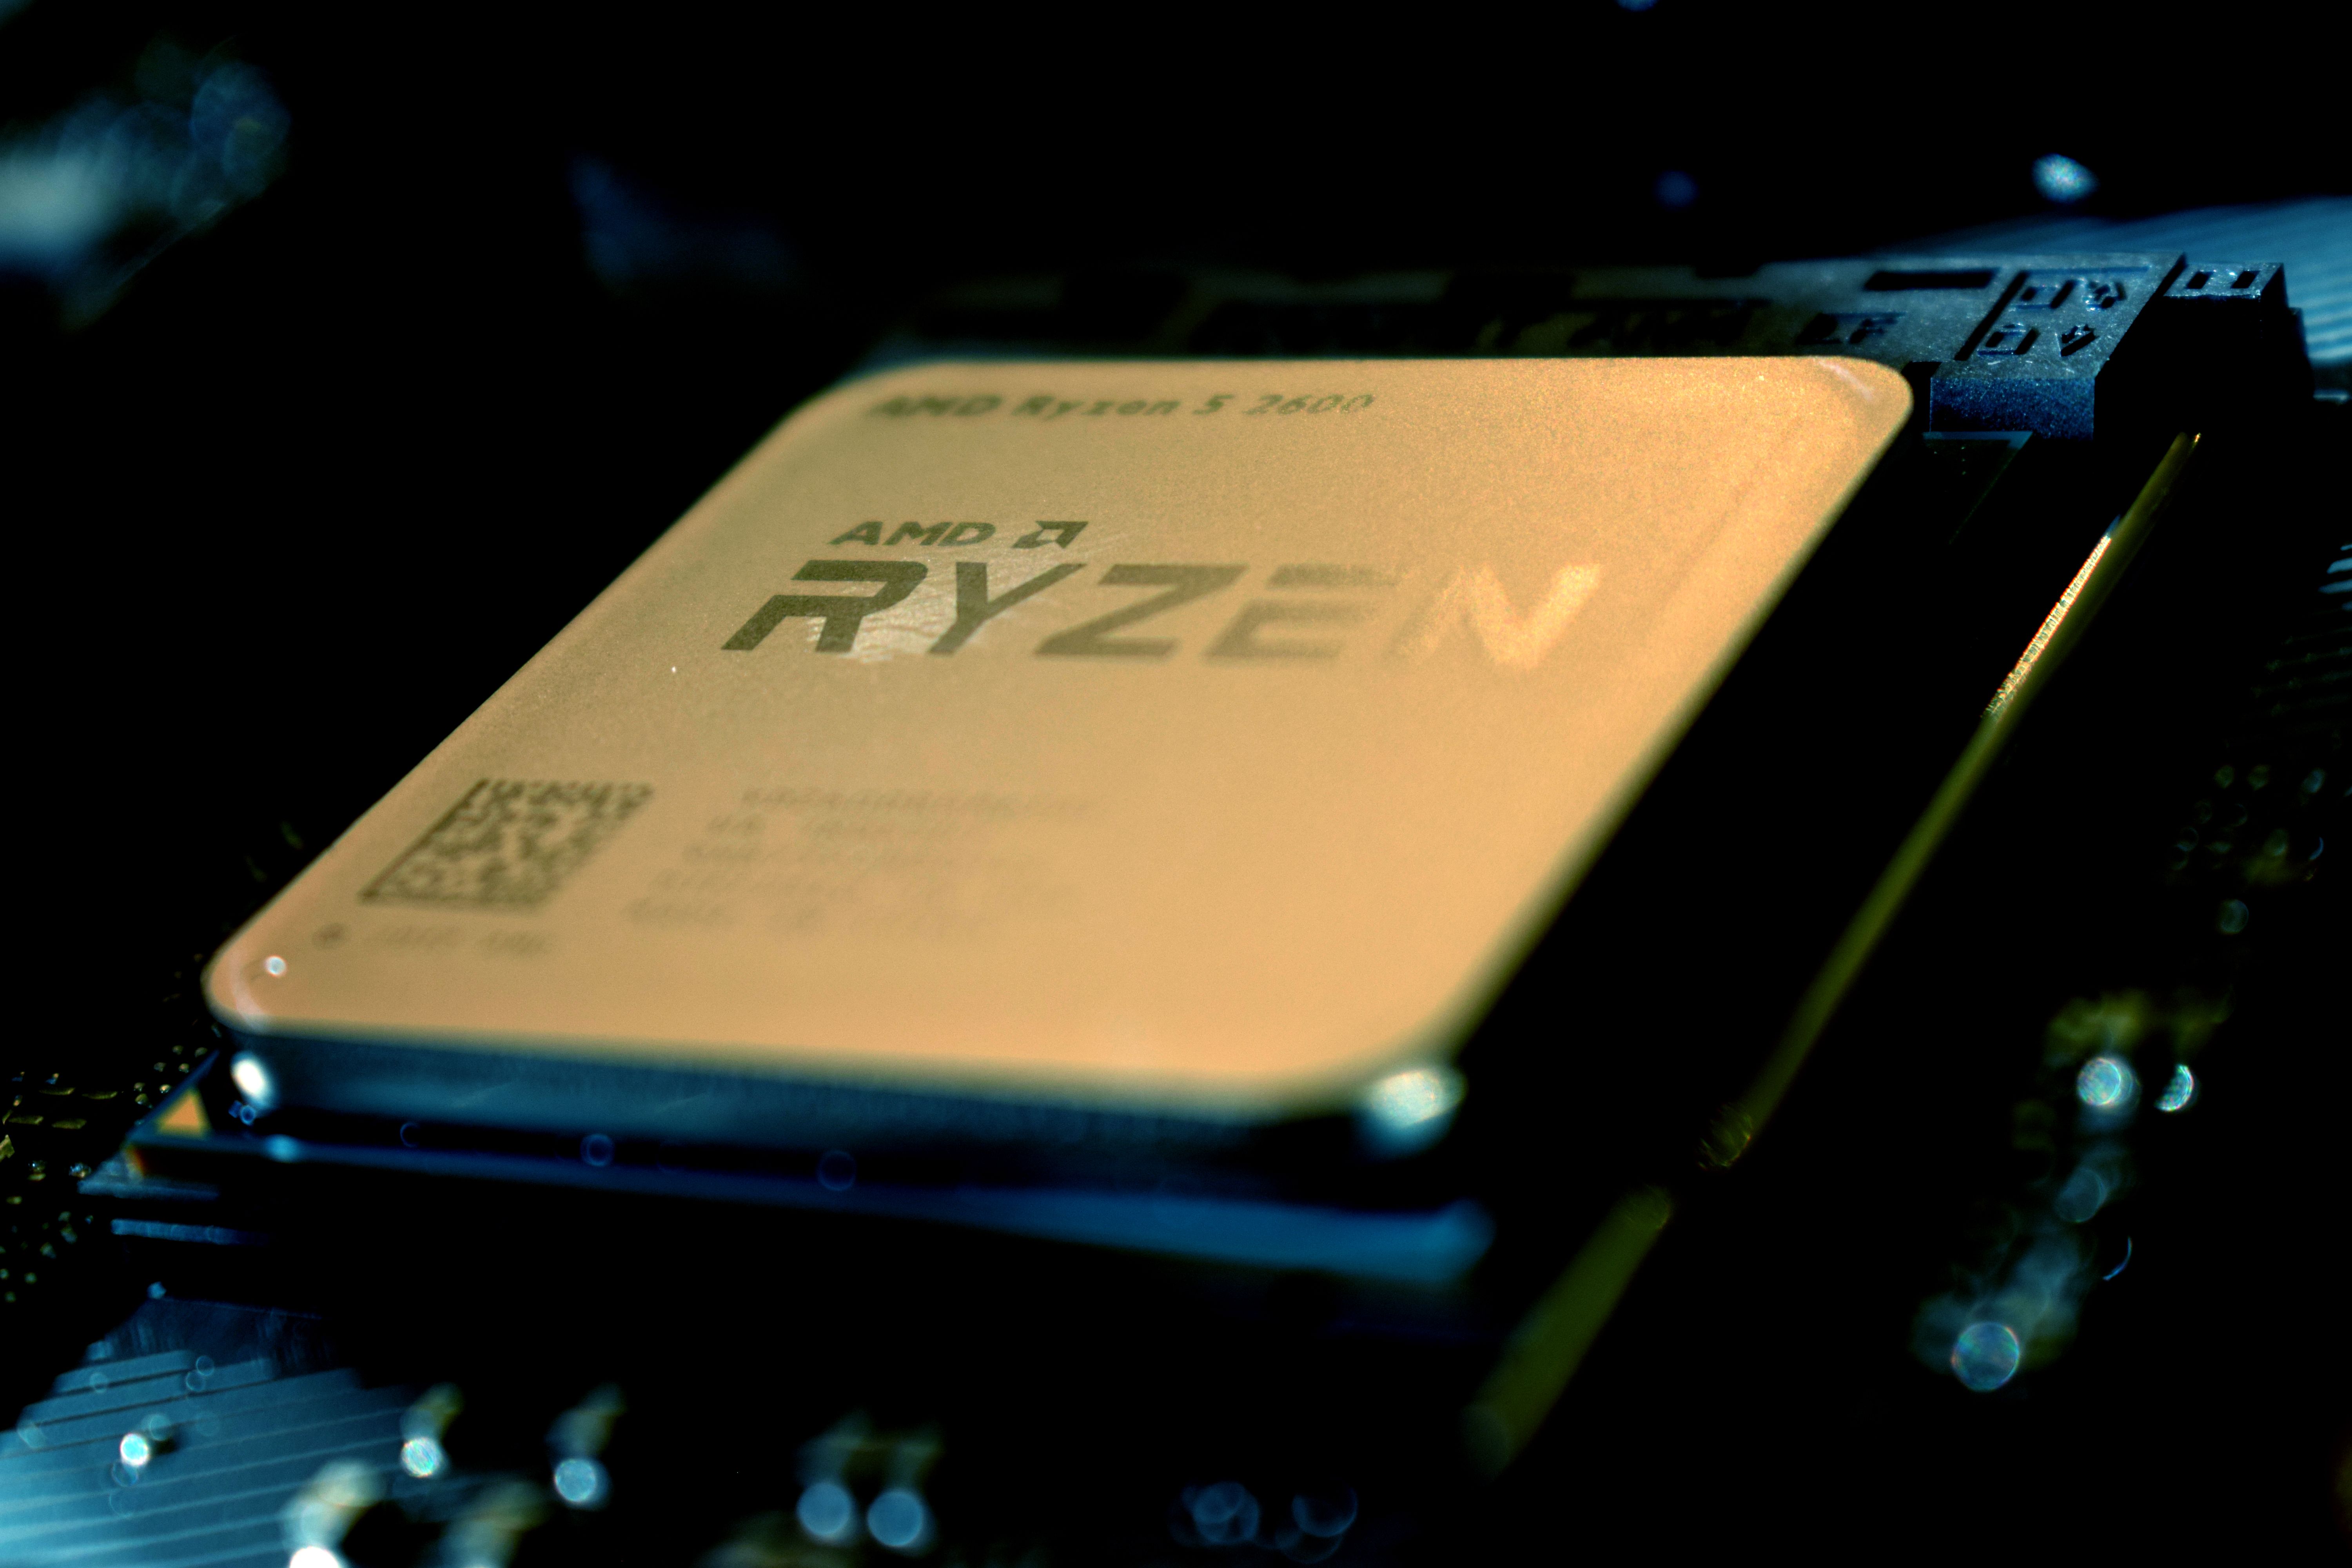


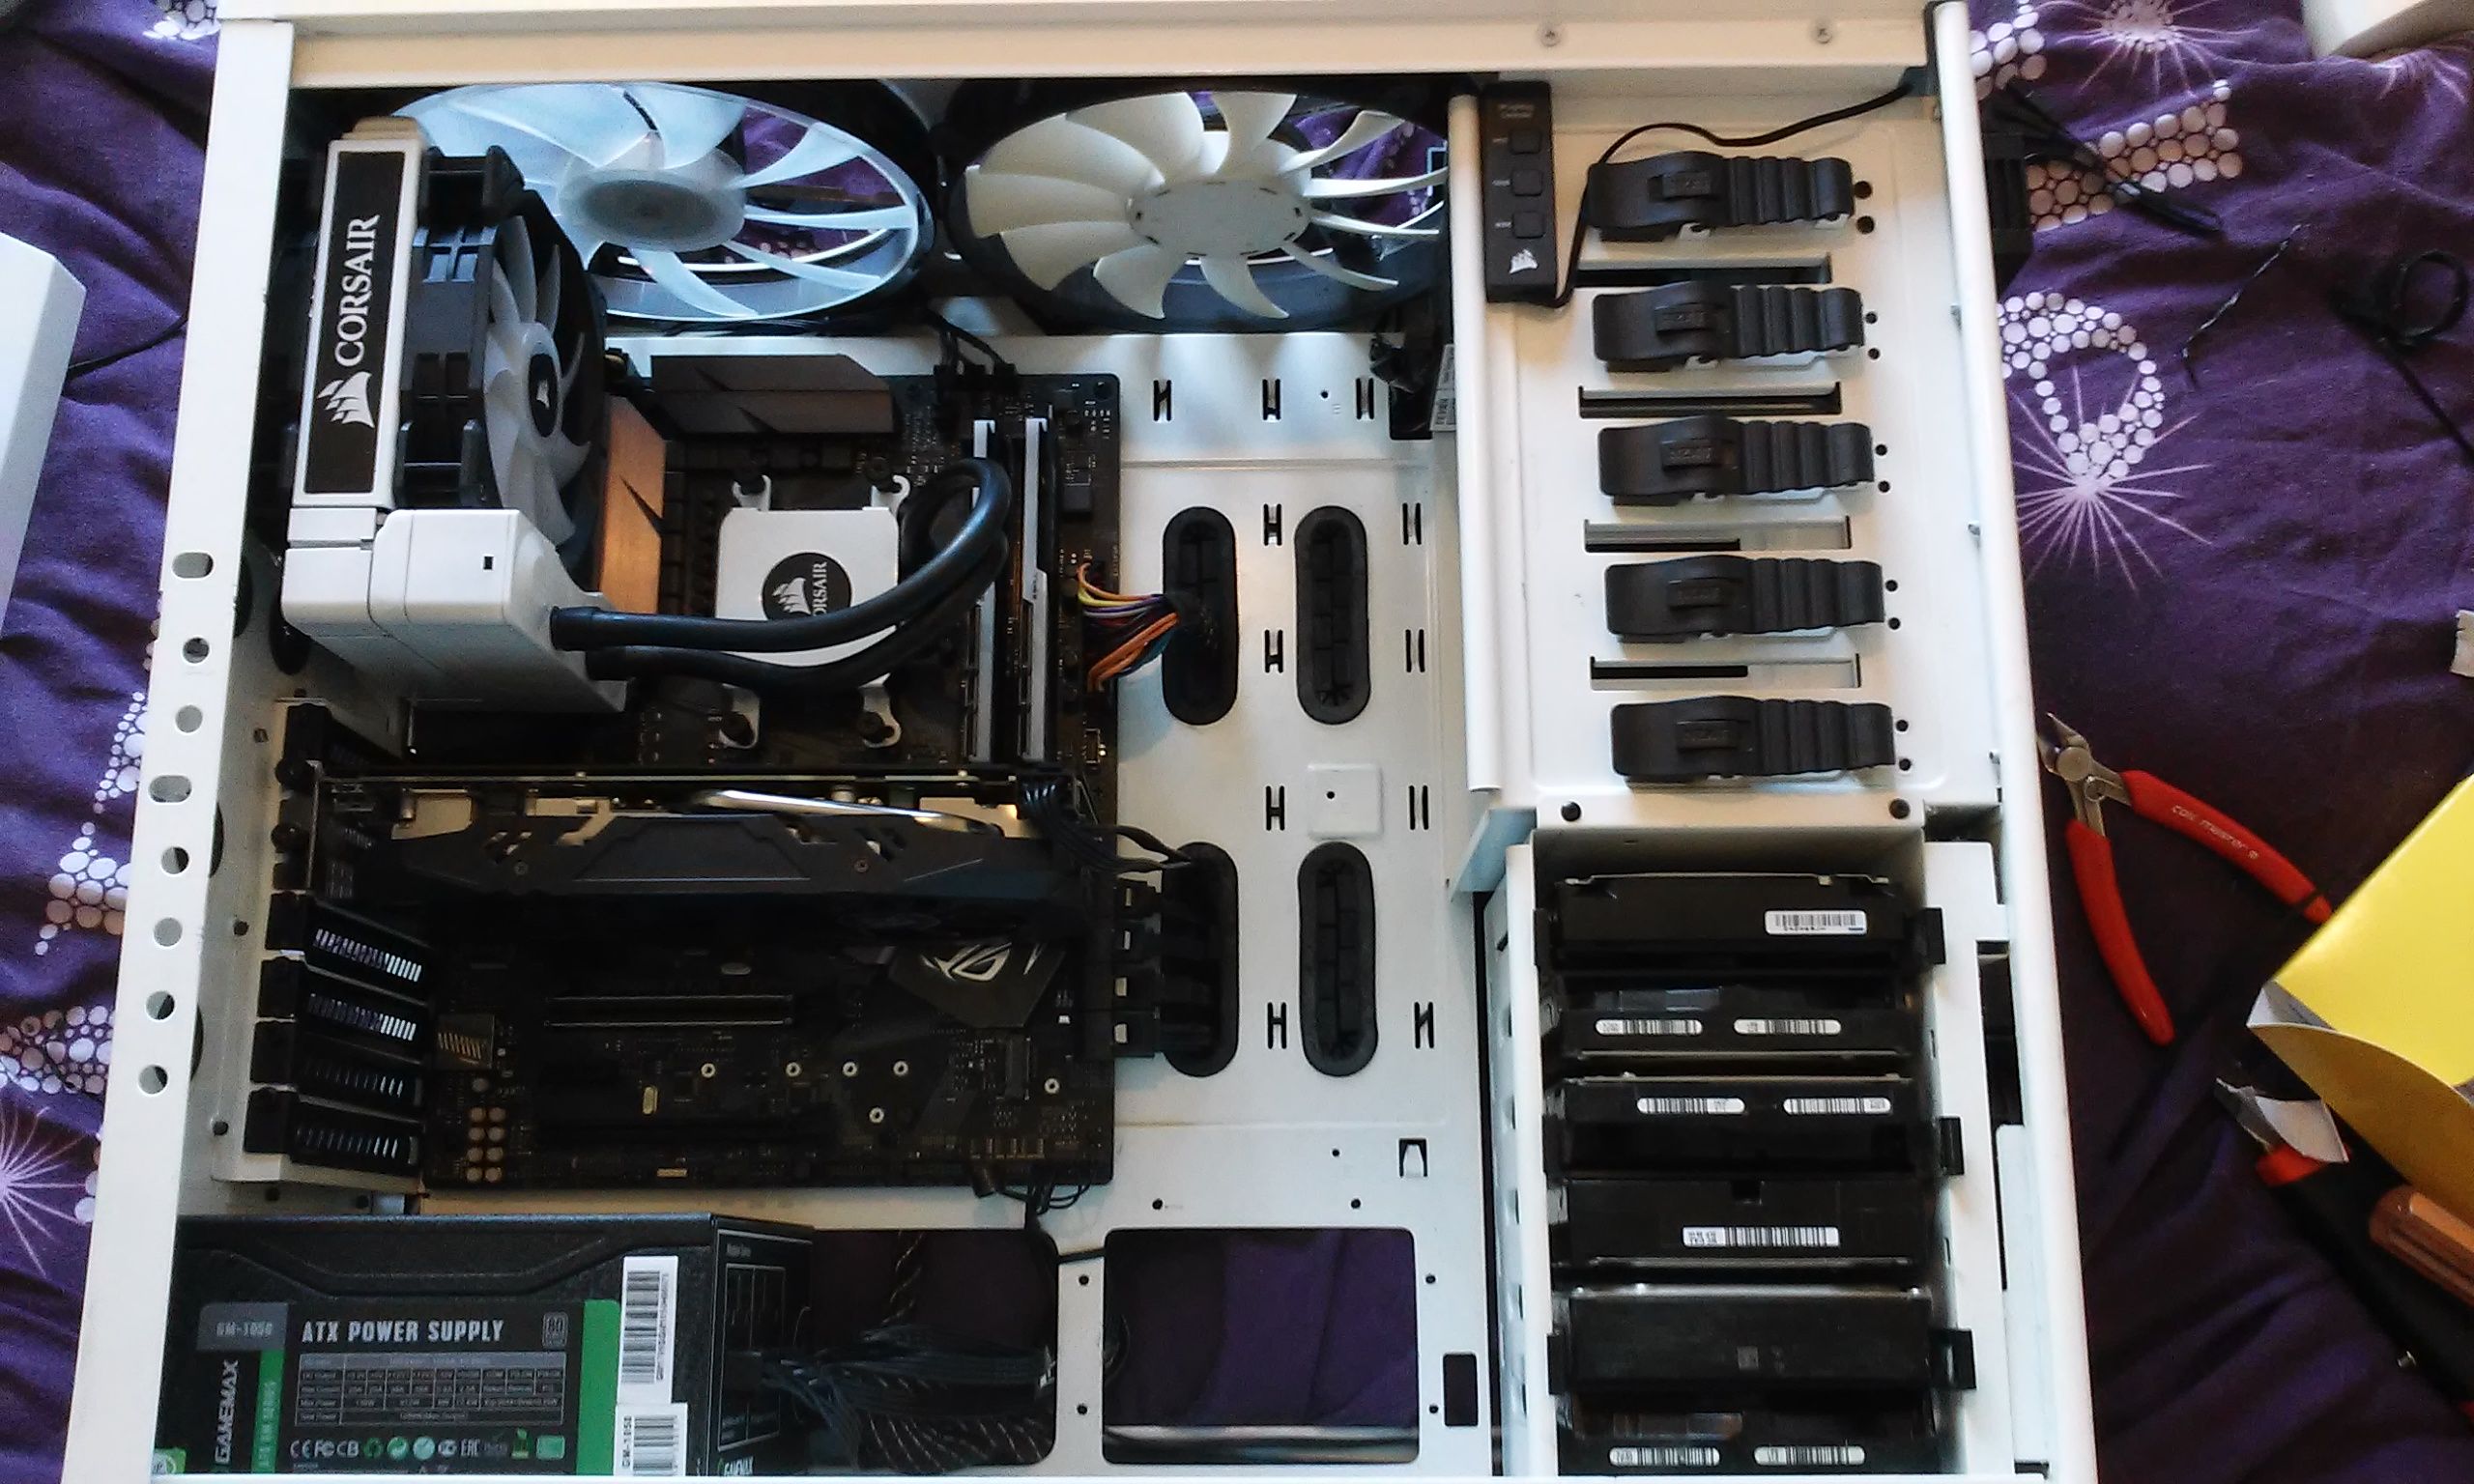

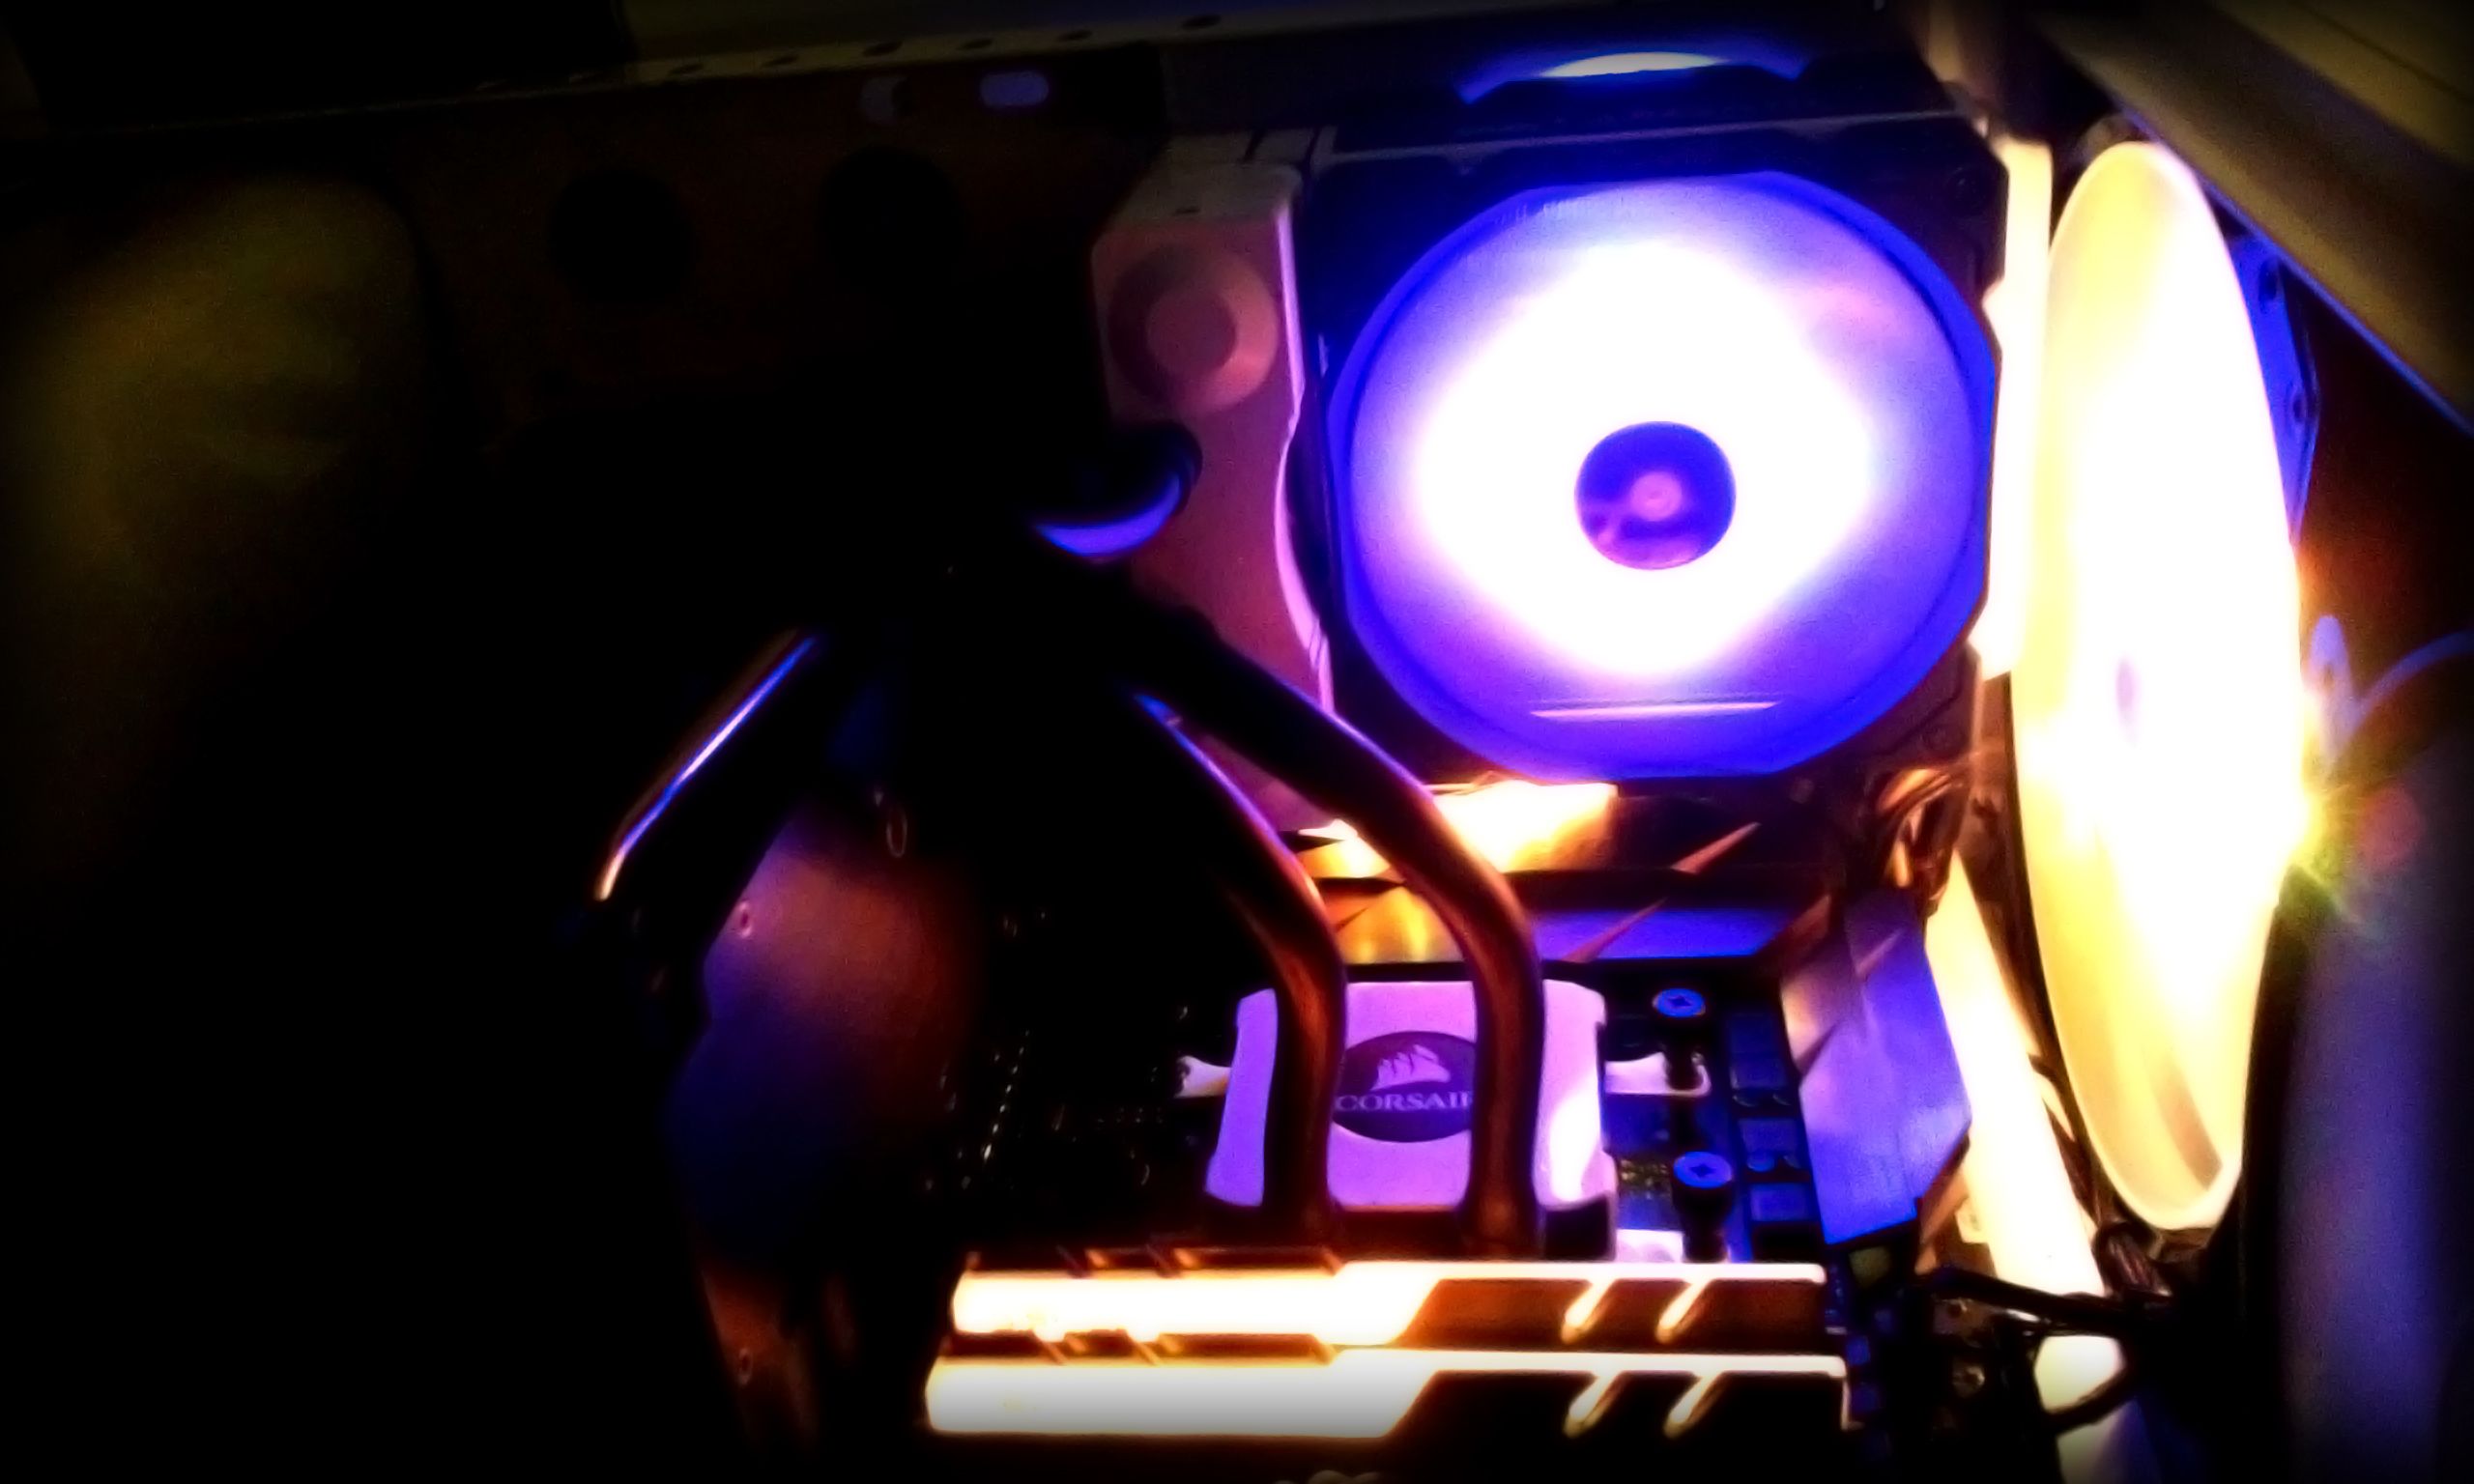

Vanity Images are courtesy of Jacob @ Black Apple Studio UK
Thanks for reading.
Make Steemit Work For You! Join SmartSteem NOW!... Click HERE to Find Out More!
Don't Forget to Upvote, ReSteem and Follow for more content like this!

Stu @TechMojo
Join the chat TechMojo Discord Channel Follow us TechMojo OnG Social Page Like us TechMojo Facebook Page Follow us TechMojo Twitter
@TechMojo Recommended Blogs you should follow.
@Deeviras @Gaming-Stuff @retro-room @gamesociety @Rerez @C0ff33a @Free999Enigma @deadspace @SteemGC @GeekClub @XR-HammerGaming @tygergamer If you want to apper here, then contact us via our Discord Channel!
Like this Content? Why Not Donate Then.
Bitcoin Wallet Address. 1L8TZDQasoBU2RNcjkSeZX3iUsSaHT37aj Ethereum Wallet Address. 0xe3c6372121554f73c38acae3312fc7b1ddaf670f
Great post sir @techmojo. I always follow you because you get something new that attracts me..Thanks sir. keep going sir. Good wishes for you.
sir @techmojo,you are great. I can learn a lot from your post. You are a high level creative person sir. Go on. Best wishes for you sir.
Congratulations, this post was rewarded with a SteemGC Upvote!
Want to meet fellow Steemit gamers and earn upvotes yourself? Join the SteemGC Discord channel!
Nice! I'm still happy with my Ryzen 7 1800X system, but the new generation does look promising. Unfortunately, the pump for my water cooling system crapped out on me. I'm back on my old Phenom II X4 970 system at the moment.
i had a phenom tri core back in the day. awesome chips.
sir @techmojo, ryzen is really a revolution i think sir. Many many thanks for your review sir. The frps rate is just wonderful. I want that sir. I think i need to change my pc sir. Have a good day sir
Ah, I see you follow the @free999enigma school of thought when it comes to selecting a PSU. Namely. POWEEEEEEEEEEEEEEEEEEER!!! :D
well, at least i have the head room for adding more to the system.