How to use the MACD Indicator, the RIGHT way
Comment your TradingView username below to get access to this indicator
Welcome to the Maverick MACD :)
I’m sure that every trader has used the MACD Indicator before. It’s one of the most popular indicators out there, and for good reason!
What we’ve done here is extended the functionality far beyond what your normal MACD indicator will do.
We now use this indicator exclusively instead of the standard MACD , and we’re confident that after using this indicator, you’ll want to do the same :)
Divergence Detector
Put simply, divergence is when two things don’t agree with one another.
In the case of trading, it happens when price is telling us one thing, but our indicator is telling us something different.
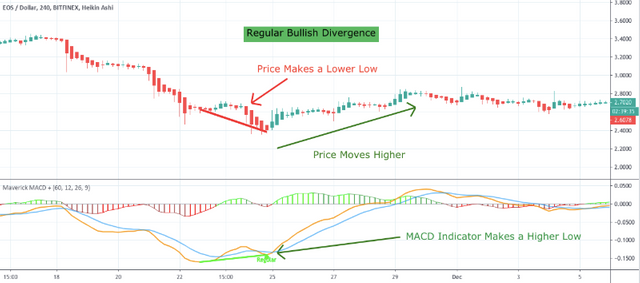
One example of this is when price makes a lower low, but the MACD Indicator makes a higher low. (Price is moving downwards as the MACD is moving Upwards)
This would be known as regular bullish divergence.
Divergence can tell us a lot about what price is going to do next.
It can tell us if a trend is likely going to continue, or if it’s if it’s getting exhausted and likely to reverse in the opposite direction.
Without this indicator, a trader would have to look for divergence manually on every single chart.
This takes time, experience, and attention to detail to really get it right.
By doing it manually, you’re going to be missing crucial market information by forgetting to check for divergence, or not even being able to see it when it’s right in front of you.
With this indicator, you can rest assured that you will find every divergence in the market as soon as it happens!
This indicator does the heavy lifting for you by scanning the market 24/7 to find those divergences.
This indicator will find Regular Bullish and Bearish Divergence, as well as Hidden Bullish and Bearish Divergence.
It allows you to find divergence for both the MACD Lines and the MACD Histogram as well.
And on top of all that, we have 8 different alert options for Divergence so you can be notified as soon as divergence is detected!
Regular Bullish Divergence Example:
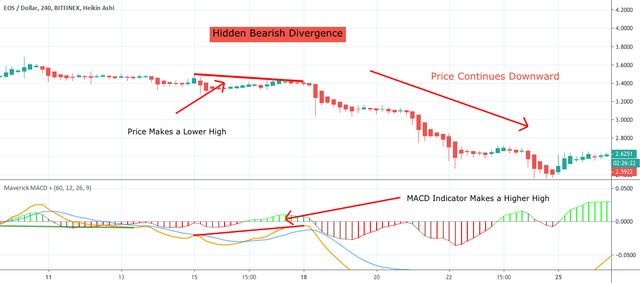
Hidden Bearish Divergence Example:
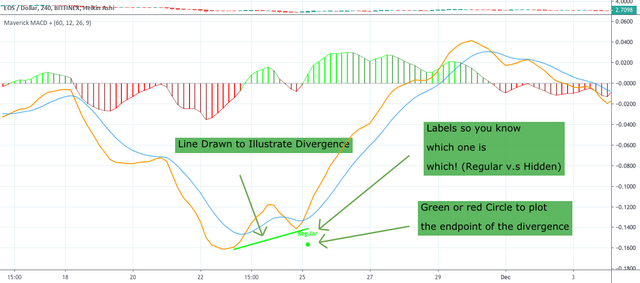
How Divergence is Represented
This indicator will illustrate divergence in the exact same way an experienced trader would; By drawing a line on the chart from one swing low/high to another.
This shows you where the divergence started, and where it ended.
You can also choose if you want labels to appear on the chart to say if the divergence is regular or hidden. This way, you can have both on your chart at the same time and not get confused about which one is which.
We also displayed the end-point of divergence with a green or red dot to show you exactly where the divergence was spotted.
Green for bullish , red for bearish.
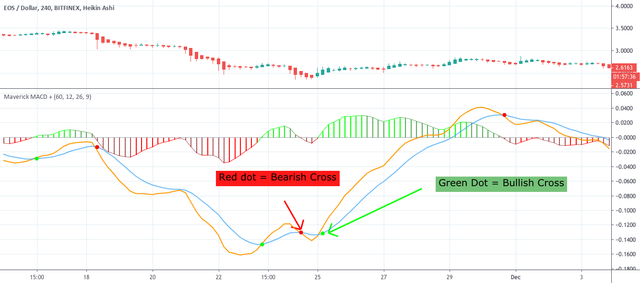
MACD Crossover + Alerts
One of the most common ways of using the MACD indicator is using the crossovers of the MACD and Signal line as bullish or bearish signals.
What we've done is added a nice visual representation for when you get a bullish or bearish crossover.
Now, you don’t have to try to remember which crossover is a bullish signals and which one is a bearish signal.
When the MACD line (Blue Line) crosses OVER the Signal Line (Orange Line), that is a BULLISH Sign.
This is represented on the chart with a green dot.
When the MACD Line (Blue Line) crosses UNDER the Signal Line (Orange Line), that is a BEARISH sign.
Represented on the chart with a red dot.
You can also receive alerts for when each of these crossovers occurs.
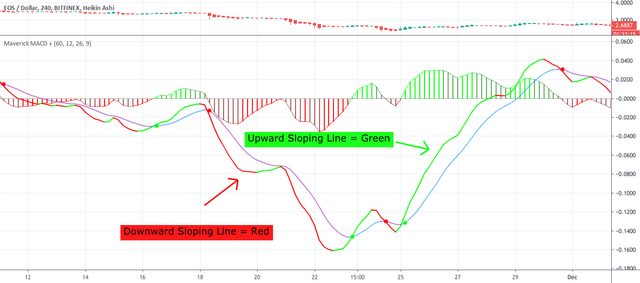
Line Color Changes
The default colors for the MACD lines are Blue and Orange.
What we've done with this indicator, is incorporated red and green lines to show when the MACD is representing a possible uptrend or downtrend in price.
It's a simple but helpful way to visualize what's going on and something we think many traders will enjoy.
Setting a Custom Time Frame
Like many of our other indicators, we have included in this indicator the option to set a custom time frame.
So for instance, if you are trading on a 15-minute chart but want to look for divergence on a 4 HR chart, you absolutely can!
Smart Alerts
Instead of just saying in our alerts, “MACD Line Regular Divergence”, we have also included smart data so that you can tell what the price was when the divergence was detected {{close}}, what the asset is {{ticker}}, and the exchange {{exchange}}