A - Z FOREX EDUCATION PART 2
Currency Names and Symbols
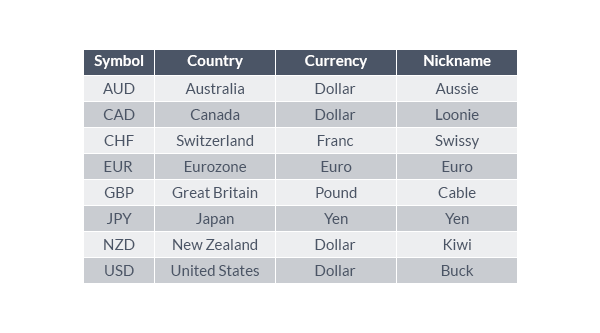
As you may have noticed, the symbols (abbreviations) for all currencies have three letters. The first two letters denote the name of the country and third letter stands for the name of that country’s currency.
As an example, let’s look at the USD. The US stands for United States and the D stands Dollar.
The currencies on which the majority of traders focus are called the “majors”. The most widely traded currencies are represented on the grid below:

Not to be confused with major currencies are the major currency pairs. The Major Pairs are any currency pair with USD in them. For example, the EURUSD would be considered a Major Pair.

Currency pairs without the USD in them are referred to as Cross Pairs. The EURJPY would be an example of a Cross Pair.
To carry this one step further, any EUR pair without the USD in it would be referred to as a Euro Cross. So the EURJPY would be a member of the EURO Cross group. Other member of that group would be EURGBP, EURCHF, EURNZD, EURCAD and EURAUD.
Other currency groups of this type would be comprised of the JPY crosses, GBP crosses, AUD crosses, NZD crosses and the CHF crosses.
Understanding The Forex Majors
Talking Points
• Foreign exchange rates are quoted in pairs
• The Majors, refer to actively traded Forex currencies
• Major Pairs reference major currencies coupled with the USD
By now you probably know that foreign exchange rates are quoted in pairs. While this is important, it is also imperative to know exactly which currencies are being referenced in these pairs. Whether you are preparing to place your first trade or are a seasoned pro analyzing extensive research having a firm grasp on which currency is which will ultimately influence your decisions.
To help today we will review the Forex market Major Currencies and Pairs.
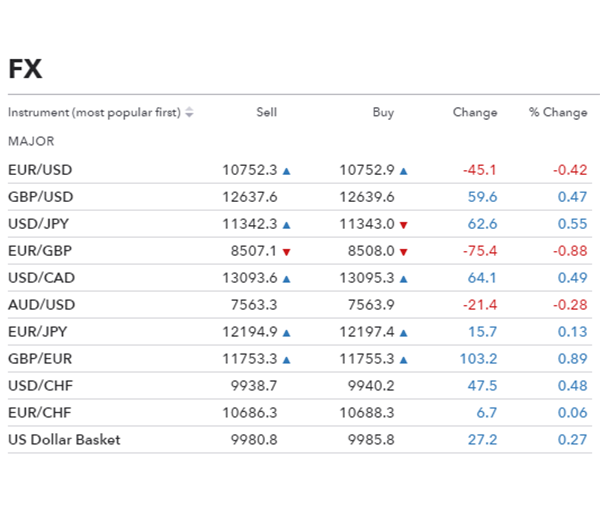
The Majors
When trading Forex, it is inevitable that traders will run across currencies known as “The Majors”. This term is in reference to the most frequently traded currencies in the world, with the list normally including the Euro (EUR), US Dollar (USD), Japanese Yen (JPY), Great British Pound (GBP), Australian Dollar (AUD), and Swiss Franc (CHF).See the graph below, and you will find a list of the Major currencies along with their associated country and ISO symbol.
The Symbol is how you will know exactly which currency you are trading when referencing a Forex Bid/Ask quote. However, it is also important to review each currencies nickname. These names will often come up in research and will be handy when communicating with other Forex traders.

Major Currency Pairs
Next we will take a look at currencies pairs that are considered “Major Pairs”. The Major Pairs are a reference to any of the major currencies listed above when paired with the USD. For example, the EURO is considered a major currency, but when paired with the USD (EUR/USD) the quote becomes a reference to a major pair.
All About Currency Crosses
Talking Points
• Foreign exchange rates are quoted in pairs
• Major Pairs reference major currencies coupled with the USD
• Cross Pairs reference major currencies coupled with a non USD currency
Foreign exchange rates are quoted using two currencies, which then are combined to create a currency pair. The majority of these pairs are created using the G-8 currencies listed below which are then divided into two classifications, Major Pairs and Cross Pairs.
Currency Cross Pairs
“Major Pairs” are considered when any of the Major G8 currencies are coupled with the USD, such as the EURUSD. A cross pair is one that does not include the USD. These currency cross pairs were created to ease the process in which traders could exchange money. Not only were transactions simplified without first having to convert to USD as a common medium, but now traders can also trade while avoiding USD volatility.
The other major benefit to trading cross pairs is for their strong trending markets. One example of a currency cross pair is the EURAUD. For the 2013 trading year the EURAUD moved a total of 3378 pips from low to high. This is nearly 4x the movement of the EURUSD! The EURUSD major only managed a move 848 pips, measured from low to high for the 2013 trading year. Other cross pairs for the Euro includes the EURGBP, EURAUD and EURJPY to name a few. So remember next time you open your platform there are opportunities outside of the majors, and look for the currency crosses.
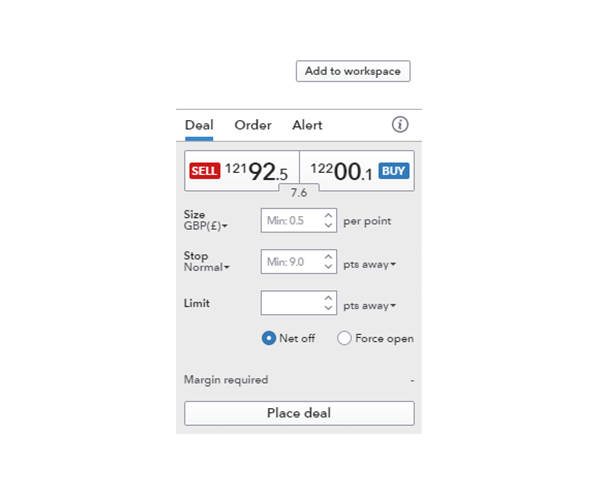
Trading the Euro - EURUSD
When FX Traders first come to trading platforms, their interest is almost universally drawn to the same vehicle.
This vehicle is typically highlighted, stands out, and is noted as the EURUSD.
The reasons for this popularity make sense. Europe and The United States represent the two largest economies in the world. While the US Dollar remains the world’s most popular reserve currency, the fast rise of the Euro to international prominence brought it to the world’s second most common reserve currency; and this was in an extremely short amount of time.
How Have Traders Fared in EURUSD?
Unfortunately, this rampant popularity in the currency pair hasn’t equated to profits for traders speculating in the currency pair. In the Traits of Successful Traders series, David Rodriguez looked at exactly this question while examining over 12 million live trades, placed by real retail.
The graph below will show the five of the most popular currency pairs, plotting the profitability of traders (running up/down on the left side of the graph) at various times throughout the day (plotted horizontally along the bottom of the graph). EURUSD is represented by the blue line.
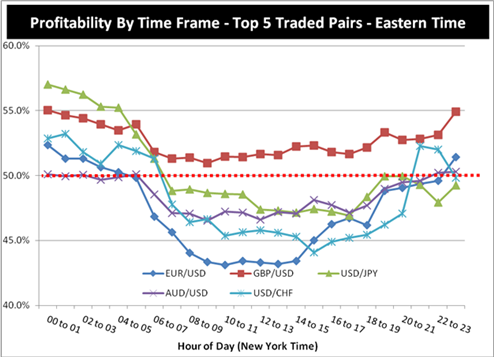
As you can see, EURUSD is actually the least profitable pair at many times throughout the day, despite its raving popularity.
Notice that profitability seemed to be far lower on EURUSD during the very active market hours (from 4AM EST to 2PM EST). This is an important point, as this is shortly after London, the largest FX market center in the world, opens for the day and brings a massive amount of volume into the market.
When the US opens for business at 8 EST, more volume is introduced as The United States is the second largest FX market center. Notice that profitability for traders in EURUSD seems to bottom shortly after the US Open (8-11 AM EST).
From the research, it appears as though as volume and market activity increase – trader profitability in EURUSD decreases, and decreases more-so than what was seen in the other most commonly traded currency pairs.
Trading EURUSD
Given the information we have on how traders have fared in the past, we can build an approach based on what has or has not worked for other traders in the past.
The first point of emphasis is that while traders may have been worse-off trading EURUSD during the very active times of the day (The London and US sessions); profitability on EURUSD is actually above or near 50% for much of the Asian Trading Session.
As a matter of fact, after The United States closes for the day at 5:00 EST (shown as 17:00 on the graphic), trader profitability stays above 45% until London opens the next morning.
For traders wanting to speculate on EURUSD, the Asian trading session may be more accommodating than the ‘active’ hours of the day.
One of the primary reasons for this may be in the fact that the Asian session typically sees smaller price movements than what may happen during the very active times of the day. Support and Resistance, generally speaking, will see much more respect during the slower Asian trading session.
In ‘When is the Best Time of the Day to Trade Forex’ David Rodriguez looks at exactly that, and finds that the average movement of the EURUSD currency pair is far smaller than during the Asian trading session than during the active hours of the day.
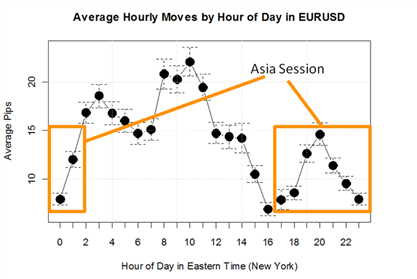
Because of these slower price movements and the fact that support and resistance will have a greater tendency to be respected, traders may find range trading approaches on the Euro-Dollar to be most accommodating during the Asian Trading Session.
Once a trader knows they want to take a range-based approach on the pair, filling in the strategy can be simple. There are numerous materials available from DailyFX to assist traders with their range-trading approaches.
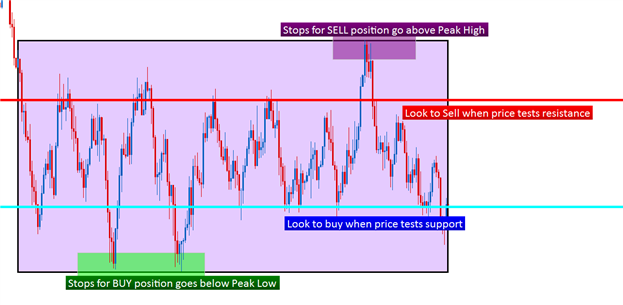
In How to Analyze and Trade Ranges with Price Action, we looked at a mannerism of trading ranges using only price inflections and swings, no indicators necessary. By taking an approach such as this, you can locate the support or resistance in the market as the Asian session opens, and look to buy when price is at or near support; and look to sell when price is at or near resistance:
In the JW Ranger Strategy, Jeremy Wagner brings price action together with the Commodity Channel Index, or CCI, to decide when exactly he might want to trigger into a position.
What if I Can’t Trade the Asian Session?
Given the 24-hour nature of the FX market, and considering that to many FX traders from Europe and the United States, the Asian session is still considered ‘off-hours,’ this was a common reason why traders didn’t look to trade when the market may be more accommodating to their goals.
In ‘How to Trade Forex Majors like the Euro During Active Hours,’ this question is addressed directly by David Rodriguez in the third installment of The Traits of Successful Traders series.
David suggests that, since markets generally exhibit more volatility during the active hours, and this is when traders have been the most prone to TheNumber One Mistake that Forex Traders Make; traders could use this volatility to their advantage by using aggressive risk-reward ratios with breakout strategies. From the research:
“Breakout Trading Strategies tend to do relatively well in volatile environments, so if you plan to trade during these times, look to trade breakouts.”
With breakout strategies, traders are monitoring support and/or resistance; waiting for a break of the price level with the expectation that once the break is made – price will continue running in that direction, allowing for the maximization of profits in instances when the trader is correct.
In the article ‘Price Action Breakouts,’ we looked at a mannerism for trading price-breaks without the necessity of any indicators at all, using price alone to denote support and resistance levels.
Trading the Cable - GBPUSD
One of the oldest and most popular currency pairings in the world is the British Pound v/s the United States Dollar.
Speaking directly to this quality, the name ‘The Cable’ comes from the first transatlantic cable that was laid across the floor of the Ocean for the United States and Great Britain to communicate with one another.
One of the primary pieces of information exchanged on this first transatlantic cable were currency quotes on the two currencies.
A lot has changed since that first Trans-Atlantic cable was placed on the floor of the Ocean, but the GBPUSD currency pair continues to remain a favorite to traders around the world.
Characteristics of the GBPUSD
The reasons for GBPUSD’s popularity are abundant. The United Kingdom and the United States represent two of the oldest, modern economies in the world. Both economies feature a relative amount of safety, due in large part to the sheer size that each represents to the overall global economy. Below is a listing of the world’s 10 largest Independent economies (using 2011 IMF Statistics, in Millions of US Dollars):

Perhaps a larger contributing factor to interest in the GBPUSD currency pair is the fact that London is often considered to be the ‘center’ of the Forex trading world.
Estimates approximate that 35% of volume traded in the FX Markets takes place through London. This is the period just before the United States opens for business, leading to some of the most liquid trading times of the day.
As we saw in the article ‘Here is How to Trade Majors like the Euro During Active Hours,’ these market periods can potentially see larger moves as major players in-and-around London enter the market as the UK opens for business.
This can greatly affect the traders approach during the ‘London Session,’ and more specifically in trading the GBPUSD currency pair.
 '
'
Strategies for Trading GBPUSD
Before deciding on the way that you want to trade ‘The Cable,’ you should probably answer another question first.
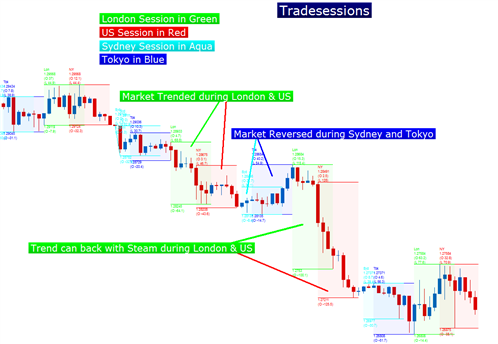
The Asian Session(s) from Sydney and Tokyo have a propensity to be more accommodating for Range-Trading approaches, as hourly moves are – in general – smaller than what we may see during the more active London and US sessions.
Range-Trading approaches often look to buy when price is cheap and at support; and sell when price is expensive, or at resistance.
For traders looking to trade GBPUSD during the more active times in the market, when liquidity is coming from Europe and the United States, breakout trading may be more accommodating. With breakouts, traders are watching support and resistance, much like in the Asian session. But differing from the Asian session, support and resistance may be broken much more frequently as the onslaught of liquidity entering the market can potentially push price in one-direction for an extended period of time.
Below is a picture of a breakout on the AUDUSD currency pair:
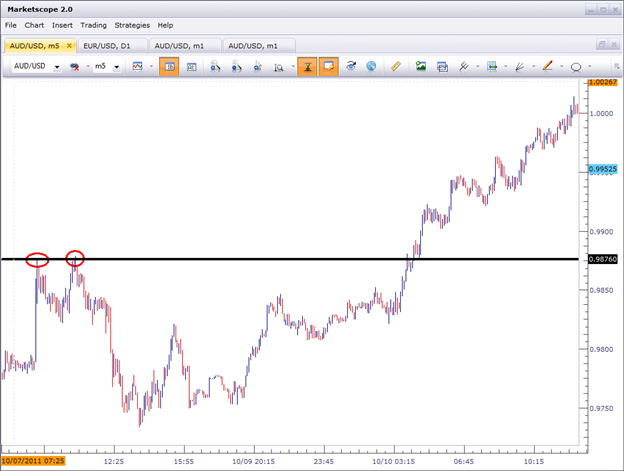
As you can see above, price resisted twice at a price just shy of .9880, but on its third attempt – was able to breakout and run for an extended period of time.
This is what traders speculating during the London and US sessions should be looking for.
Trading Breakouts on GBPUSD
For traders looking to trade breakouts on GBPUSD, there are, once again, quite a few ways of doing so. A key component of trading breakouts is looking for strong risk-reward ratios, such as the trader risking 20 pips, but looking for 100 pips if correct. This could be classified as a 1-to-5 risk-to-reward ratio (20 pips at risk – 100 pips sought = 1:5 risk-to-reward).
With a risk-reward ratio so aggressively on the trader’s side, one would need to be right only 2 out of 5 times to gleam a net profit. If a trader was right 40% of the time with a 1-to-5 risk-to-reward ratio, they could be looking at a handsome profit ( 2 winning trades at 100 pips each = 200 pips won, 3 losing trades at 20 pips each = 60 pips lost, net profit of 140 pips (200-60) not including commissions, slippage, etc).
However, since traders are looking for new high’s or new low’s with breakout strategies – limits or profit targets can be calculated simply by looking for a multiple of the risk amount (i.e., I’m risking 63 pips on this trade, so I will look for 5 times my risk amount (or 315 pips (63 X 5)) for my profit target.
As for strategies to trade breakouts, traders can look to the Price Channel indicator, looking for breaks of the highs and lows that were seen on the longer-term charts.
Whatever your mechanism for identifying support and resistance; looking to trade breaks of these levels during the active period(s) of the day while looking for price to respect these levels during the more quiet periods will generally bring the trader more robust results, in GBPUSD or any of the other ‘major’ currency pairs.
Trading the Dragon: GBPJPY
The British Pound – Japanese Yen currency pair is a volatile offering that presents traders with potentially large moves in price relative to many other pairings. This currency pair is, at times, so volatile that it has earned the nickname of ‘The Dragon,’ as well as another well-coined term: “The Widow-maker.”
Whatever you call it, the fact remains the same: GBPJPY can really move.
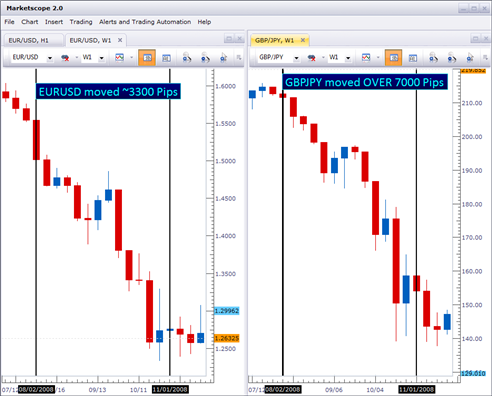
Take, for instance, the initial throws of the Financial Collapse in 2008. While the EURUSD had, at one point, gone down by ~3300 pips, the top-to-bottom move on GBPJPY was much larger: at one point a loss of more than a staggering 7000 pips.
Trading GBPJPY
Trading a currency pair like GBPJPY could be optimal for traders looking for volatility or large moves; but it should be noted that those moves aren’t always very smooth; which is exactly why overall profitability wasn’t higher on the pair.
The first point of emphasis is that given the above points, trading in GBPJPY should always entail a protective stop-loss order. Lack of doing so exposes the trader to significant risks as the pair may trend for an extended period of time.
Due to this volatile nature, and given the fact that the pair could trade with very wide swings in either direction, breakouts can be an attractive approach when trading GBPJPY. This will allow traders to maximize profits on the large swings when they are right; while also allowing them to cut their losses short as the big swings move against them.
With breakout strategies, traders are monitoring support and/or resistance; waiting for a break of the price level with the expectation that once the break is made – price will continue running in that direction, allowing for the maximization of profits in instances when the trader is correct (which is yet another reason stop losses are important, as those extended moves can cost significantly in instances when the trader is incorrect).
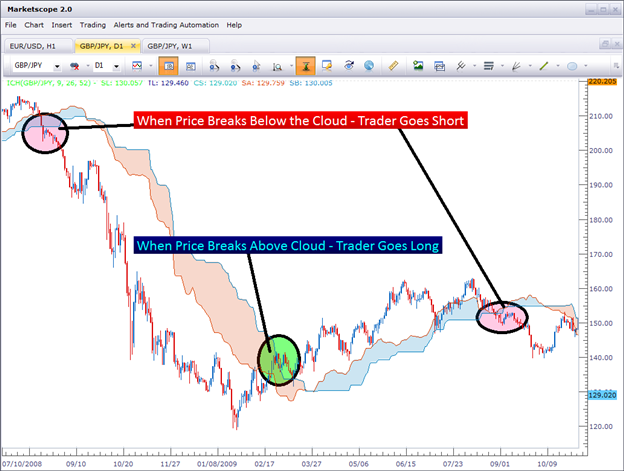
For traders speculating in ¥-denominated currency pairs, Ichimoku may also be a relevant manner of analysis. Ichimoku is a popular technical system that was developed in Japan before World War II. Its staying power as a popular mechanism for initiating trades has continued, as the system is still widely in use today.
Ichimoku is often used as a trend-following system, but with a slight modification can be used to trade in breakout-style scenarios.
A large part Ichimoku is ‘The Cloud,’ which is a moving area of support or resistance plotted on the chart. When price breaks through either side of the cloud, the trader can often look to trade breakouts by placing a trade in that direction.
Trading ’The Aussie’ - AUDUSD
The Australian Dollar, commonly called ‘The Aussie’ is the national currency for the country and continent of Australia, and one of the favorite vehicles of traders around the globe.
In 2012, AUDUSD became the 3rd most popular currency pair in the world, jumping up 2 places from only 2 years before. High interest rates from Australia coupling very strong long-term growth, a robust trading relationship with China and large deposits and exports of natural resources combine to make this a favored asset amongst traders.
One needs only to look at the trend put in by the pair over the past decade to see why:
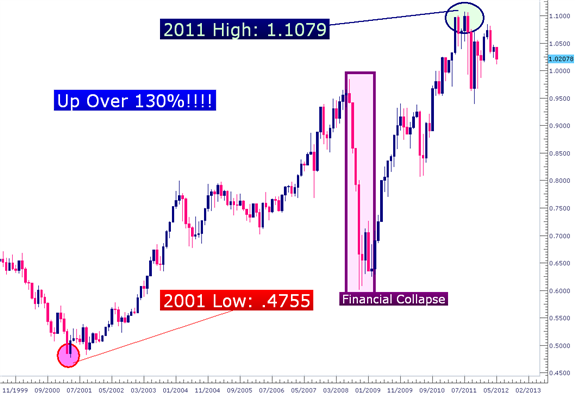
Since 2001 The Aussie has enjoyed a rigorous up-trend that saw its only major test during the 2008 Financial Collapse. Outside of that period, there was most definitely a one-sided bias in the currency pair. Something interesting is happening of late, as the up-trend appears to be congesting, but we’ll get in the last section of the article for ‘Trading the Aussie.’
Why Did the Aussie Trend so Hard for so Long?
A number of factors contributed to the gains in Australia, key of which were:
- High Interest Rates set by the RBA to moderate the inflation that was created from strong growth
- Strong growth brought upon by heavy natural resource and commodity deposits that were being mined, and exported from Australia
- Increasing commodity prices brought upon by even stronger growth from China and India; both of which are key trading partners of Australia
- The aforementioned stronger growth rates being seen in China and Australia only increased the demand for the commodities that Australia was mining and exporting
The economy of Australia had a fairly bullish cycle of events working in its favor, and these are just some of the reasons that traders flocked to the Aussie.
The fact that the RBA is one of the few large Central Banks that hasn’t embarked on some form of government intervention in the past 10 years also helps attract FX traders. Intervention efforts can amount to a financial sucker-punch for traders; unexpectedly reversing strong trends with (or maybe even without) announcements out of the blue.
Australia is one of the few large economies to retain the highest AAA Debt rating, speaking to the political and economic stability that's been seen in the country and yet another contributing factor to the currency’s rising popularity amongst traders.
Trading the Aussie
Because of the high interest rate differential between Australia and the United States, the Aussie-dollar remains a favorite of traders seeking volatility.
During bullish market environments, the AUDUSD can run up faster than many pairs due to its interest rate differential.
During bearish market environments, AUDUSD can fall much faster than many pairs due to its interest rate differential.
In many ways, the Aussie-dollar can offer characteristics similar to high-beta stocks, in which market movements are exaggerated by additional volatility.
Due to the volatile nature of the currency pair, breakout strategies may work best during trending markets. With breakout strategies, traders are monitoring support and/or resistance; waiting for a break of the price level with the expectation that once the break is made – price will continue running in that direction, allowing for the maximization of profits in instances when the trader is correct.
The picture below will illustrate a breakout on the AUDUSD currency pair as it was initially attempting to make its way over parity.

Trading the Yellow Metal - Gold
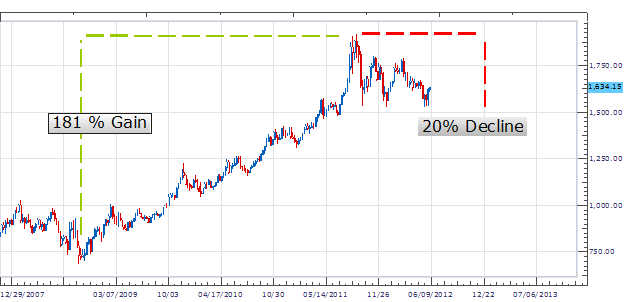
Gold (XAU/USD) has been used as a medium for exchange and a store of value for thousands of years. Normally known as a slow moving asset, gold began the last leg of its rally during the 2008 financial crisis. From the 2008 low, gold has rallied as much as 181% to its current all-time high at 1920.80. Price is currently finding support at 1,522.50 after a 20% decline only a year after a peak was established.
With these sharp movements occurring in such a relatively short period of time, gold often leaves traders with more questions than answers. Today we will be looking at the fundamental factors currently driving the gold market.
Safe Haven Status
With a modern fiat currency system, Gold has lost much of its use for exchange and payments for goods. That doesn’t mean the asset doesn’t have its uses. Gold is now seen as a safe haven investment and used as a store of value. Traditionally investors have parked their funds in gold in order to retain their value and purchasing power. During the financial collapse of 2008 many central banks around the world, such as the Fed in the United States, stepped in to add liquidity (supply of Dollars) to financial markets to stimulate lending and purchasing. This program known as quantitave easing, increased the assets on the Feds balance sheet, and by default weakened the purchasing power of the Dollar. As the USD weakened commodities and gold rallied.
Trading Gold
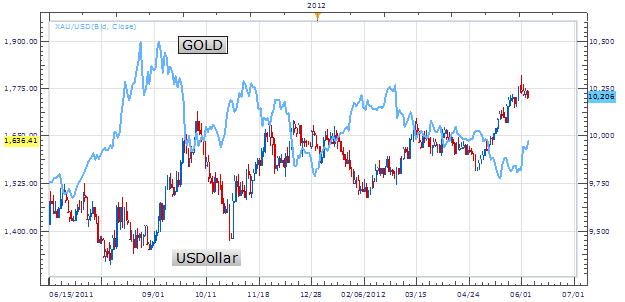
Trading a commodity like Gold it is always important to view the denomination that a commodity is traded in. XAG/USD is based in the US Dollar, and is quoted in Dollars per oz. This means the price of gold is directly impacted by the price of the USD. Below we see Gold compared to the USDollar. These two assets are inversely correlated, meaning they will head in opposing directions. If the USDollar is heading up, expect Gold to be trading down.
This information is very useful to traders that have a general fundamental view of the market. If you have an opinion on Gold or the US Dollar this can be relayed into a trade idea. Often traders that are bullish on Gold choose to trade the AUDUSD instead of the metal itself. The Aussie Dollar carries a 3.50% banking rate, meaning traders can earn additional interest while executing a buy order on a positively correlated opinion of Gold. If a trader is bearish on the AUDUSD currency pair, traders can in turn sell gold to avoid accumulating interest on their trading balance.
Current Price
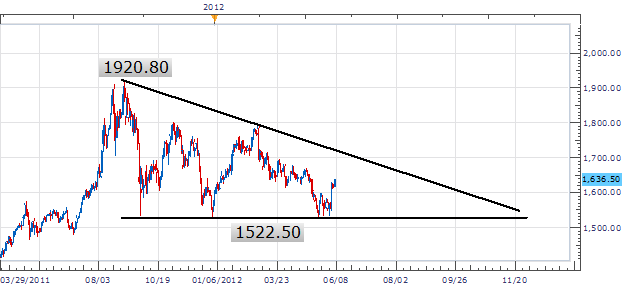
Bellow we can see the current price action on gold (XAUUSD) using a daily chart. The market can be seen consolidating in a triangle pattern between support and resistance. The market has been effectively on hold for the last 10 months neither making new highs or lows as we wait on new economic policy to influence direction. Either a new federal easing program or a resumption of USD strength could push the asset out of this pattern. Until this time, traders can elect to set entry orders waiting for a breakout or elect to trade the interior of the triangle.
The US Dollar: The World’s ’Safe-Haven’
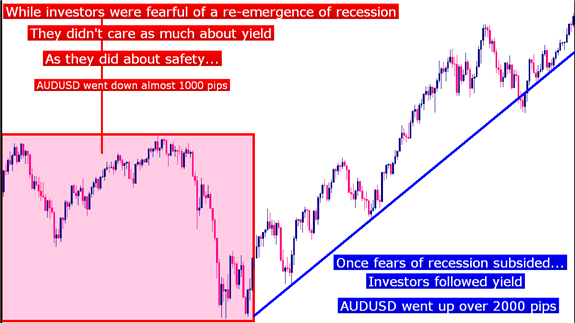
As we often see in the carry trade, investors acting rationally in normal market environments will follow yield. Meaning, if all factors are equal and you are given a choice between an investment paying one percent and an investment paying five percent – most rational people will choose the five percent option.
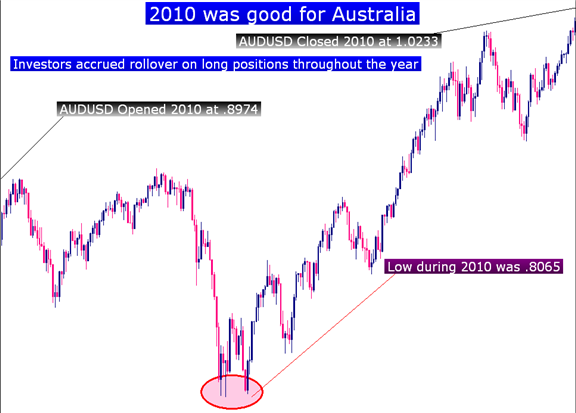
One look at the AUDUSD chart from 2010, which saw lows of .8000 move up to 1.1000, the entire period of which positive rollover was being accrued for holding long positions in the pair, will confirm the fact that, typically, investors will follow yield.
But what happens when the market environment isn’t normal?
Such as the 2008 Financial Collapse... or the Tech bust… or the S&L crisis?
These are just three of the bigger and more recent examples, but you probably see where this is going: While a five percent investment will often be more attractive than the one percent investment – once the question of losing your investment altogether comes into play, the ‘safety’ of each option becomes all the more important.
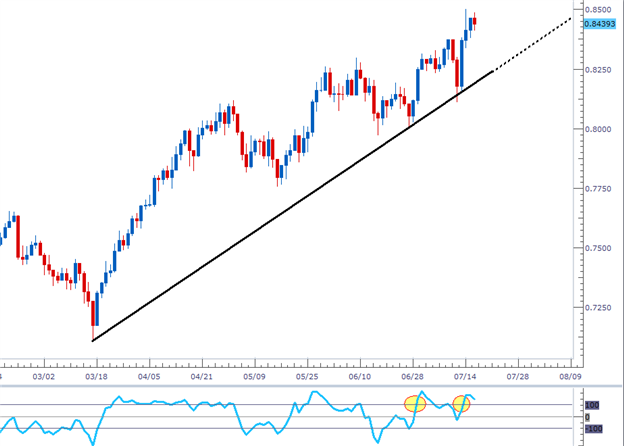
As a matter of fact, if you look at the above chart you’ll notice it wasn’t all roses and daylight for ‘The Aussie’ in 2010. I’ll post the chart below from a different angle than we had looked at previously:
Relative Safety
While the thought of an entire economy such as Europe, or Australia going bankrupt may seem ludicrous, we have to realize that investors, in all of their fashions whether they are hedge fund traders or central bankers – all hate to lose money.
And through the tests of time, the United States Treasury Bill has proved to be one of the safest financial instruments the world has ever seen.
The above chart illustrates this: If investors are fearful of a recession – they will buy US Dollars despite the fact that any potential returns may be minimal. They are instead choosing ‘safety’ over ‘profit potential.’ They can then invest those US Dollars into Treasury Bills, and despite the fact that they may have smaller profit potential there is also a far smaller risk of actually losing their investment.
Because – if I can earn a rollover payment for holding the position at 5 O’clock today – but the trade loses more money than I make in rollover – what is the point?
So if there is perceived economic weakness, investors may run to US Dollars in an attempt to avoid the chaos. This is often called a ‘flight-to-quality,’ or a ‘safe-haven run.’
A strengthening currency, much like what we’ve seen in Switzerland or the ravaged economy of Japan, can rapidly change the balance of payments and cost a country greatly. But because of the sheer size of the United States economy, investors continue to look for ways of safely parking money so that it may not be exposed to principal risk.
Trading Around the Dollar
Traders around the world are increasingly confounded as to how to trade the US Dollar. After multiple scares and momentum shifts pertaining to debt limits, potential Quantitative Easing, and of course – sovereign debt downgrades, many folks are throwing up the white flag on the Greenback and instead choosing to speculate on cross pairs such as EUR/AUD, GBP/NZD, or perhaps even EUR/CHF.
Focusing on cross pairs (that do not include the US Dollar) can be an extremely prudent strategy in markets in which the US Dollar looks like this:
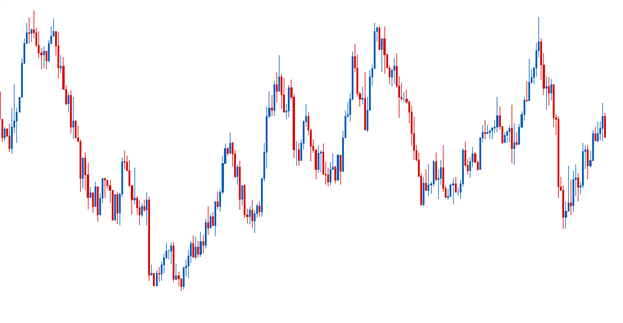
By avoiding the US Dollar, traders can potentially focus on strong trending moves that can be found in the aforementioned ‘cross’ pairs.
But what if the trader was adamant about trading the US Dollar? Perhaps it’s because of the liquidity behind Dollars, or maybe the trader was welcoming the increased volatility that the Greenback is showing us?
To those traders – formulation of strength analysis can add a large arrow in their trading quivers.
By noticing that the NZD/USD currency pair is in the process of formulating an all-time high (currently sitting 70 pips from this level), traders can gleam that in the event of US Dollar weakness; being long the Kiwi-Dollar might not be a bad place to be.
Now that can be great if the US Dollar is weakening; but as we saw in the first chart of this article – the US Dollar also has the propensity to strengthen. What pair can the trader look to in these events?
Once again, I’m going to draw to the strength analysis that I’ve performed. During a good portion of the US Dollar volatility we looked at earlier, the Euro Zone faced quite a few hardships in regards to the sovereign-debt of their nation-state constituents. As a matter of fact, when I perform my strength analysis, the Euro consistently comes up towards the bottom of the list of my strong competitors.
Let’s take this point a little further.
If the US Dollar is strengthening, what situations are we generally looking at as a trader? We know that rate hikes out of the US are probably not coming any time soon (given recent verbiage from Bernanke). We also know the fundamentals of the US economy don’t look so bright (confirmed by speeches last week given by Bernanke). So the primary situation in which we will probably be seeing US Dollar strength would be a ‘flight-to-quality,’ in which traders eschew higher rates of return – instead – for safety of principal.
In that situation – I want to be short on Euro’s – or short the economy with the highest potential for showing us bad news. In these events, I want to look to short the EUR/USD currency pair to take part with my fellow traders in this ‘flight-to-quality.’ 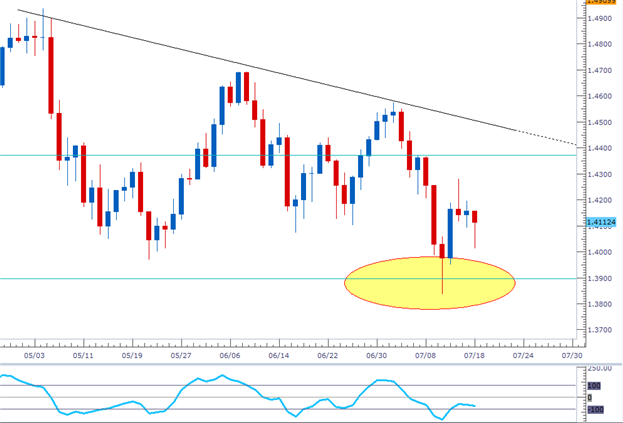
Big Trading Opportunity in World’s Second-Largest Economy
China is the second largest economy in the world, while its currency Renmnibi is not yet a truly international currency. Yet with the fast developments in China’s financial system, more Chinese currency products such as offshore futures have been and will be launched overseas. Investors are likely to be able to trade in a new global currency competing with the dollar and the euro in the near future.
Get to Know the Key Terms
Before investing in this new opportunity, traders will want to understand some key concepts first.
China ‘s currency is officially called the Renminbi, People’s Currency literately. The Yuan is the unit of account, similar to the dollar, so China’s currency also can be called as the Chinese Yuan.
Renminbi, denoted RMB is the name for the currency traded both onshore and offshore.
If the RMB is traded onshore (in mainland China), it is referred to as CNY—traded as USD/CNY.
If the RMB is traded offshore (mainly in Hong Kong), the ticker will be USD/CNH. Thus, RMB is one currency but trades at two different exchange rates depending on locations.
Current RMB Exchange Rate and Markets
Many investors may ignore this potential opportunity as they believe RMB is fixed to the US Dollar. It is partly true. Unlike the U.S. dollar or the Euro, the RMB is not fully-pledged simply based on market supply and demand; instead, the trading price of RMB is managed floating within a range of 0.5 percent around the central parity published by the People’s Bank of China. The central parity is determined by a basket of foreign currency including the US dollar, Euro, Japanese Yen and other currencies.
The good news for traders is that despite of controlled volatility, the intrinsic value of RMB is indeed affected by economic forces in the market. Both hedgers and speculators may take advantage of RMB trading.
In the domestic RMB market, the main players are onshore exporters, who demand CNY and sell the US dollar, and importers pay US dollar with CNY. On the other side, most speculators participate in the offshore currency market via the USDCNH in Hong Kong’s markets. As the demand for CNH usually exceeds supply, which is suppressed by government regulation, the CNH is generally trading above the value of CNY.
Regulator in Focus: People’s Bank of China
The Central Bank of China plays the most important role on formulate policy on the RMB exchange rate and also on the reforms to increase the role of Chinese Yuan on the world stage. Investors will want to keep an eye on it to gauge any clues on fundamental changes and the timing for the Chinese Yuan to become a truly global currency.
In order to keep currency volatility within the expected range, PBOC, the largest currency trader in China with over $3 trillion foreign reserves, purchases or sells the US Dollar in the open market.
Historical Chart for Offshore RMB Exchange Rate versus US Dollar (USD/CNH )
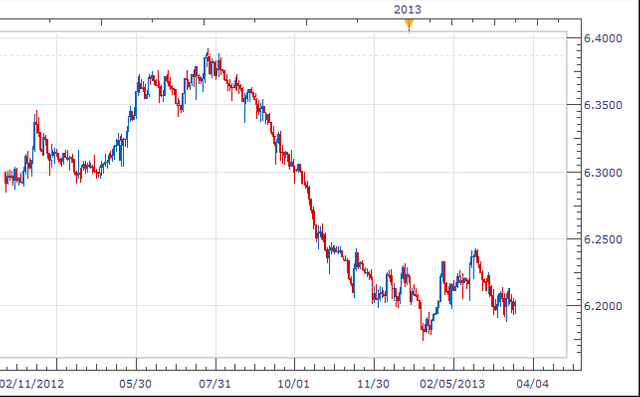
Since the height of the global financial crisis in 2008, China has intensified efforts to promote the RMB as an international currency. Yet more important questions to potential investors are when and how the process will take place. In order to predict future, we first need to review history first in order to determine the critical timing for changes in the Chinese Yuan.
The Renminbi was first issued on December 1, 1948 and soon pegged to the US dollar with USDCNY at approximately2.46Yuan. At that time, China had little international trade so the setup of exchange system remained in in relative infancy.
As imports and exports continued to increase sharply, China adopted a double currency system starting in 1981: regardless of the official exchange rate, a US Dollar at 2.80 Yuan was used for trade settlement.
From 1994, the Chinese government pegged the RMB to the greenback within a narrow range from 8.27 Yuan to 8.28 Yuan. The fixed exchange rate guaranteed a relatively stable financial market and helped protect against external shocks as China’s economy expanded at a fast pace.
On July 21, 2005, the People’s Bank of China announced that it would lift the peg to the US dollar and increased flexibility of RMB exchange rate. Following the release, RMB appreciated by 2 percent to 8.11 Yuan. As the use of China’s currency expanded from trade settlement to offshore financial markets and direct investment, RMB reform and internationalization has accelerated with a market-oriented focus.
Overall, the development of China’s economy is the main driver to RMB globalization.
Good writeup! I saw your fresh account so I'm gonna support you. One upvote for you and we're all waiting to hear more from you!
I am struggeling, like you, to get those big upvotes on my posts so you should try out @MinnowPowerUp where you can earn up to 30% more steem power than just powering up through steemit! It's a subscription based daily upvote bot that draws its power from a delegation pool. I made this post to explain the system in more depth and show how I earn over $1 a day in upvotes.
Congratulations @thefxtrader! You have received a personal award!
Click on the badge to view your Board of Honor.
Congratulations @thefxtrader! You received a personal award!
You can view your badges on your Steem Board and compare to others on the Steem Ranking
Do not miss the last post from @steemitboard:
Vote for @Steemitboard as a witness to get one more award and increased upvotes!