Crypto Academy Season 2 Week 6 Homework Post for (@kouba01) - Cryptocurrency Trading with MACD indicator
This week, the professor explained in detail the MACD indicator that traders often use. It showed us how we can see buy or sell signals. He skillfully explained that in some cases we will receive false signals and how to deal with it.

What is the MACD indicator simply?
It is one of the indicators that traders often use in technical analysis when trading.
MACD stands for Moving Average Convergence Divergence. The MACD indicator is derived by subtracting the 26-day moving average of the cryptocurrency price from its 12-day moving average. It is located above the MACD charts as a 9-day moving average signal chart. The blue line on the charts is the MACD line. The orange line is the signal line.
Is the MACD Indicator Good for Trading Cryptocurrencies?
MACD is one of the frequently used indicators in the cryptocurrency markets. It is made up of moving averages and is therefore a trend-following indicator. It gives you insight into the direction of the trend. It is used to determine potential entry and exit points.
The MACD indicator is one of the indicators that should be used. However, sometimes you may witness it sending out false signals. There is a possibility of sending false signals, especially when moving around the zero line. As the price rises, the signal line could send a signal in the opposite direction. In this case, negative mismatch occurs. As with all indicators, we should not rely on only one indicator while doing technical analysis. We need to combine it with other indicators we know to use. We have to make our move from now on.
Which is better, MACD or RSI?
The RSI indicator was a previous homework topic. It would signal a change in trend direction after overbought or oversold. Since the MACD indicator consists of moving averages, it follows the direction of the trend and starts to give a signal. So the two indicators work in different ways. It would not be right to do a comparison of the two. We know that erroneous signals occur in both RSI and MACD indicators. So both indicators are not perfect indicators. In order to increase our success rate or gain more, we should use two indicators together and do my analysis accordingly.
As a result, both are accepted and frequently used indicators. When we use both together, we achieve the better.

How to add the MACD indicator to the chart, what are its settings, and ways to benefit from them? (Screenshot required)
I use the tradingview website to chart the indicators.
(tradingview Steem /USDT chart)
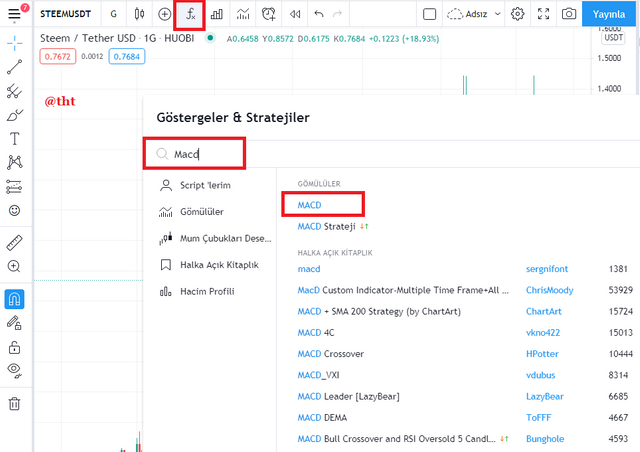
- First I open the cryptocurrency chart. The chart we're going to use is the Steem / USDT pair.
- Click where it says "fx". Type "MACD" in the search box. Then click on the first option that comes out.
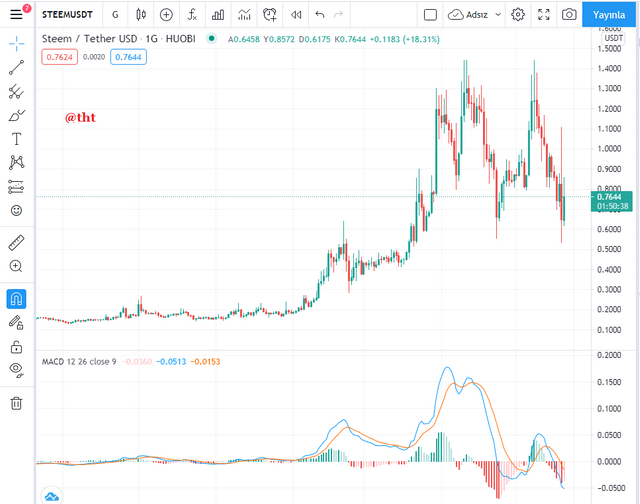
(tradingview Steem /USDT chart)
At the bottom of the chart, there is the MACD line, signal line and histogram line.
MACD Settings
(tradingview Steem/Usdt chart)
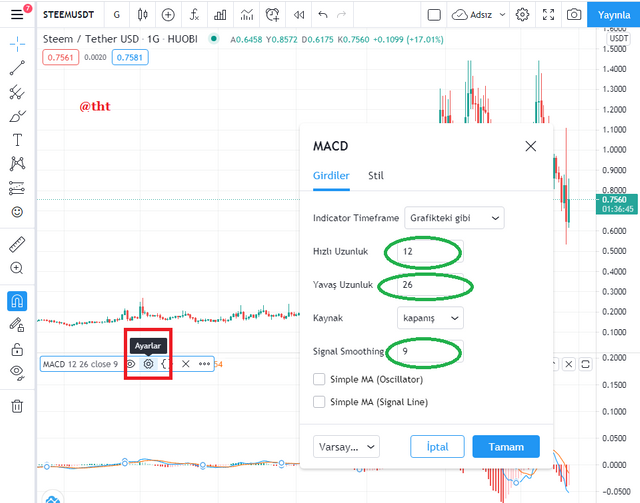
After adding the MACD to our chart, click on the "settings" at the bottom.
Generally, the fast length is 12, the slow length is 26, and the signal smoothing is 9. However, some experts set the fast length to 5, the slow length to 35, and signal smoothing to 5. In this way, they think they will get a more precise indicator.
You can also change the colors of the MACD line, signal line and histogram where it says "Style".
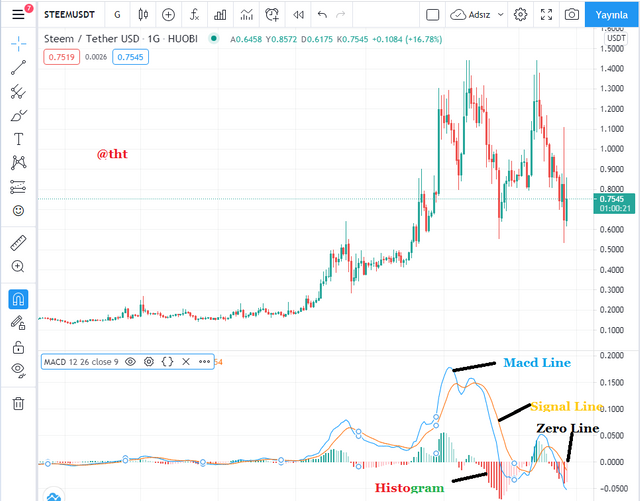
There are 4 parts in the MACD indicator that we should pay attention to. These; It is MACD line, Signal line, Histogram and signal line.
(tradingview Steem /USDT chart)
Macd Line:
The MACD line is calculated by subtracting the 26-day EMA average from the 12-day EMA average. The 26-day period is slower, the 12-day period is faster. The MACD line can be found above or below the zero line. If the value of the 12-day average is more than the value of the 26-day average, the MACD line is above the zero line, indicating a bullish period. Conversely, if the value of the 12-day average is lower than the value of the 26-day average, the MACD line is below the zero line and this indicates the bear period. Some traders consider other values instead of 12 and 26 days.
Signal Line:
It is the 9-day EMA of the MACD line. The 9-day exponential average is used. In some cases (far below or far above the Zero line) when the MACD line and the Signal line intersect, it indicates that events will occur in the opposite direction of the trend.
Histogram:
It is a visual of the movements of the MACD line and the Signal line. When we subtract the signal line from the MACD line, the histogram appears. The histogram can be above or below the zero line. When the histogram moves quickly above the zero line, its downward cut by the signal line is considered a sell signal. When the histogram moves rapidly below the zero line, its cut upwards by the signal line is considered a receive signal.
Zero Line: For the zero line, we can say that it is the midpoint of the histogram. It is likely to produce false signals when moving around the MACD zero line.
How to use MACD with crossing MACD line and signal line? And How to use the MACD with the crossing of the zero line?
To explain this question, it is necessary to show it on the chart. I can show this on a single chart. The way the MACD line crosses the signal line can take two different ways.
a) The MACD line crosses the signal line upwards:
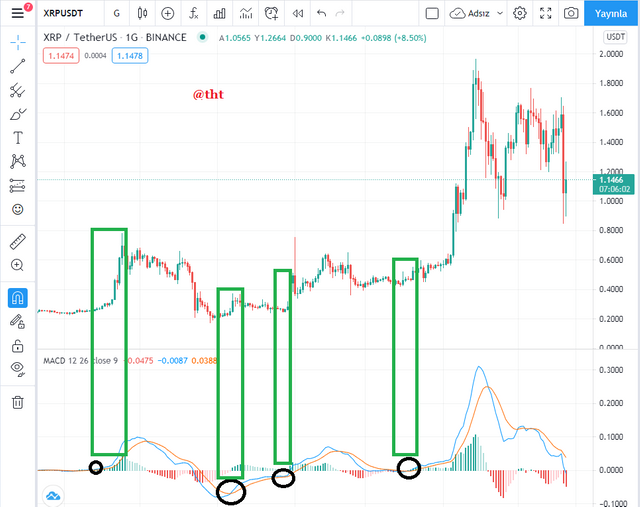
(tradingview XRP /USDT chart)
The MACD line crossing the signal line upwards is perceived as a receive signal. Traders see this as a buy signal and start buying. In such cases, a price increase occurs. In this case, the histogram is on the positive side and colored green. On the graph, it is observed that exactly 4 MACD lines cut the signal line.
b) MACD line crosses the signal line downward: Again, I will show this situation on the same graph.
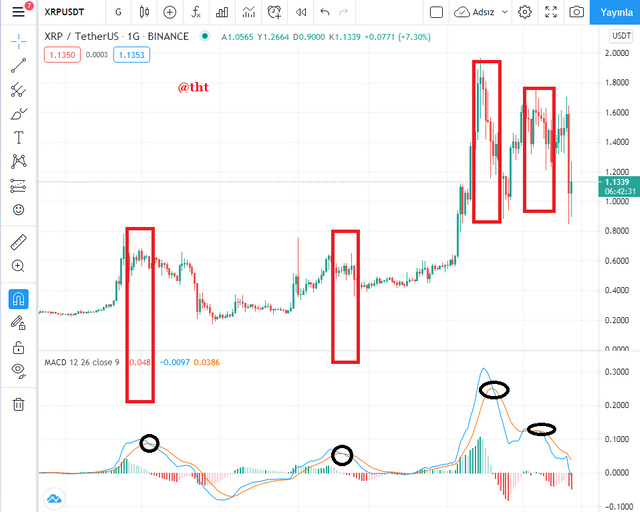
The MACD line crossing the signal line downwards signals a sell signal. Merchants then start selling. The direction of the market begins to change. The histogram starts to form on the negative side and is red in color. I showed 4 formations on the chart.
a) The MACD line crosses the zero line upwards:
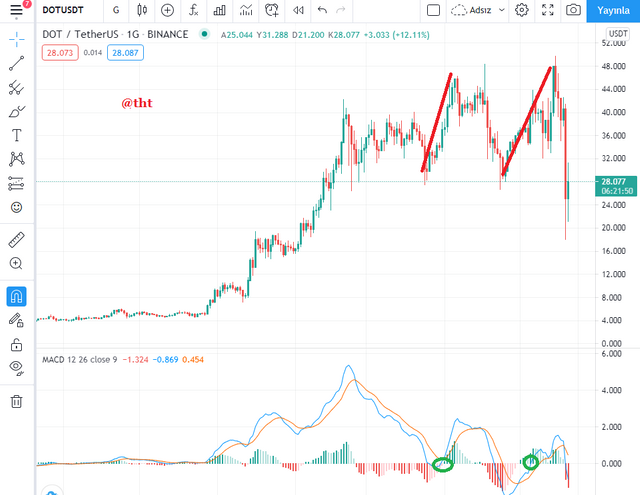
(tradingview DOT /USDT chart)
When the Macd line crosses the zero line upwards, it creates an opportunity to buy. In this case, traders buy. The histogram changes polarity and starts to take place on the positive side. I have shown two occurrences in this chart.
b) MACD line crosses the zero line downward:
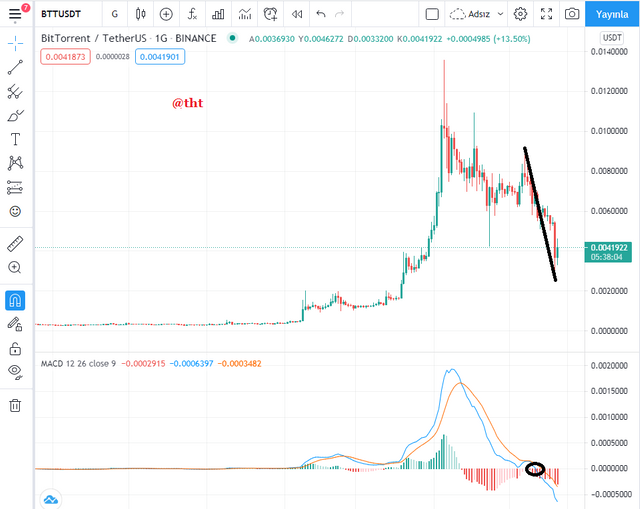
(tradingview BTT/USDT chart)
When the Macd line crosses the zero line down, it becomes a sell signal. In these cases, traders take a sell position. Histogtam begins to change polarity. It goes in the negative direction. I showed 1 formation in this chart.
How to detect a trend using the MACD? And how to filter out false signals? (Screenshot required)
The MACD indicator is one of the most respected indicators used to detect trends in the market. Market direction informs traders about market momentum. The convergence or divergence of the MACD line and the signal line are used to determine market trends. When the MACD line and the signal line are closest to each other, it indicates that the trend is over. When the MACD line and the signal line are the farthest away from each other, this indicates that it increases too much or decreases too much. Now I want to show this on a graph.
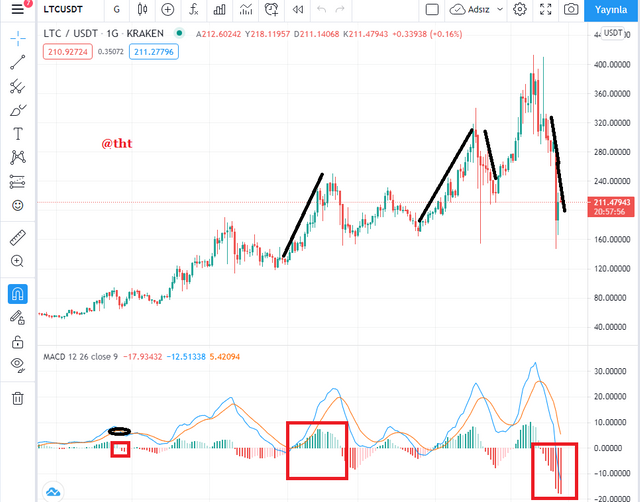
(tradingview LTC /USDT chart)
When you take a good look at the graph, you will see the things I mentioned above. Where the MACD line and the signal line are closest to each other, or where they intersect, the trend seems to end. You can clearly see that the uptrend is over, the downtrend has started or the downtrend has ended, and the starting trend has started. In fact, to see this clearly, you should look where the histogram is the least in volume and is about to change polarity.
Where the Macd line and the signal line are far apart, you can see that the trend direction is very strong. In addition, in these cases, it is possible to immediately see that the histogram takes up a lot of space in terms of volume. The histogram is too much in volume when the uptrend is too high or the decline is too much.
Filtering false signals:
As with other indicators, the MACD indicator may also give false signals. In the previous course, we examined that the RSI indicator also gives false signals. If all the indicators gave very accurate signals, I think every trader would make the right choices and everyone would win.
There are situations where the MACD indicator gives false signals. If the MACD stays higher despite the asset's price falling, there is a false signal here. The divergence here is the bullish divergence.
If the MACD remains at a lower level despite the asset's price increasing, again there is a false signal here. The deflection here is the bearish deflection.
Bullish Divergence :
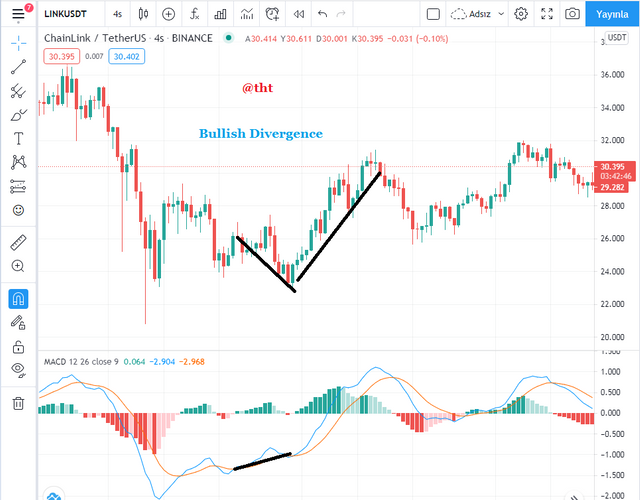
(tradingview LINK /USDT chart)
As you can see on the chart, although the LINK price is falling, there is an increase in the MACD level. We call this a bull deviation. In such cases, a formation occurs in the opposite of the trend. After a while, we can clearly see the incredible increase in the price of LINK.
Bearish Divergence :
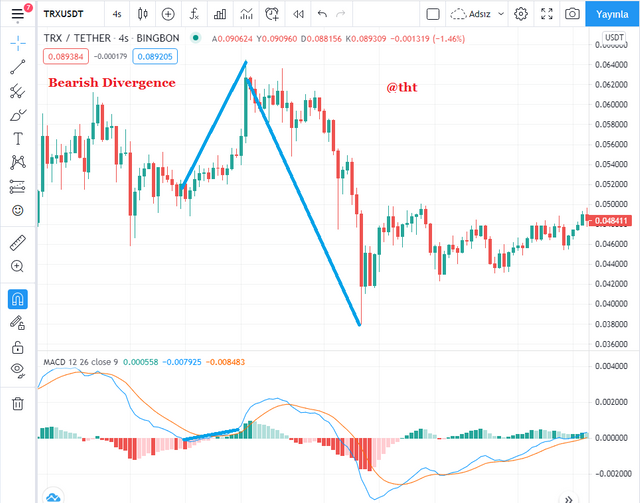
(tradingview TRX /USDT chart)
As you can see on the chart, there is an increase in price. The MACD indicator is not moving in this direction. When I compare the price and the indicator, there is a serious difference. We call this situation bear divergence. In such cases, an opposite trend starts in the trend.
In cases where the MACD indicator shows incorrectly, we can read the market more clearly by using indicators such as RSI. Also, in cases where the MACD indicator shows incorrectly, using stop loss can save you from losses.
How can the MACD indicator be used to extract points or support and resistance levels on the chart? Use an example to explain the strategy. (Screenshot required)
Support and resistance points are the points that traders pay close attention to. Experienced traders buy from support points and sell from resistance points.
When we look at the points where the MACD line and the signal line intersect, we can see the presence of support or resistance points. Whether it passes below or above the signal point indicates different trends. Now I'll show this on the chart.
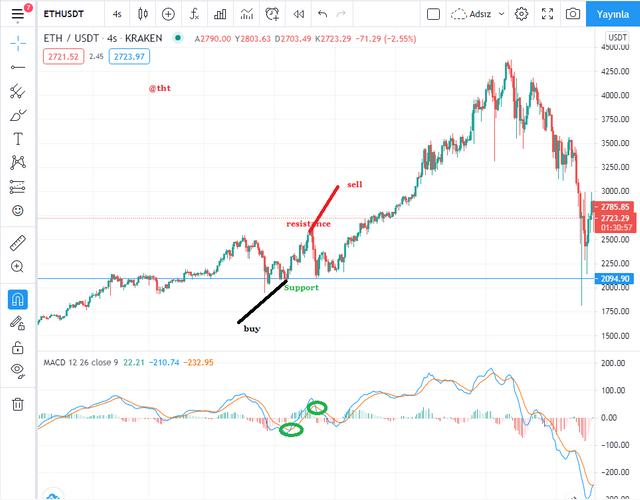
(tradingview ETH/USDT chart)
Where I first circle, the MACD line crosses the signal line upwards. This was showing the buy signal. We can see that there is a support zone just above this intersection. Support zones are also very suitable places to buy.
Where I enclose the second circle, the MACD line crosses the signal line downwards. This is also a signal to sell. You will see the presence of a point of resistance directly above the intersecting area.
In conclusion, at the support levels the MACD line pulls the signal line upwards. These regions are suitable places for purchase. At the resistance levels, the MACD line crosses the signal line down. These regions are suitable for sales. When buying or selling transactions, we must place stop loss where appropriate.
Also, watch how the histogram changes polarity in the support and resistance zones.
Review the chart of any pair and present the various signals from the MACD. (Screenshot required)
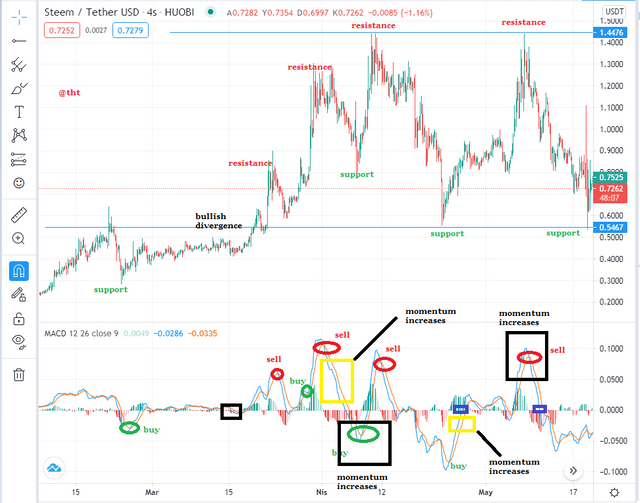
(tradingview Steem/Usdt chart)
I placed the MACD indicator on the Steem chart. I suggest you look carefully at the places I marked "buy". In these places the MACD line crosses the signal line upwards. There is an opportunity to buy and a price increase occurs. After these intersections, the histogram changes polarity and the picture of the histogram changes. In this area, the histogram turns green.
Focus firmly on the places I marked as 'Sell'. Here the MACD line crosses the signal line downwards. This sends a sell signal to the traders. Then there is a sharp drop in price. The histogram immediately starts to reverse polarity. The color of the histogram turns red.
Although the intersection of the MACD line and the signal lines is an important detail, it will sometimes be misleading. We have to be careful that the intersections are in a negative or positive position. The opportunity to buy through the negative can be misleading because there is still a sale in the market.
Where the MACD line crosses the signal line upwards, we can see the presence of the support zone. There is a buying opportunity here. Where the MACD line crosses the signal line downwards, we can see the presence of the resistance zone. There is a sales opportunity here.
Where the MACD line crosses the zero line upwards, signals for reception are formed. After a while, you will see that the price increase has taken place. The first place I marked in purple.
Where the MACD line crosses the zero line downwards, signals for sell are formed. After a while, you will see the price drop.
The divergence of the MACD line and the signal line indicates that the momentum is increasing. I showed these areas with a black box.
Even if we get good signals from the MACD indicator, we should always combine it with other indicators. We must also put stop loss on favorable positions.
Conclusion :
The MACD indicator is very easy to use. It is one of the technical analysis methods that traders often use. The periods when the price may increase give a buy signal, and the periods when the price may decrease give a sell signal. It is very effective in determining market trend and momentum.
Particular attention should be paid to using it in markets where volatility is very high, such as cryptocurrencies. Like other indicators, the MACD indicator does not always show correct data. It is best to use it after combining it with other indicators to increase the success rate or to gain more profit. Also, using stop loss is often helpful.
Cc:
@steemitblog
@kouba01
Twitter sharing
https://twitter.com/Steemtht/status/1395660791454515201
Hi @tht
Thanks for your participation in the Steemit Crypto Academy
Feedback
This is Excellent work. Well done with the practical demonstration of your understanding of the MACD trading indicator.
Homework task
10
Thanks for checking my homework. I wish you convenience in your work.