BRIEF ANALYSIS ON ETHEREUM
Good afternoon friends., Hope you all are doing great?
Thanks to #davosimple that made me found my way down here.
I've been really looking for community i can be Analysing and also explaining to us The concepts and Reasons behind price changes in The Crypto currency Markets.
BRIEF ANALYSIS ON ETHEREUM...
We all know the price of which Ethereum is currently at $3,419 as of today September 8, 2021.
So ... Let's do some analysis as to what is likely to happen to Ethereum looking at the chart...
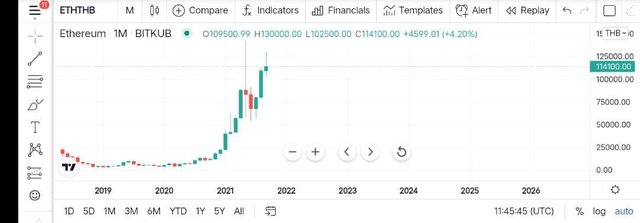
In the photo is a 1 Month Timeframe.. where price has been bullish or in a uptrend over a while, we see series of BOS(Break of structures), pushing to the upside , and lots of traders are looking to go long...
But there was a pull back , or as some call it retest, two red candles at the bullish trend before pushing to the upside...
Why's the red candle there if truly it's an uptrend?

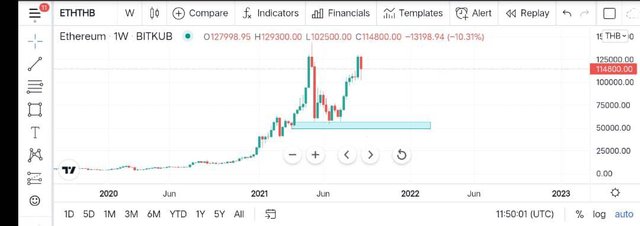
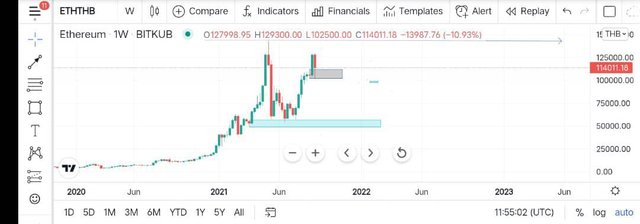
In this second photo... Which is a weekly time frame...
We've seen series of red candles more than that of the monthly time frame....
Now, First, the market makers (if you don't know this , you'll need to keep following me as I'll explain in the course of time) needs to close the sell positions and also close the imbalances they left while pushing the market to bullish.
The highlighted candle is known as the "order block".
So price needs to go back down there close their positions and the imbalances it left... Thereby also giving room or opportunity for traders to continue going Long or adding more positions to their Trade....

For this week .. we'll continue to be in an uptrend till we have new break of structures (BOS).
Because , the gray highlighted area was a new order block which the market had came to test ... And like I said giving room for Traders to go long or add more Positions...
And we'll be having increase in Ethereum's Price this week...
Have a beautiful week ahead...!
Peace✌️

