A history of Bitcoin consolidation patterns...
Some may call these falling wedges, you can call em whatever you want...
Bitcoin has had a very apparent boom and bust cycle.
After it booms, it busts...
Each of these busts have created a falling wedge, descending triangle, flag pattern or whatever you want to call it:
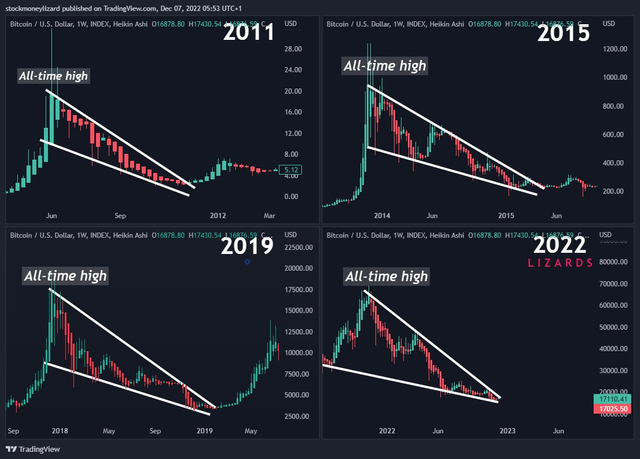
(Source: https://twitter.com/StockmoneyL/status/1600352910402936832/photo/1)
As you can see the price eventually resolved to the upside, though in 2015 it went sideways before turning up.
My guess is this time will be most like 2015 compared with those other patterns shown above.
Upvoted! Thank you for supporting witness @jswit.