BTC 2-week RSI looks very good
Every time Bitcoin has broken the midpoint line, it's gone to the highs.
The 2-week RSI is currently showing a reading of 68.
The peak tends to be over 90.
Every time the RSI has gone above that midpoint line, it eventually gets to those highs before those lows:
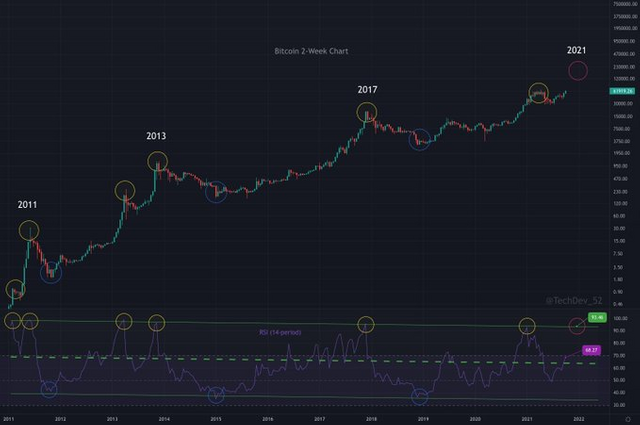
(Source: https://twitter.com/TechDev_52/status/1450104376186523649/photo/1)
Things look very good for a much higher bitcoin price in the coming weeks/months.
best sell indicator there is.
People need to watch this.
Nothing else.
This will help you make the most gains.
Just wait for that rsi touch.
It's 6 for 6 so far.
Those are some good odds!
Bitcoin is clearly overbought, but nothing suggests there will be correction yet...
"overbought" is a relative term. On a short time chart, maybe. On a longer term chart, not so much, which is what this is measuring.
It is a a precarious position. Maybe we see a pullback after the Futures ETF launches tomorrow and that will be our last opportunity to take our positions. Google search trends and volumes haven't impressed me. I'm clearly keeping positions and will never bet against these cryptos.
Yea I suspected a sell the news event as well, though no such event thus far. If we don't get one, we just going to keep going up.
Lately I've been using CoinLore for the metrics... It lists quite a lot of cryptocurrencies that bigger statistics sites don't include...
However most statistics sites have some of the details incorrect due to different cryptocurrencies using own API to broadcast the optional information.