Bitcoin Trades Near $10,000 [Bitcoin Price Update 2/15/2018]
Bitcoin continues to move higher but has hit resistance near $10,000 and near the daily 34 EMA. The rally may need to pause and consolidate before it can move higher.
Daily Chart
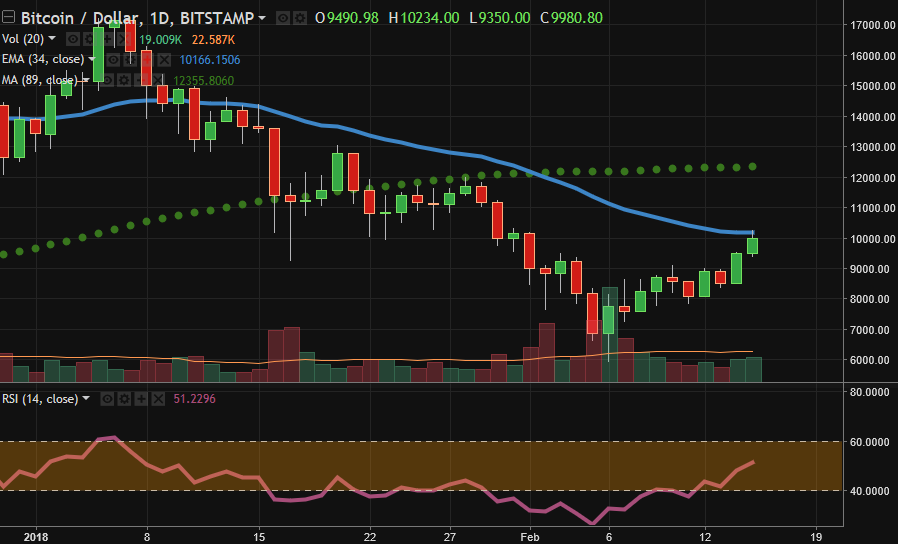
34 EMA: $10,165
89 SMA: $12,355
The daily chart of Bitcoin is still bearish. The falling 34 EMA halted last night's rally near $10,200. The price will likely consolidate below this moving average before making an attempt to break higher and to move toward the 89 SMA near $12,000.
4-Hour Chart
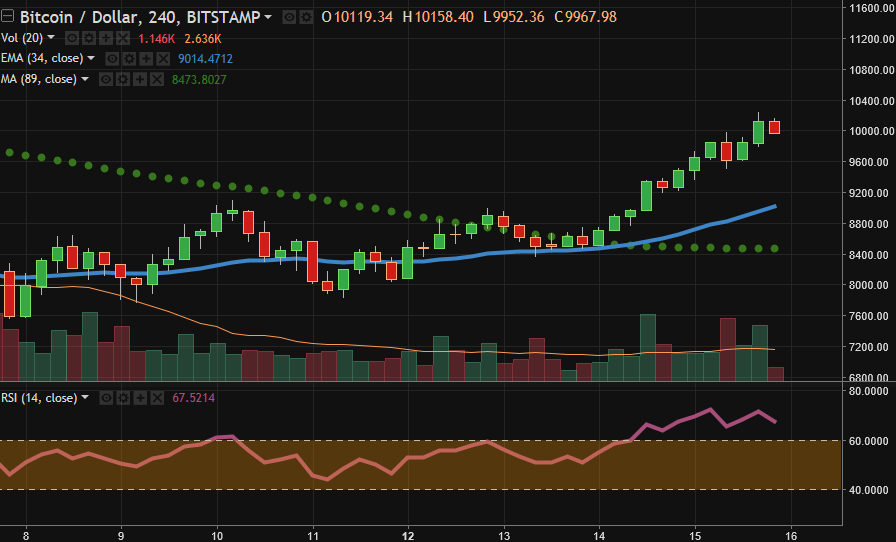
34 EMA: $9,015
89 SMA: $8,475
The 4-hour chart is bullish and BTCUSD trades well above its rising 34 EMA. This moving average will provide support on pullbacks. Overall, this chart says another move higher could be in the cards after Bitcoin takes a breather.
DISCLAIMER
This post is for information and illustrative purposes only. It is not, and should not be regarded as “investment advice” or as a “recommendation” regarding a course of action.
DONATE
Bitcoin: 19498NLGwLbzN7yKrNbYqc4wuwZPkTGMVD
Ethereum: 0x76F2D78c81C6C97473DaF2aa3219F78Ce8C5A92f
Litecoin: LNhKXYTC5t2ZxcKYfo3pMzk8QsjZXsEbgT
CONTACT
twitter: sjanderson144
instagram: sjanderson144