ASTONISHING STRUCTURE Crypto Market Cap Chart MIMICS 2015 BOTTOM Ripple XRP Price Bullish Divergence
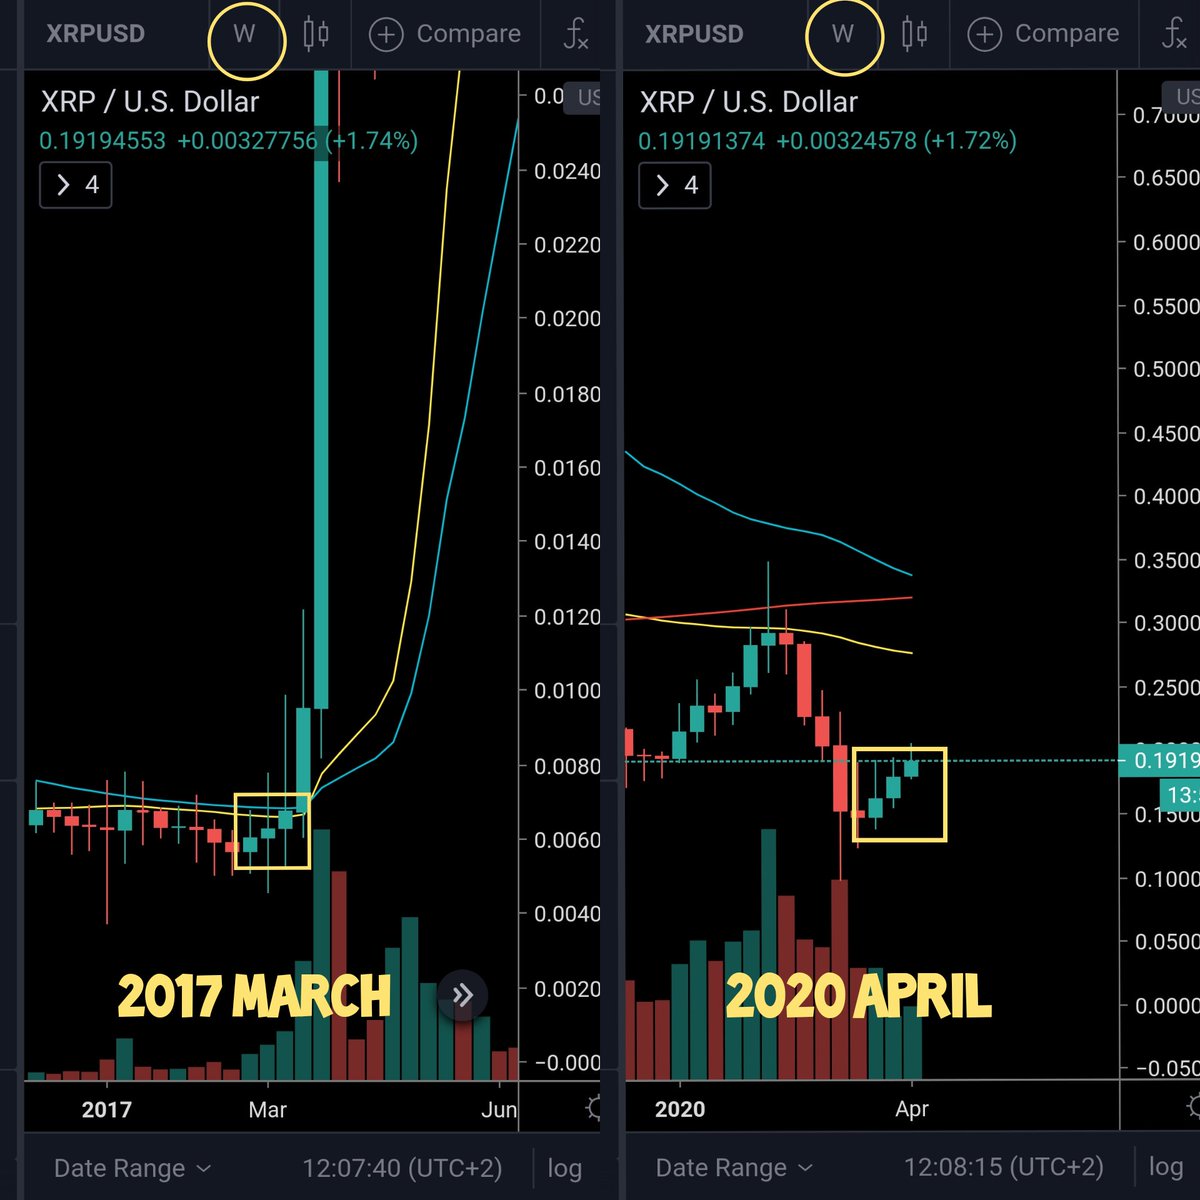
I review several charts, including the Bitcoin Dominance chart, XRP chart and the Altcoin Market Cap chart. When we compare the Altcoin chart to the Bitcoin chart from the last bear market,
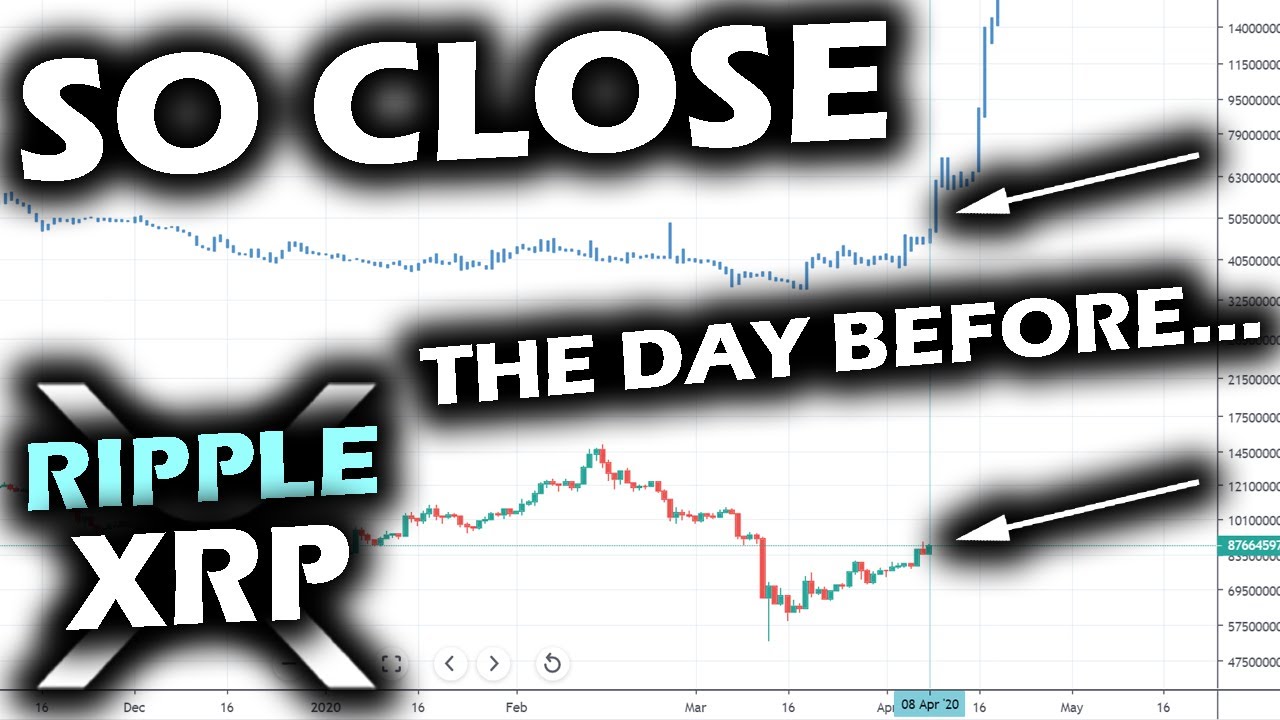
we can see similarities in final accumulation on the bottom. If this is accurate, this is the best time to accumulate that we will ever see again. Like I always say in every video and in every description, I am not a financial advisor and this is not financial advice. However, for me, this looks incredibly promising, and I’m looking for additional entries for MYSELF.
If you would like to check out my other channel dedicated to coin roll hunting and silver stacking,
Hi, I am the Blockchain Backer, bringing you the latest crytocurrency news and analysis. The content of my channel primarily focuses on crypto news, motivation, and chart analysis on the XRP chart, Bitcoin chart, various Altcoin charts, and market cap charts.