How to Value an ICO and Your Investment - Read How!

Hello Crypto Community,
Welcome. I’d like to preface this article by writing that this is my first published piece on steemit and first cryptocurrency project which I am sharing with you here today. I joined the community back in May of 2017.
I was hooked... instantly, to say the least.
The concept and idea was entirely developed by myself. I hope that you find this tool helpful in your investment decision making. This is a work in progress and there are many other features and market factors I will add in the future to get more accurate speculation. I would encourage you to add anything you may find helpful to this project provided you share it with the community.
What Is This All About?
There are several tools and criteria investors look for when buying a coin or when getting behind an ICO.
Some may look at the industry and compare its value to its competitors, chart analysis, press releases, and so forth. One might also look at the circulation of a coin, or total supply.
As we know, market capitalization (MP) = circulation (C) * price (P). The laws of supply and demand state that with high demand and low supply, value rises. Gold, Silver, and Platinum commodities all share a common denominator – rarity.
Can we use the same laws of supply and demand and apply them to cryptocurrency to determine it's value? There is growing debate as to what class asset cryptocurrency falls in. Analyst Chris Burniske believes cryptocurrency deserves an entirely new class.
However controversial the classification may be, the laws of supply and demand do in fact present themselves true when applied to cryptocurrency: the less coins in circulation, the more they are worth and vice versa (with few exceptions).
How Does It Work?
I've created an Excel sheet which populates coin data directly from coinmarketcap.com. Now that we have price, circulation, market capitalization, and other information for virtually all the coins listed from coinmarketcap on our spreadsheet we can use this information to divide coins into tiers based on circulation which will allow us to see what the minimum and maximum price for a coin in each tier is. For this project we are only using the first 150 coins having the highest market capitalization. The 15 tiers are divided as follows:
| Tier | Circulation | Price |
|---|---|---|
| 1 | 1 to 2,000,000 | min/max |
| 2 | 2,000,000 to 5,000,000 | min/max |
| 3 | 5,000,000 to 10,000,000 | min/max |
| 4 | 10,000,000 to 20,000,000 | min/max |
| 5 | 20,000,000 to 40,000,000 | min/max |
| 6 | 40,000,000 to 60,000,000 | min/max |
| 7 | 60,000,000 to 80,000,000 | min/max |
| 8 | 80,000,000 to 100,000,000 | min/max |
| 9 | 100,000,000 to 200,000,000 | min/max |
| 10 | 200,000,000 t o 400,000,000 | min/max |
| 11 | 400,000,000 to 600,000,000 | min/max |
| 12 | 600,000,000 to 1,000,000,000 | min/max |
| 13 | 1,000,000,000 to 10,000,000,000 | min/max |
| 14 | 10,000,000,000 to 50,000,000,000 | min/max |
| 15 | 50,000,000,000 to 500,000,000,000 | min/max |
Here is a quick example of how this would look using the most recent market value from coinmarketcap:
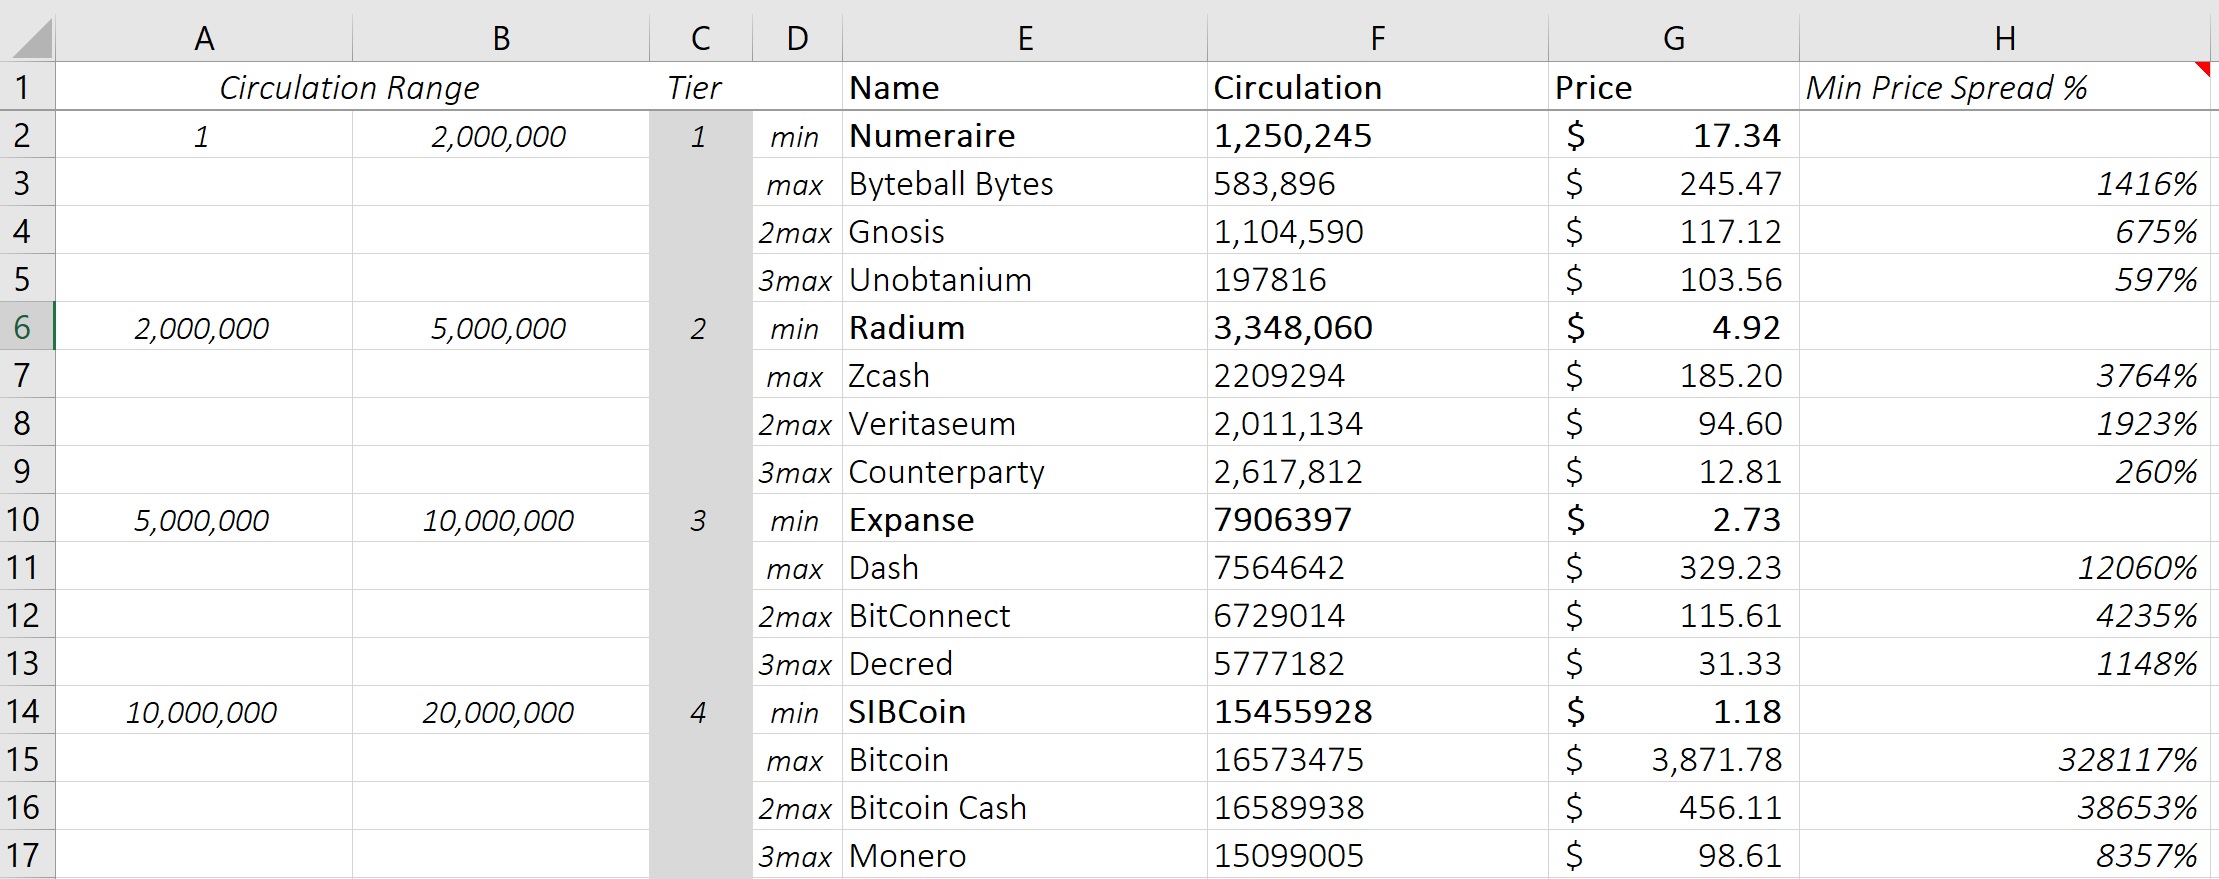
In Tier 1, the minimum price for a coin is at $17.34. It has 1,250,245 coins in circulation.
In Tier 1, the maximum price for a coin is at $245.47. It has 583,896 coins in circulation.
In Tier 1, the second to maximum price for a coin is at $117.12. It has 1,104,590 coins in circulation.
The reason for adding a second and third to maximum price is so that we can get filter out novelty coins such as Bitcoin and Ethereum. Bitcoin is listed in tier 4 and it is highly unlikely that another coin in that tier will reach Bitcoin's current price so we use the second to max price in that same tier which is Bitcoin Cash at $456.11.
Making Sense of the Numbers
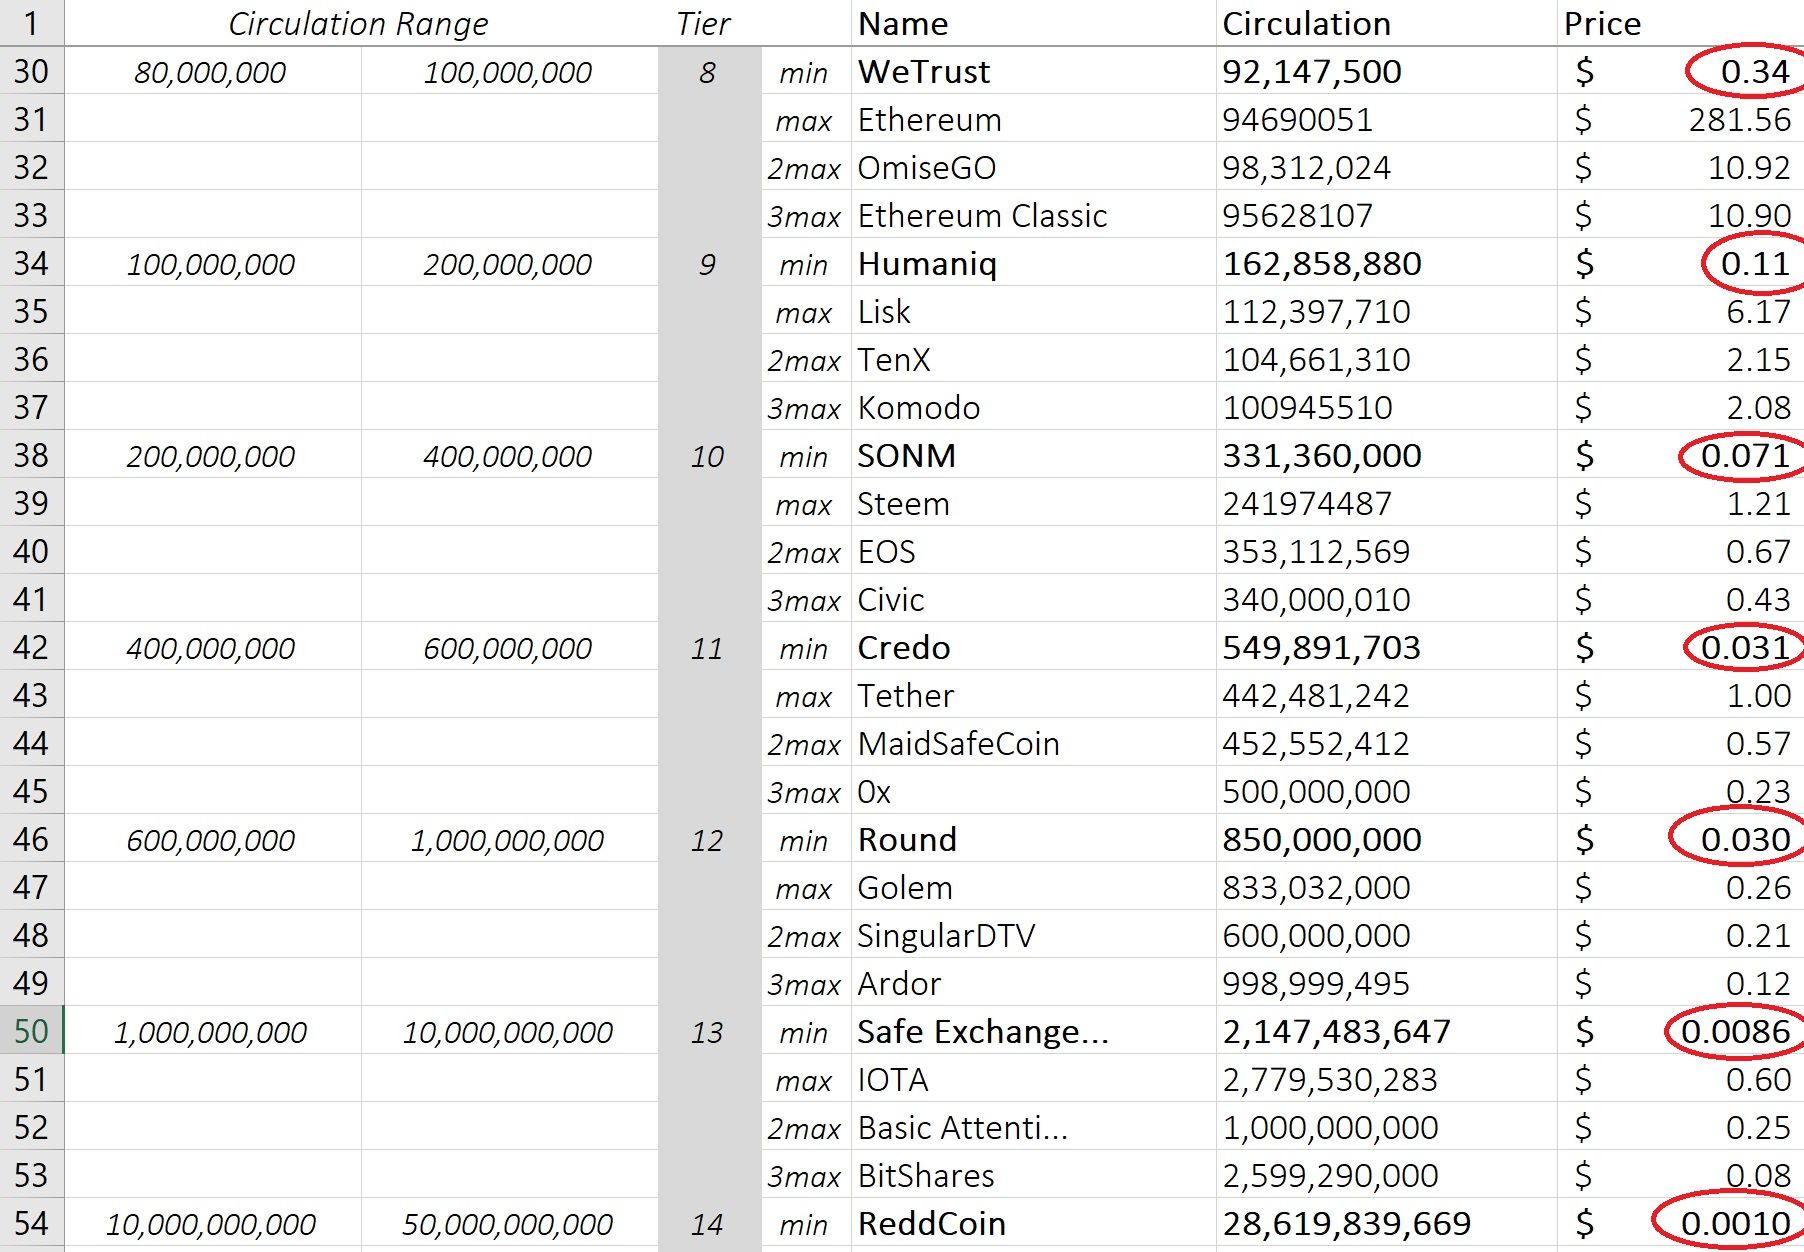
In our previous example we looked at tier 1, or, coins with a current circulation between 1 to 2,000,000. We see that the minimum price to enter this tier is at $17.34, and the maximum price at $245.47. As an investor, can we use this information to develop a theory and conclude that any coin in this tier cannot fall below $17.34 or climb above $245.47? In the long-term, newer coins pose a risk to this theory. A great example is Ripple which dominates it's tier (15). The minimum price for tier 15 is at $.0008 and the second to max price is at $.0013. The maximum price goes to Ripple at $.18. Will there be a new coin in this tier which can surpass Ripple? Maybe. Can Ripple fall below $.0008 and become the new minimum price for this tier? Also maybe, but unlikely.
Since this theory does not hold long-term, does it hold true in the short-term? Probably. What you can see in the images below is that for each succeeding tier the minimum price is never higher than its preceding tier. For example, Radium has a minimum price of $4.92 in tier 2. In the short-term there is very low probability that it will be any lower than the minimum price of tier 3 at $2.73.
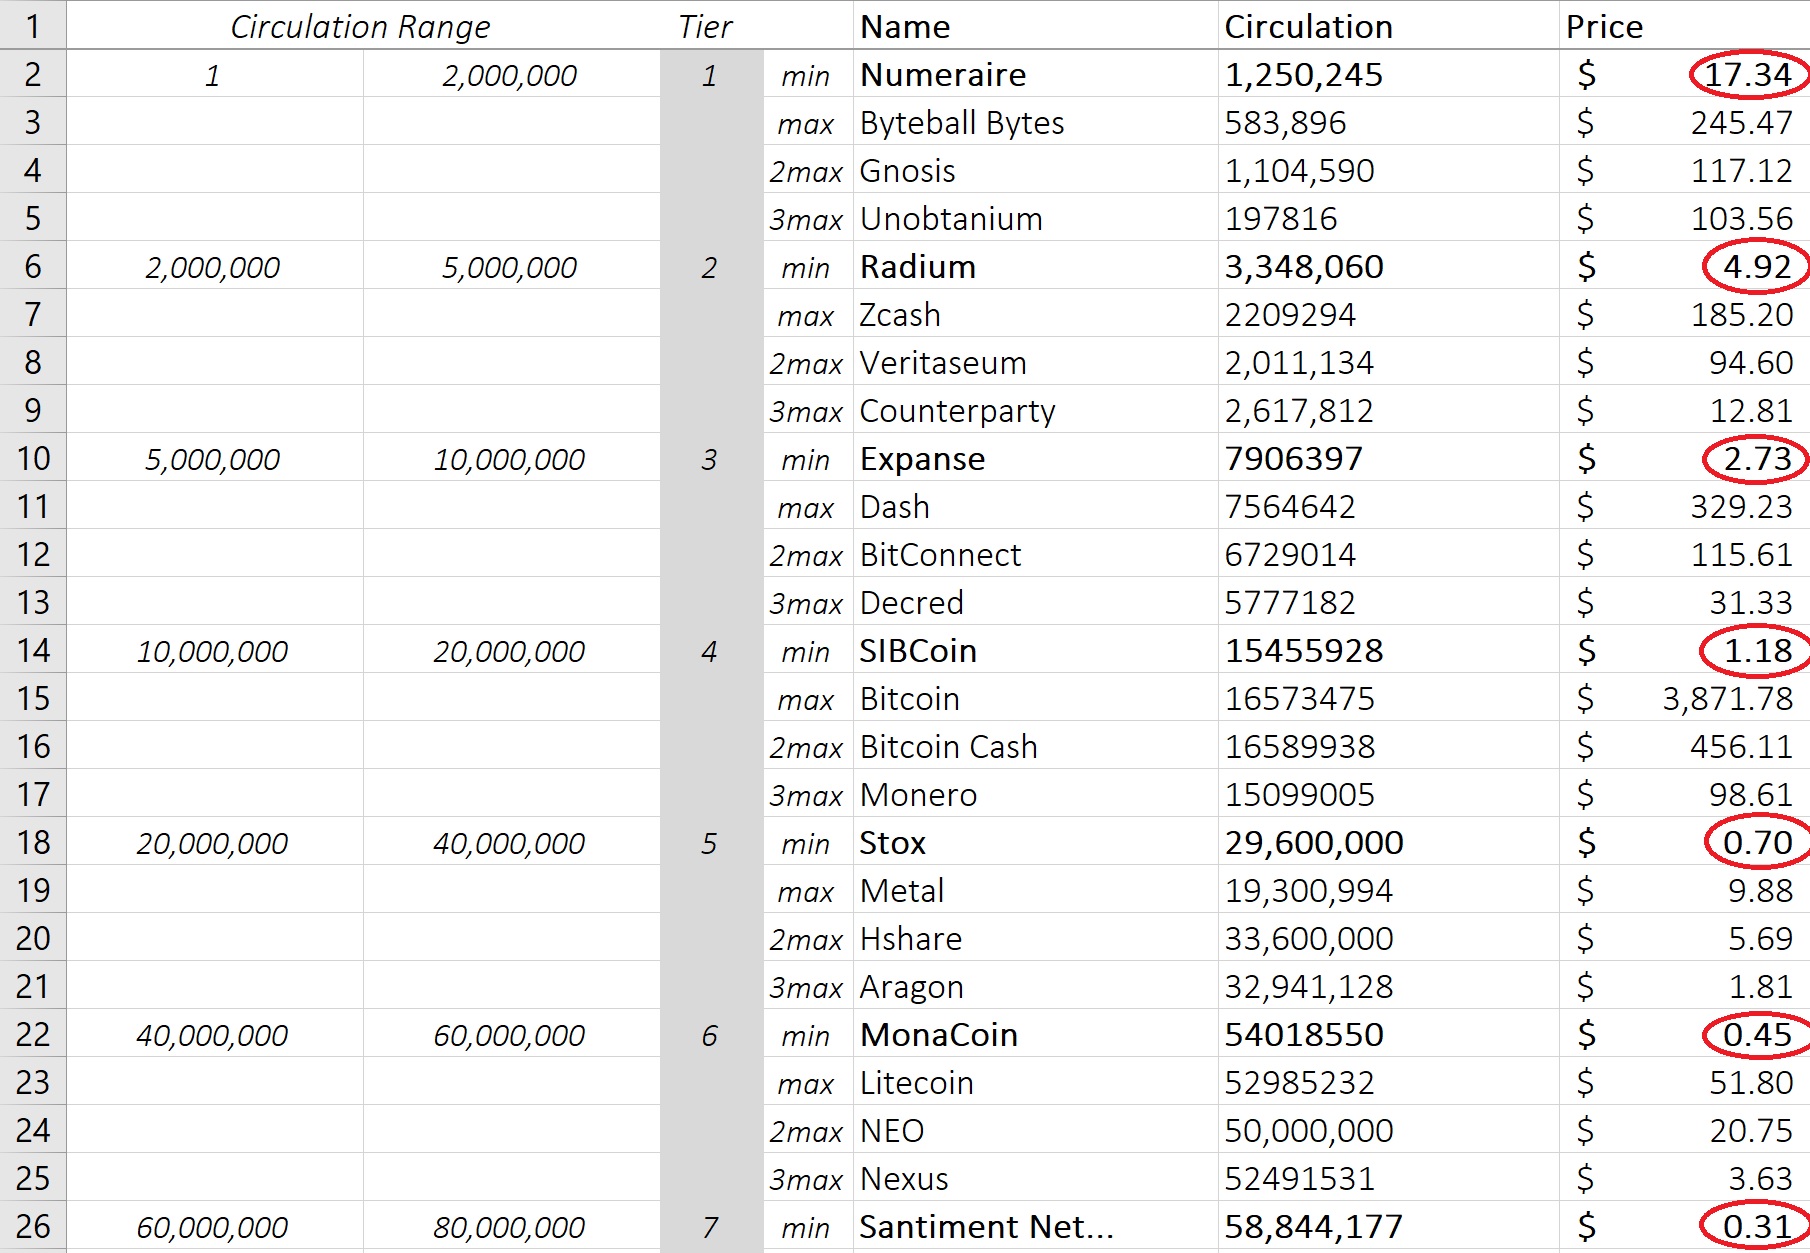
This same law does not hold true however to max prices. There are coins in succeeding tiers which are valued higher than in preceding tiers. Still, using this theory we could assume that Radium, in tier, has the potential to reach a max price of $185.20 (ZCash) in the long-term.
What This Means For Your Investment
Let's say we are interested in an ICO. We know it's total supply and it's price per coin. But how do we know if the ICO is overvalued? Well, we can use the information from the token to sale to categorize this ICO into a tier. Once we know it's tier we can justify this coin never losing it's value more than the min price of the tier. Take a look at the image below:
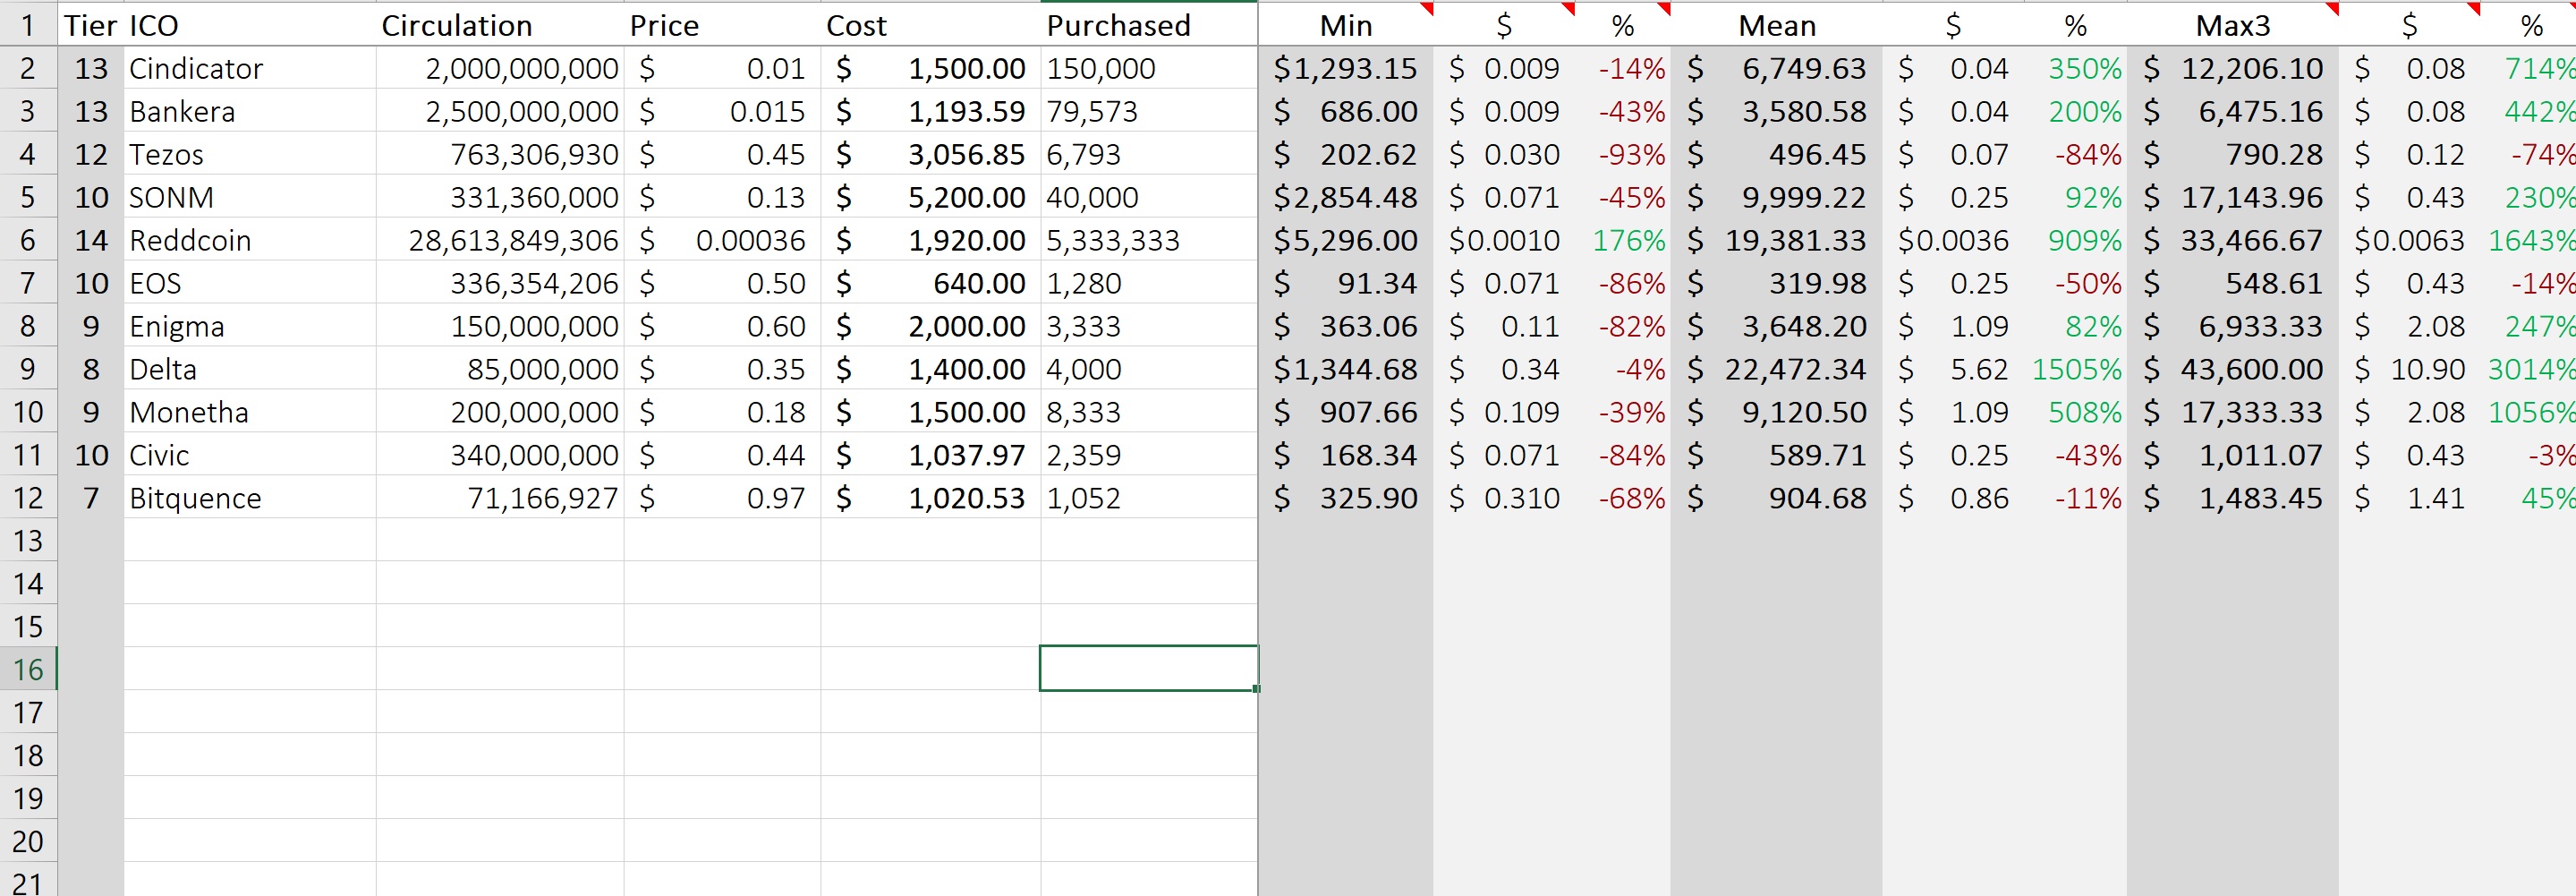
Taking a look at the Cindicator ICO, we input data to the left of the table such as circulation (or, supply), price, and cost. The data presented to the right will tell the investor what the minimum and maximum prices are for that tier.
For Cindictor, we see that the minimum price for this tier is at $.009. Since the price per coin is at $.01, we know almost with absolute certainty that in the short term our investment can only fall by 14%, to $.009. On the upside, Cindicator may rise to the third maximum price of $.08, a 714% increase! Well worth risking 14% of your investment if you ask me.
Guide: How To Use The Spreadsheet
First, click here to download the excel file.
Open the file and enable content viewing and editing if asked.
Once the excel spreadsheet is fully opened and unlocked, the sheet will query coinmarketcap to populate new market prices and data. Give it a few seconds to do this.
*Note: the spreadsheet will query coinmarketcap every time you open the file. It will also query any time you hit "Refresh" under the "Data" tab.
There are 4 sheets within the spreadsheet: rawdata, list, tier, and valuation.
rawdata is where coinmarketcap information populates to. Do not alter this sheet.
list is where 150 of the first high cap coins are pulled from the rawdata sheet. Once refreshing or opening the sheet (querying coinmarketcap) you have to select columns A through F and sort by Circulation, from lowest to highest (A > Z). To sort, go to the Data tab, select Sort, sort by Circulation, order A > Z. You have to do this every time you refresh the sheet or open the file. The next sheet, tier, will not pull the correct data until you do so. Aside from sorting, do not alter this sheet.
tier is where 150 of the coins on the list sheet are divided into 15 tiers. For each tier you can see minimum and maximum prices as well as the names of each coin in that tier. The "Min Price Spread %" column just shows you how much of a difference there is between the min and max prices in that tier. Do not alter this sheet.
Finally, the last and most important sheet is valuation.
We only need to enter: ICO, Circulation, Price, and Cost. The rest will be calculated for you. If you add more coins to the bottom please remember to drag down the formulas to the right of this sheet all across.
Comments and Conclusion
As with any investment, it is always important to consider all factors in investing and to be able to visualize these factors in your decision making. Although this tool should not be used as your only deciding factor to an entry point of an investment or to an ICO, it can certainly help eliminate doubt and give you a clearer picture of where your coin stands in terms of value.
I am looking to further divide the coins into industry pools which will show competitor minimum/maximum prices.
I am also looking to eliminate the sorting step on the list sheet. The only reason for this step is because I could not find a formula that can populate min and max prices based off of circulation from the rawdata tab. If you find a formula that can do so please do share it with us.
Another comment I have is towards the valuation sheet. When inputting circulation for your ICO you can only input total supply since it has not been circulated yet. I would love to hear input on whether we should be dividing tiers based on total supply or circulation and why. Thoughts?
Thank you all for reading and tuning in. Please comment below and feel free to share!
Follow me on Twitter
Wow, great work. I'll try to validate some ICOs and their past performances with this model. It'd be interesting if it holds accurate. You might be onto something! :)
Hey alogns,
Great. Keep in mind that the theory doesn't always hold. For example, today a tier 4 coin at minimum price was more than a min price of a tier 3 coin. Sometimes this does happen, but rarely. So I still think there is a solid case in the short term.
Hey algons,
Have you found anything?
Nice thoughts on numbers, I do consider circulation when choosing the coin. I do consider even more the total amount of the coins to be issued eventually, what should play a dramatic role very long term. Not to mention the advantage of limited emission. We also have to take into account coins emission speed, that may differ a lot. I see some comments from newbies here. Apart from numbers counting, smart investing suggests the understanding of the product you are about to invest in. So before you pick up seemingly undervalued coin, do your research on the coin, how promising the project looks, what's the idea, what are advantages and real use, how large is the coin community (forums), how active developers and marketing are, how many followers on social network and so on. In this case, you will be happy to hold the coin long term not dumping it when there are major downtrends sometimes. There are dead or potentially dead ICO's already with the inactive dev team. Just my 50 cents ))
Hi @mastin,
Thanks for the input.
Absolutely. Although this tool can help you in valuing your initial investment it should not by any means be your sole criteria in dictating whether you should be investing in a coin at a certain price or not. Picking up on trends and hype are important factors as well as comparing the tech of a company to its competitors.
UPDATE:
You now do not have to sort the data from the "list" sheet! I've managed to find a formula which can find the data in order for you.
Now just simply open, let it refresh its data, and input your own data in the valuation sheet. That's it!
thank you for the information steven
Wow love your post, great contents and lessons.
I have upvoted you, follow me so that I will follow you.
this has been an interest of mine for sometimes. with so many damn ico out there, who knows which ones are good or crap. i mean look at jesuscoin. its going to make billions!
so nice info, even people like me can easily understand, who know a little about crypto
Amazing and nice post
I am followed you @stevenamar
Congratulations @stevenamar! You have completed some achievement on Steemit and have been rewarded with new badge(s) :
Click on any badge to view your own Board of Honor on SteemitBoard.
For more information about SteemitBoard, click here
If you no longer want to receive notifications, reply to this comment with the word
STOPdo you think that we need to buy all of min in every tier and hold it for a long term?
I wouldn't recommend that as a long or short term strategy. What I can recommend however is to look at what price ICO's are offered it. If an ICO is cheaper compared to the current minimum in its tier then it's basis for you to understand that the ICO is undervalued hence you have a chance of profiting some % once it hits exchanges.