(XAU | USD) Forex Trading Analysis Today | Gold Analysis July 19, 2023 | XAUUSD Analysis

Forex Trading Analysis
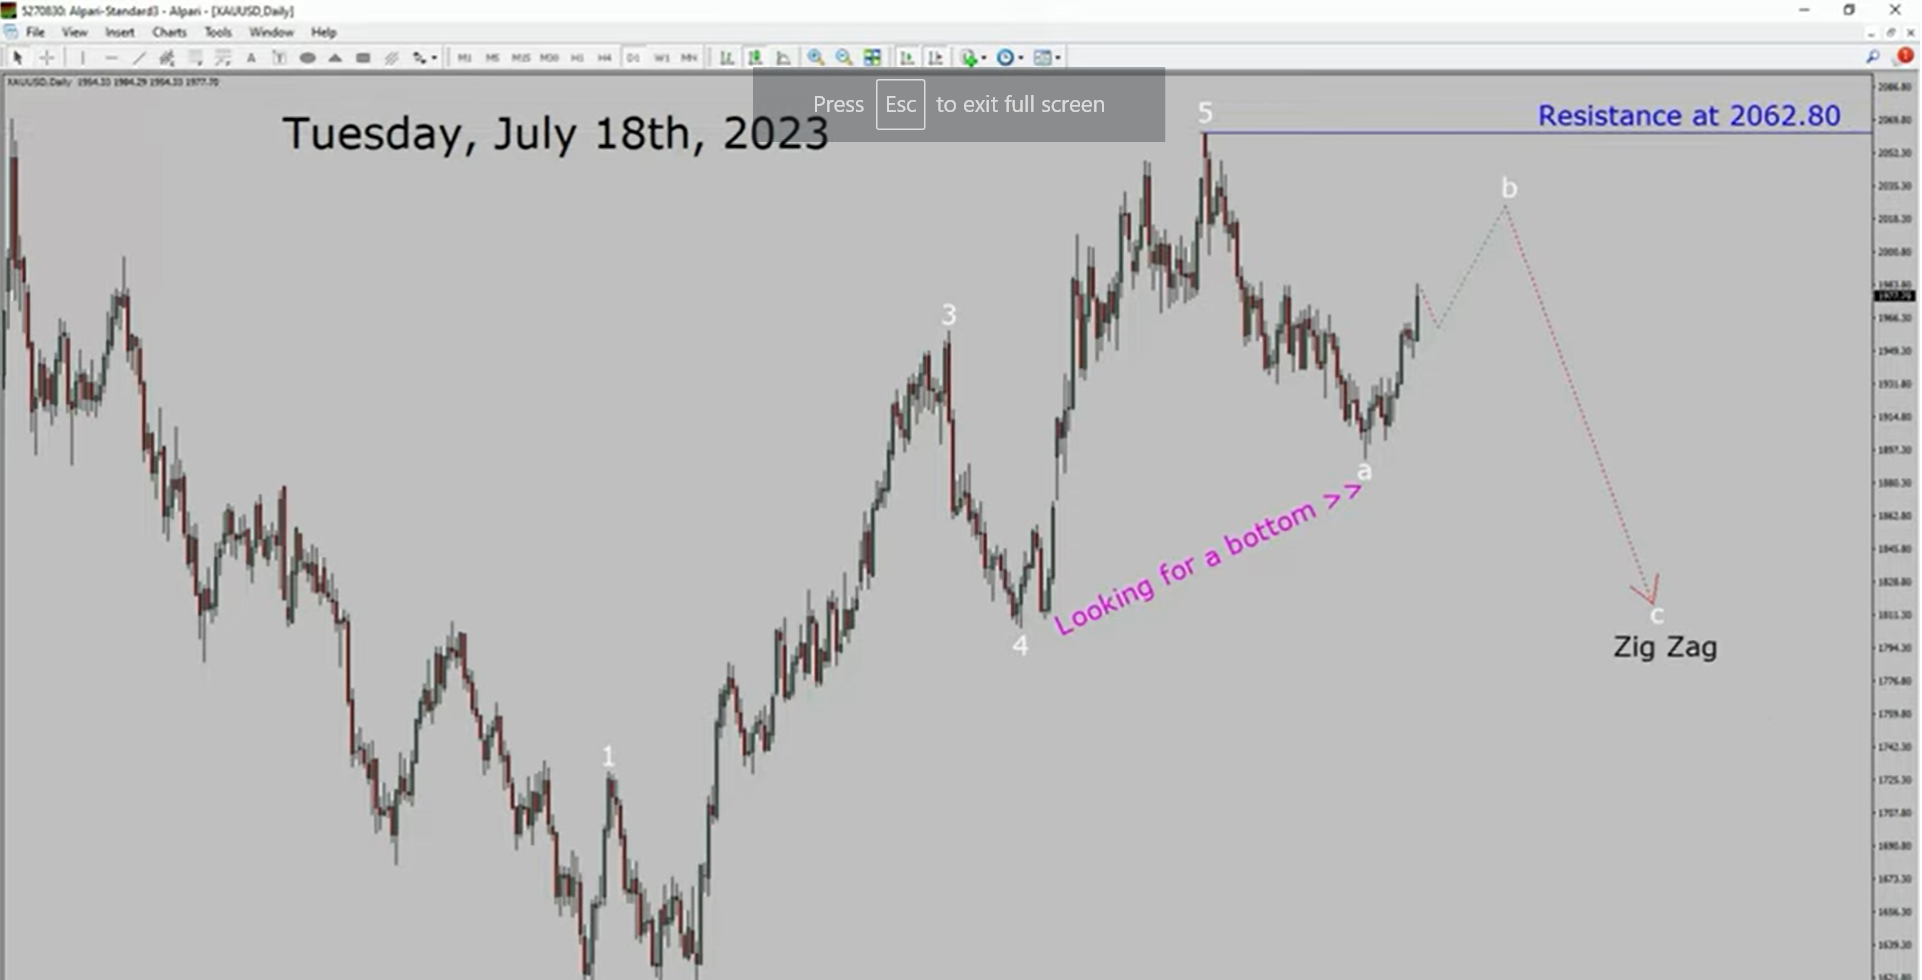
I am going to analyze spot gold versus the US dollar pair let us start the top-to-bottom Elite wave analysis inside the daily time frame the trend is down in spot gold daily time frame resistance is present at the 2062.80 price level price action is most likely going to move sideways and then rise more to complete bullish with B pullback after that I expect bearish UFC's exact corrective like incoming trading days a decisive bullish breakout above 2062.80 resistance area is going to end the downtrend in the daily chart of gold versus US dollar pair
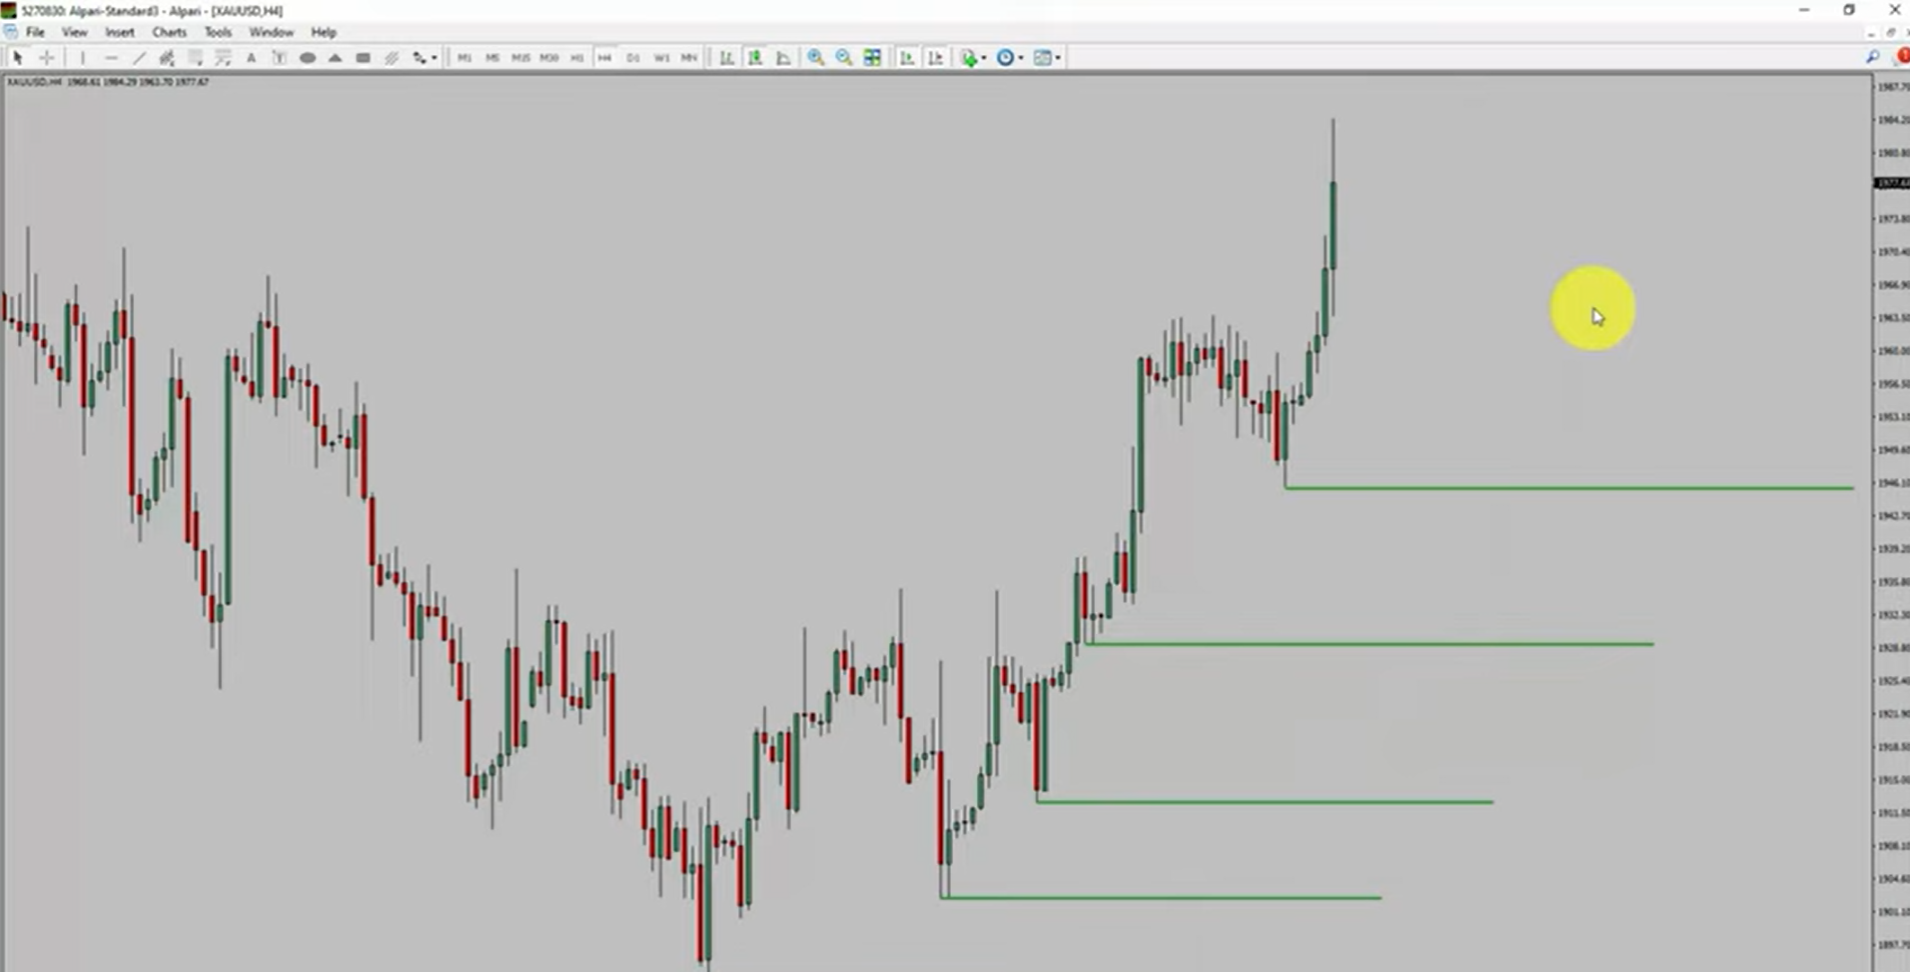
next, let us take a look at the four-hour time frame price action is printing higher swing highs and higher swing lows to me spot gold The trend looks up in the 4-hour time frame
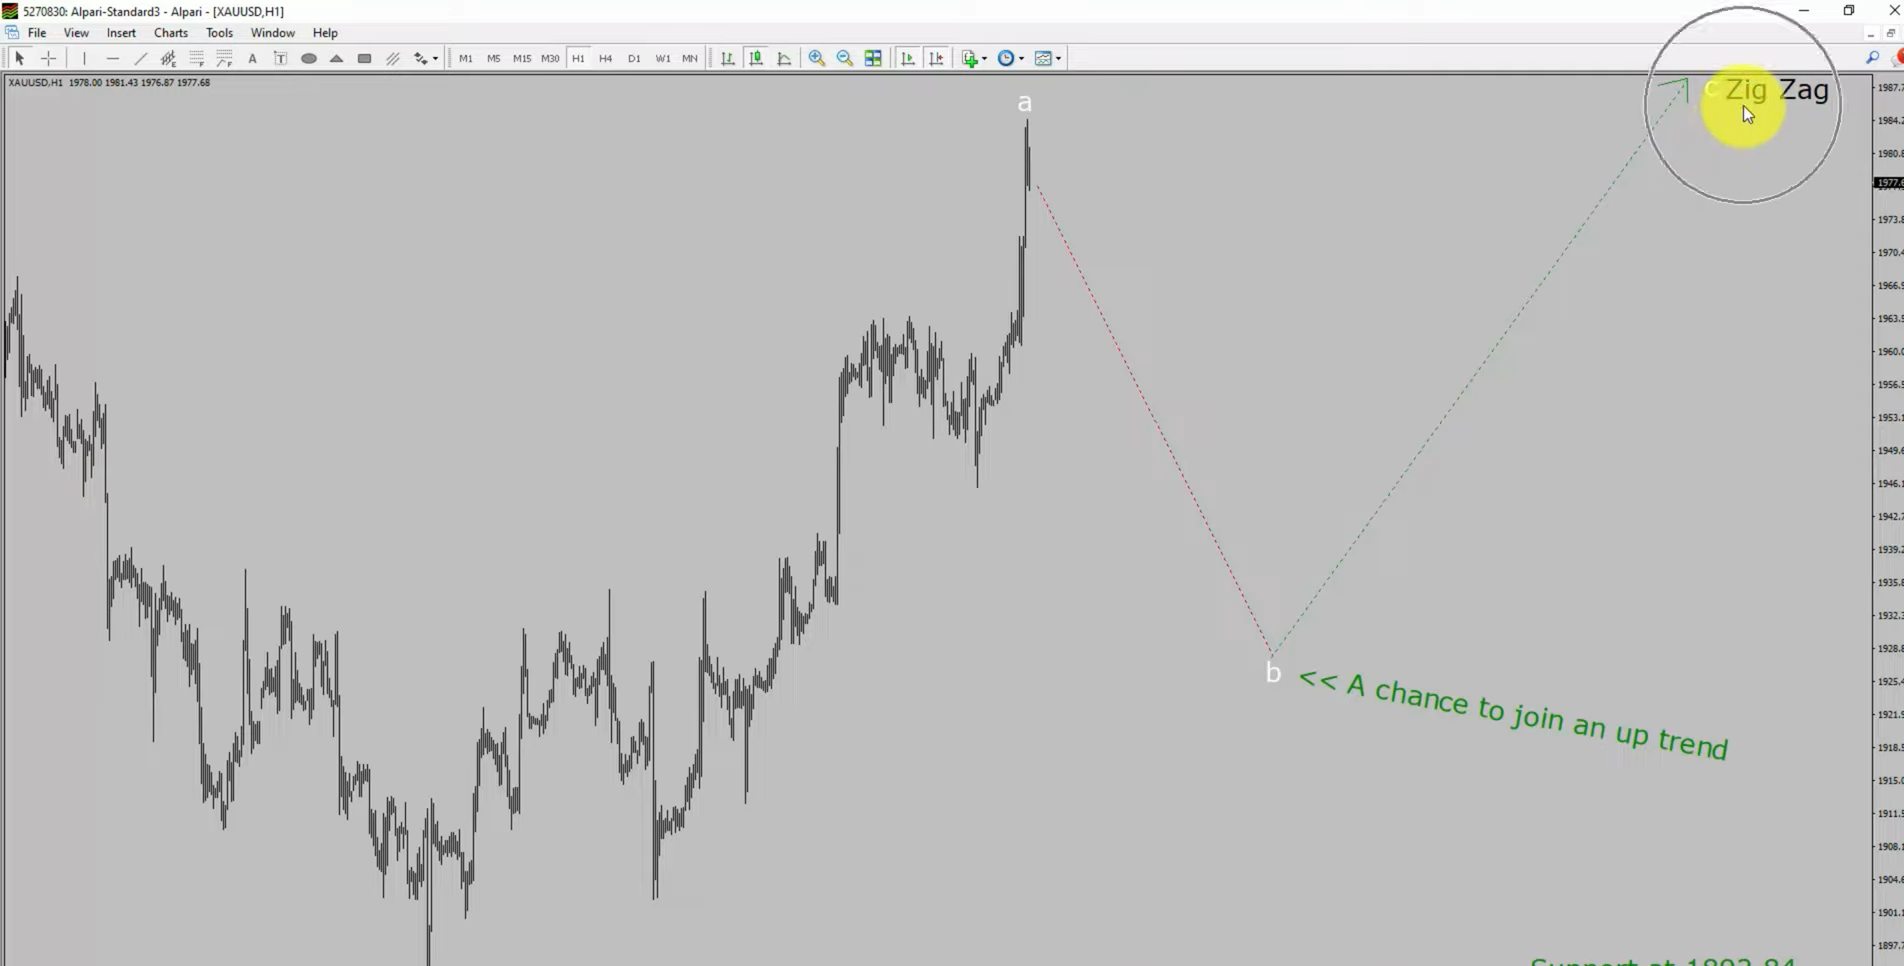
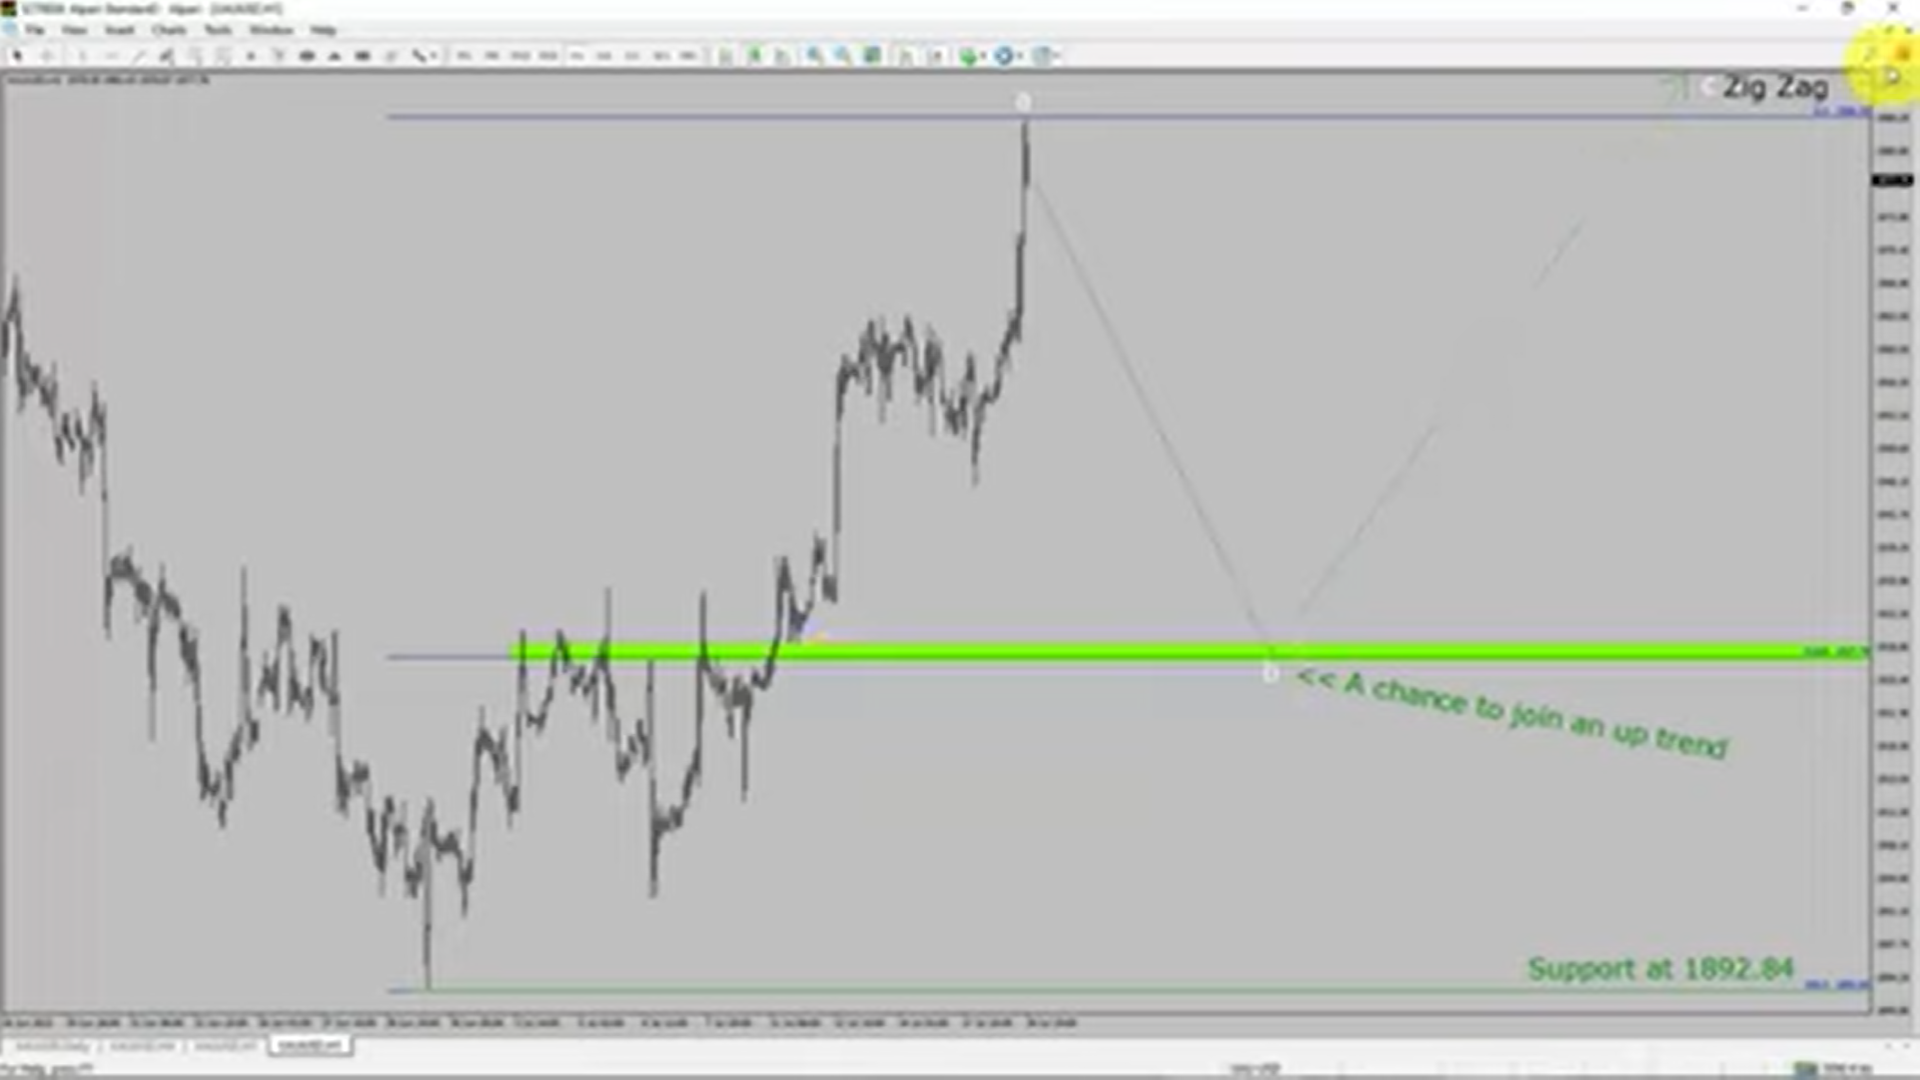
let us take a look at one-hour time frame the trend is up in one hour chart into our day's support is present at the 1892.84 price level price action is the most likely going to drop to print a bearish wave B fallback after that I expect bullish UFC's exact corrective leg which offers a chance to join an uptrend in spot gold uh decisive bearish break below 1892.84 support level is going to end up Trend in one hour chart of gold versus United States dollar pair to be more specifically the green color the highlighted area offers a buying opportunity which is the previous second wave one lesser degree take notes you must always trade with money management rules to control risk