Homework-Task 1 || Why Technical knowledge is Important in Trading and How To Read, Understand The Technical Chart by @stream4u

image source
Q.What is the role of a Technical chart?
Answer: Usually technical analysis is done through charts or graphs. These look like all business/work charts. However, a crypto market chart is a graphical representation of the fluctuations in the price of a currency over a period of time. And the main component of this chart is some price field.
source
Opening Price: The first portion of a currency that is traded after the start of daily trading is the opening price of the shares of that crypto on that day.
Highest Price: The highest price for the currency that is traded every day before the end of the transaction is the Highest Price of that day.
Lowest Price: The lowest price for the currency that is traded until the end of each day's trading is the lowest price of that day.
Closing Price: The last money that is traded on that currency until the closing of the day is the closing price of that crypto on that day.
With this Open, High, Low, and Close Price, different types of charts are analyzed.
Chart Features: There are a few things to keep in mind when analyzing a chart. Such as time scale, price scale. The time scale refers to the different periods of cryptos, it can range from a few minutes to a few years. However, time scale usually means daily, weekly, monthly, quarterly, and yearly calculations.
source
Q.Why do you think Technical knowledge is important?
Answer: In technical analysis, traders trade based on price movement. The key is that a trader can see the past price movement, understand the current price movement and gain an idea of what the future price will look like. All the previous price movement charts will be given in your chart. So you can see what happened before if you want. You must have heard, "History is reflected again and again"? Such is the technical analysis. What happened in the past, we can hope that will happen in the future. If a price level has previously acted as support or resistance, traders will have an eye on that and they will trade based on that. Through technical analysis, we try to match the same pattern that happened before and since it happened before, we hope that the same thing may happen again as before. The technical analysis depends on how you do the analysis. Tom and Jerry might analyze by looking at the same charts and indicators, but they may not get the same trade idea, they may get different trade ideas. The fact is that you need to know the basics of technical analysis.
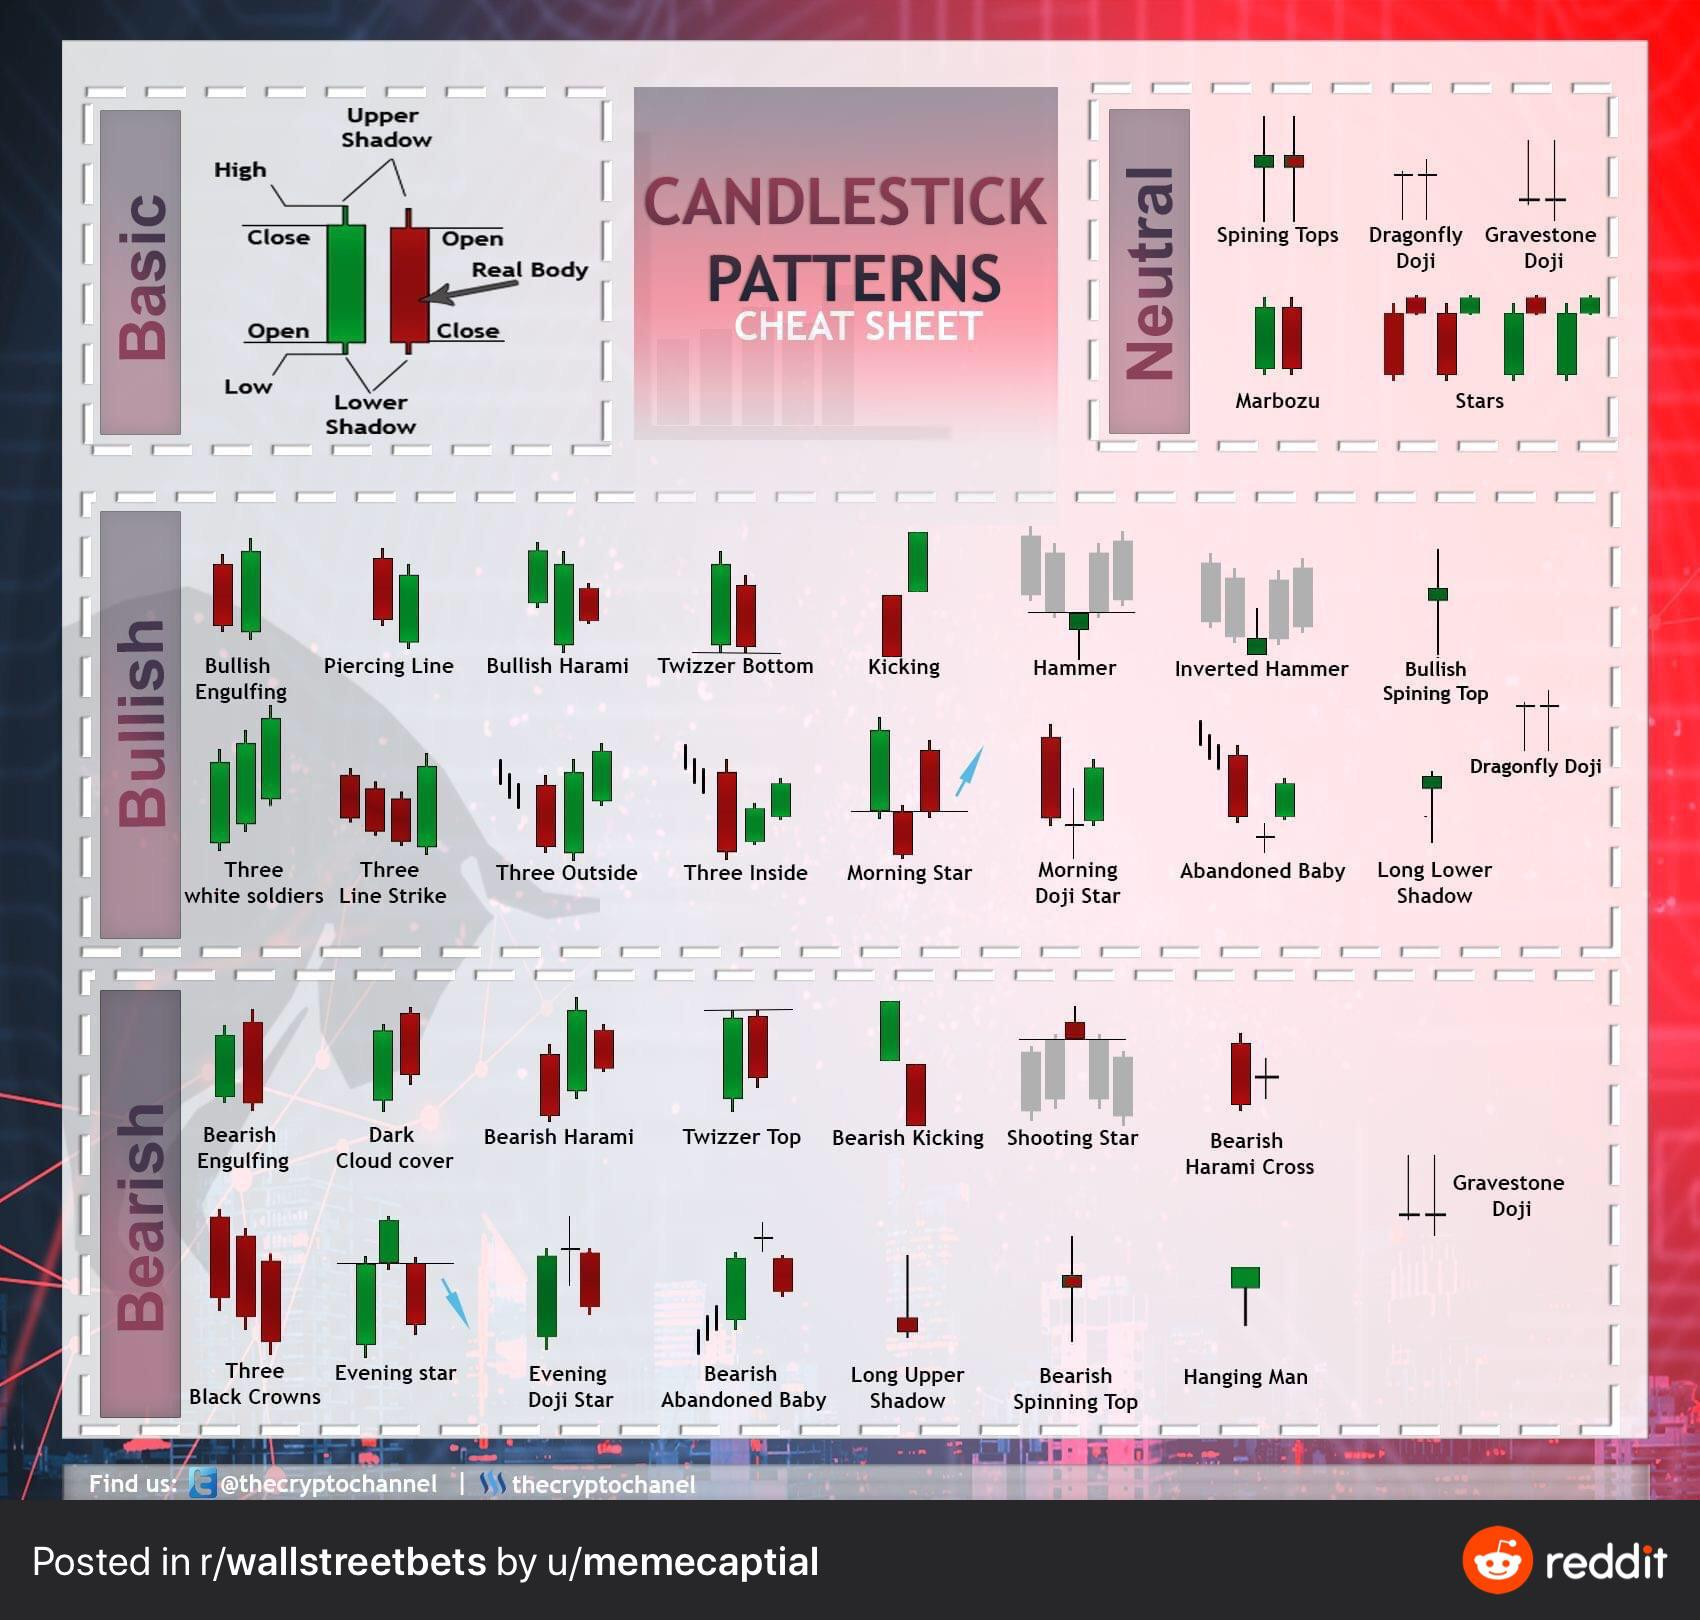
Q.Uptrend or downtrend, which one is good for buy a coin, explain why?
Answer: If the Closing Price is higher than the Opening Price of a currency, that Candlestick is called Bullish Candlestick. Bullish Candlestick colors are usually green. For example, the trading starts at Tk 178, the highest price is Tk 190, the lowest price is Tk 176, and ends at Tk 184 at the end of the day. If the Closing Price is less than the Opening Price of a currency, then that Candlestick is called Bearish Candlestick. Bearish Candlestick colors are usually red. For example, the trading starts at Tk 192, the highest price was Tk 196, the lowest price was Tk 167, and ended at Tk 174 at the end of the day. With these two types of "candlestick" in 1 day's trading of shares of a company, the buying and selling pressure is explained.
source
The most useful information for technical analysis is to know the daily volume of buying and selling of currencies. Then we have to assume that a large number of people are interested in trading at this price and this price is the reasonable price for that day. On the other hand, if the volume of buying and selling is low, then it should be understood that few people are interested in the transaction and the price at which the transaction will take place on that day may not be a reasonable price for 7 days. For most technical analysts Integrated form. It is easy to understand the current position of a company by looking at the volume with the fluctuations of the price at different stages on a given day. Institutional traders usually understand the attitude of the volume and the direction of the movement of the stock with the price. Uptrend offers financial backers the chance to exchange and make benefits by selling at a higher rate. So I will essentially purchase at the downtrend and sell at the Uptrend to make benefits. However, investors should invest considering both reasonable price and volume.
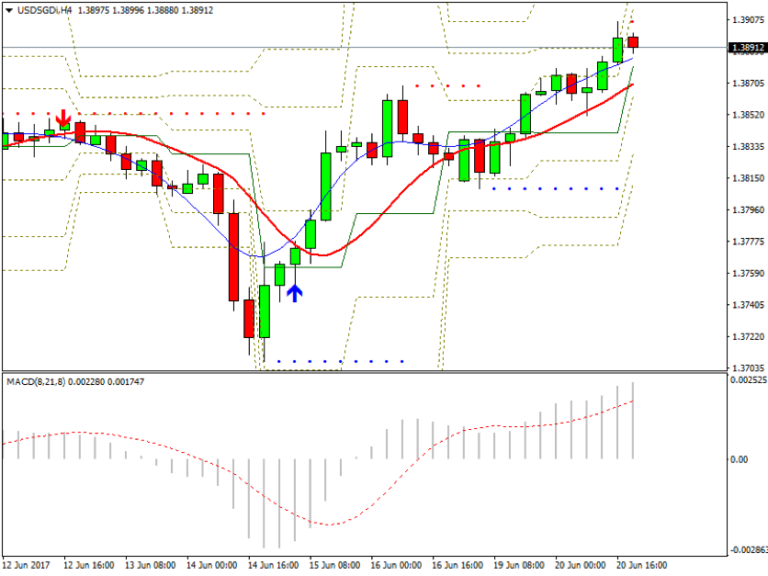
Q.Check any Crypto Coin technical chart and explain what you find/understood from the Chart with screenshots.
Answer:
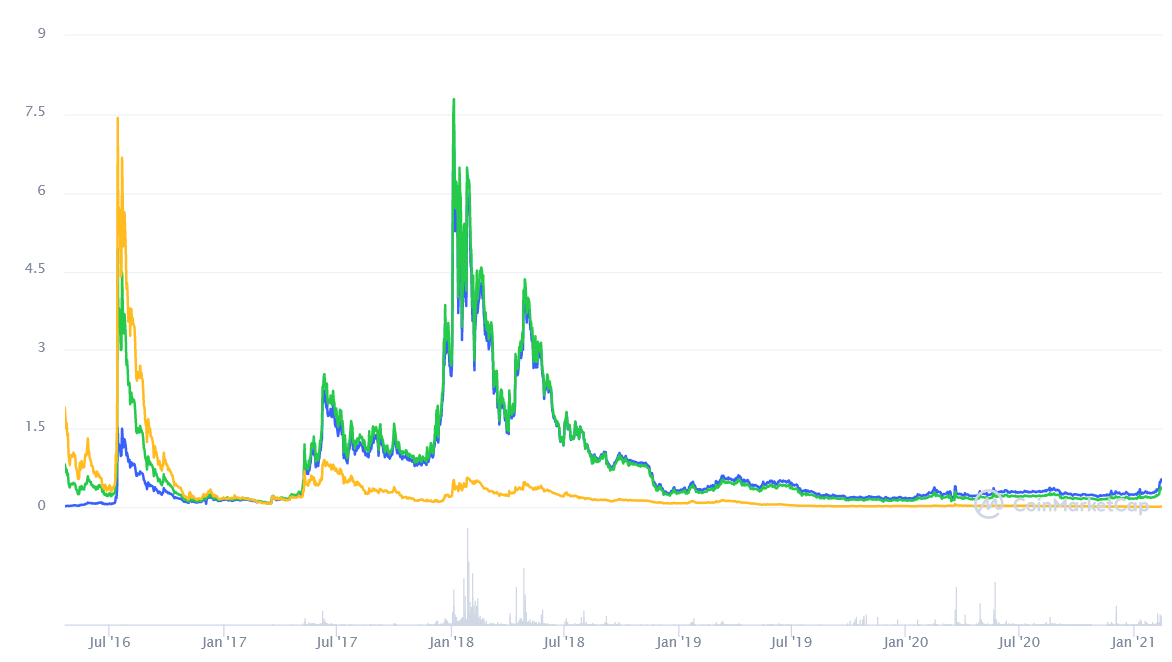
Steem price today is $0.369574 USD with a 24-hour trading volume of $24,982,505 USD. Steem is up 3.90% in the last 24 hours. It has a circulating supply of 378,366,076 STEEM coins. Its all-time high rate is $8.57 and its all-time low is $0.06919. Its pricing is increasing for the last 14-15 days.
Regards:
Cc:
@steemcurator01
@steemcurator02
https://twitter.com/boss7514/status/1360821273807388673
Thank You For Showing Your Intrest to learn Crypto Trading Technical knowledge.
You have completed the homework task and made a good post, explained very nicely about why Technical knowledge is important in Trading and How to read and understand Trading charts?
Remark: Homework Task Completed.
Thank You.
@stream4u
Crypto Professors : Steemit Crypto Academy
#india #affable
Hi,
Thank you for your contribution to the Steem ecosystem.
If you would like to support us, please consider voting for our witness, setting us as a proxy,
joining our Discord server, and delegating to the project by using one of the following links:
500SP | 1000SP | 2000SP | 3000SP | 4000SP | 5000SP | 10000SP | 100000SP