Steemit Crypto Academy Season 4 Week 2 - Beginner's Course | Technical Indicators.
In my own words, Technical indicators are tools that assist a traders do some technical analysis properly to make an effective trading decision. It also produces the traders with signals that can make him profitable. Most of the times, they are pattern based that is produced by the volume of the traders who adhere to technical analysis. They are gotten from series of mathematical computations of previous data of price movements which helps to predict what might happen next in the trading market.
Pure price action in the market is good but if the technical indicators are being added to the pure price action, it makes it more better and increases the confidence of the trader. With technical indicators you have the full control of the market because the indicators are gotten from the previous action of the price, which the market is known for repetition. Most times, traders just uses only technical indicators to carry out a trade and most times it has really being successful

Technical indicators are really good for cryptocurrency analysis, because in cryptocurrency market, every price movement is being repeated and the technical indicators uses the data of the previous price action to predict the future which most of the times it is usually correct. Most time you can use the technical indicator to know the direction of the price and the strength of the trend, which you can not know with just common pure price action
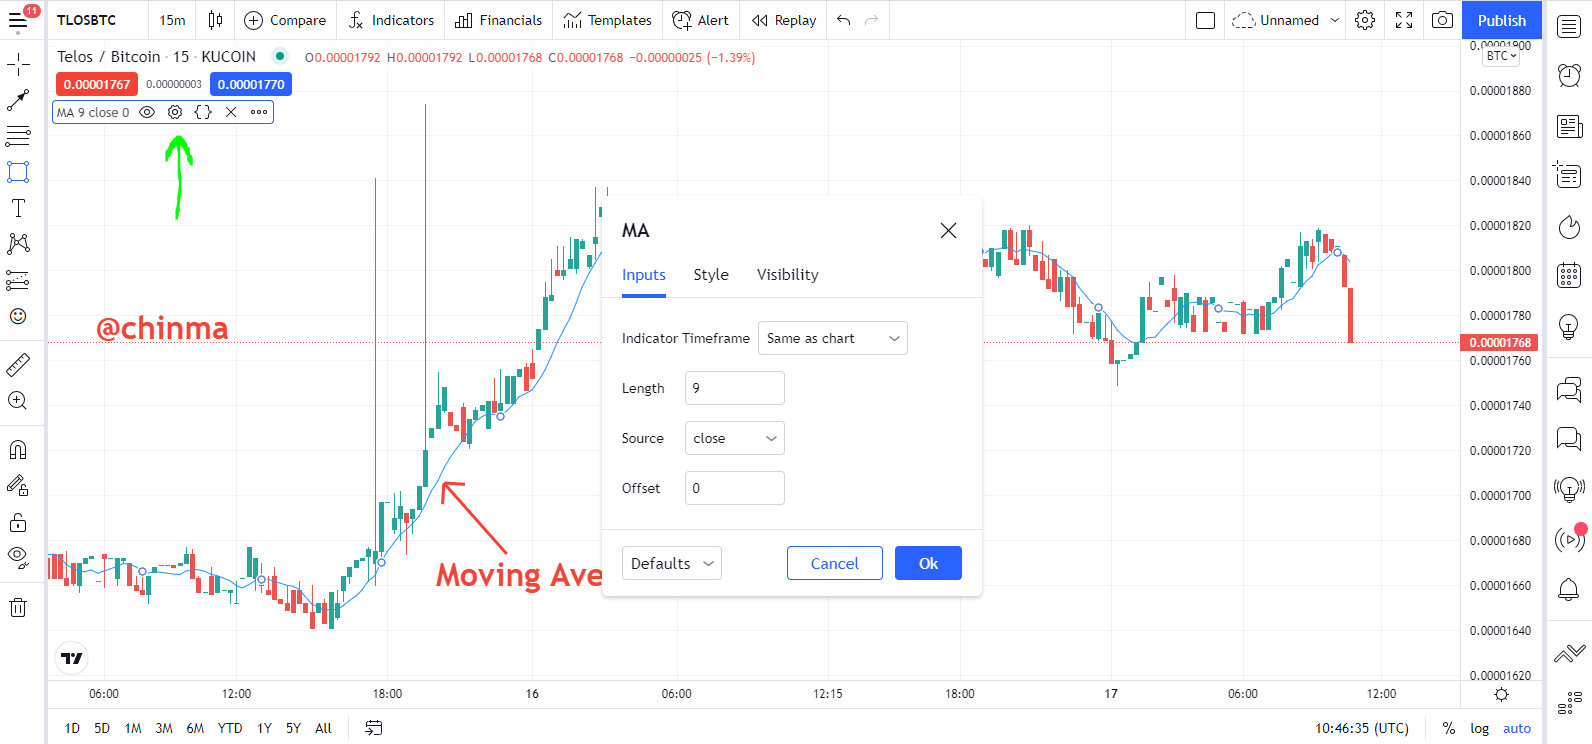
There are many things of technical indicator, which I will explain later, but for I will show you how to add a moving average to the your chart and also how to configure it to suite you properly with the following steps below:
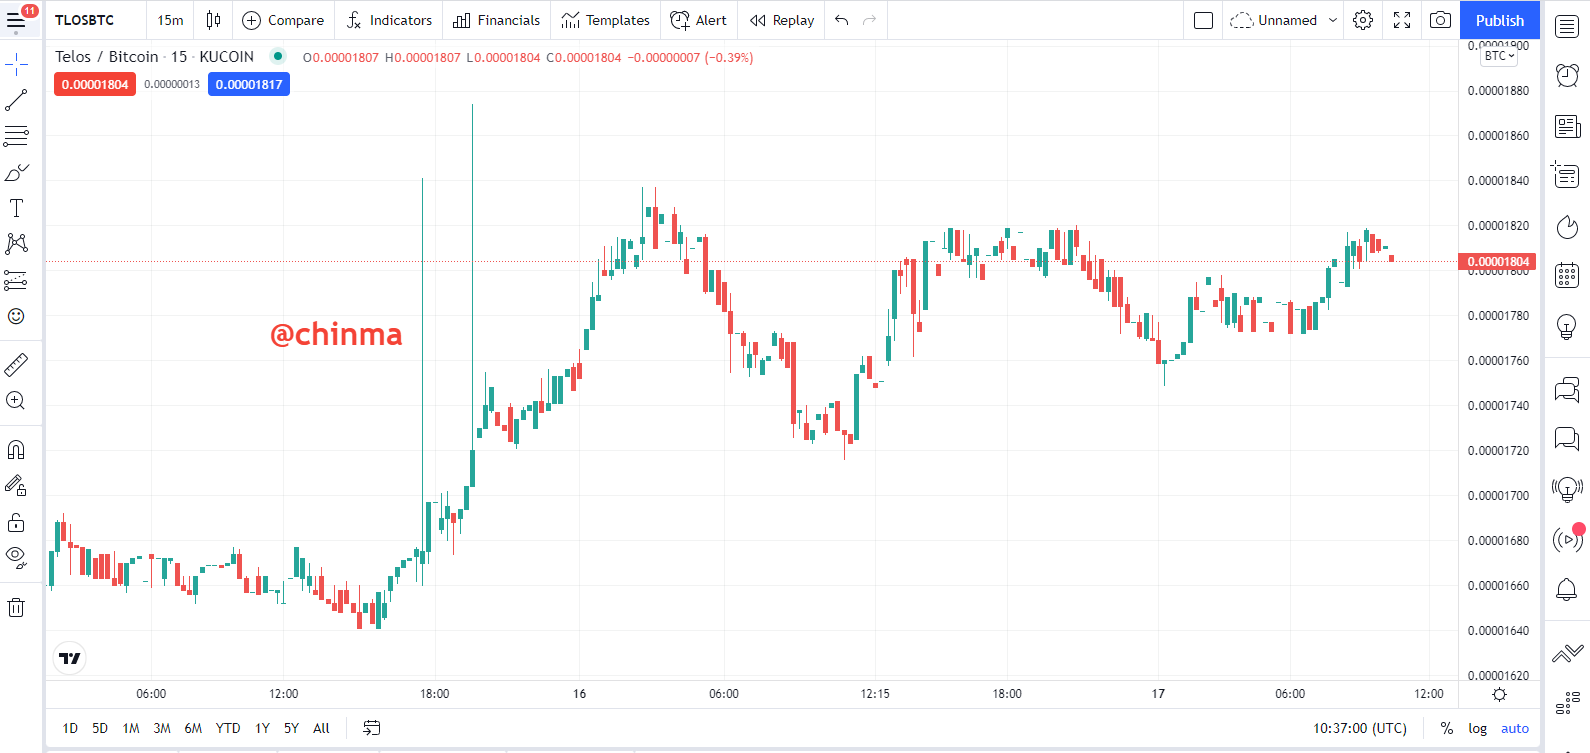
- Open your chart using Trading view or any other platform that you are familiar with.
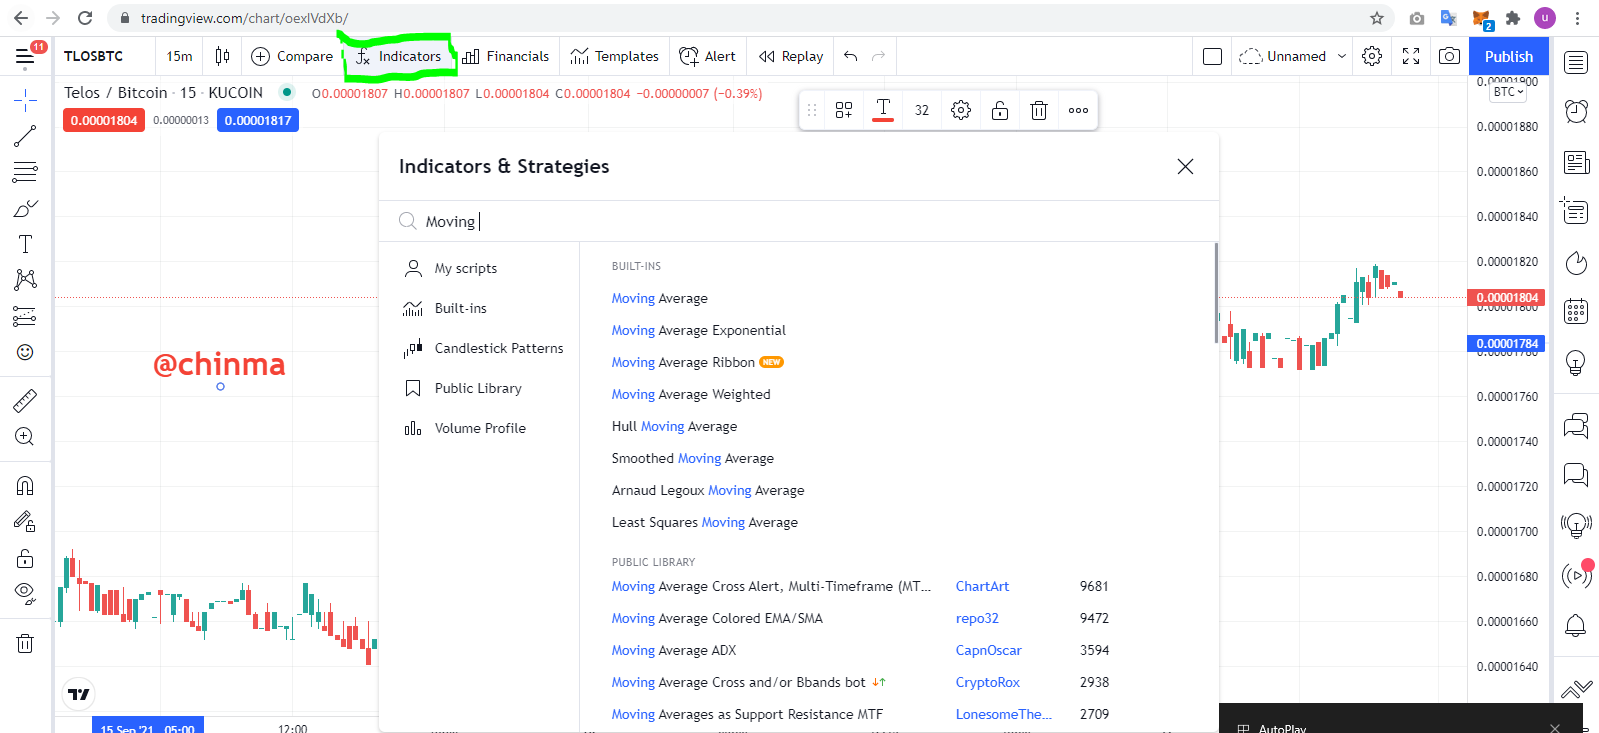
- Select indicator and the type the technical indicator that you want to add. I typed moving average and selected the moving average in the drop down menu
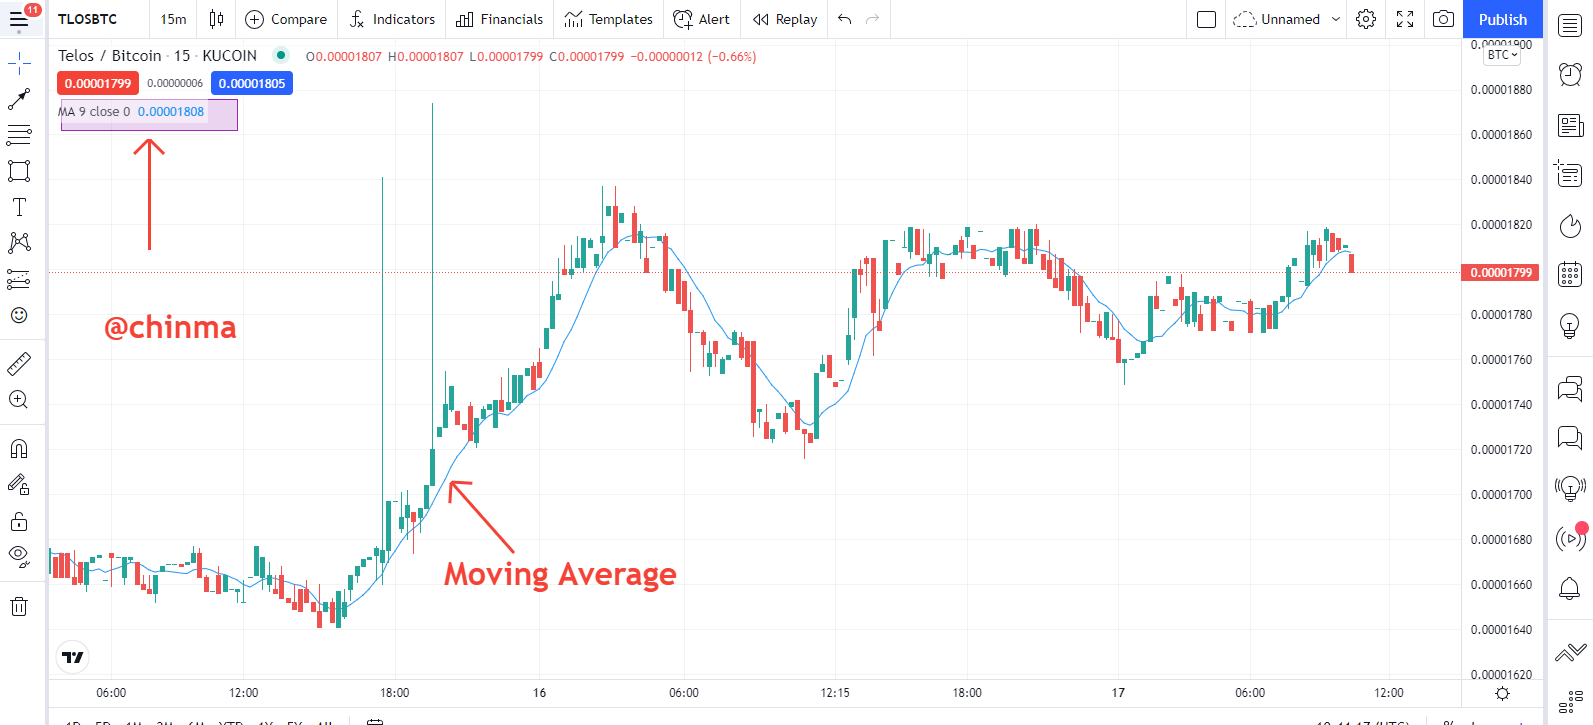
- We can see that the indicator which is moving average have been added.
- To configure it, you can select the gear icon on the top left corner and a new dialogue box will appear. You change the input of the the indicators, there colours with other things depending on your settings of your choice.
This is a chart of TLOSBTC on a 15mins time frame.
Technical indicators are made up of many categories depending on the users choice. The following below are the different categories of the technical indicators.
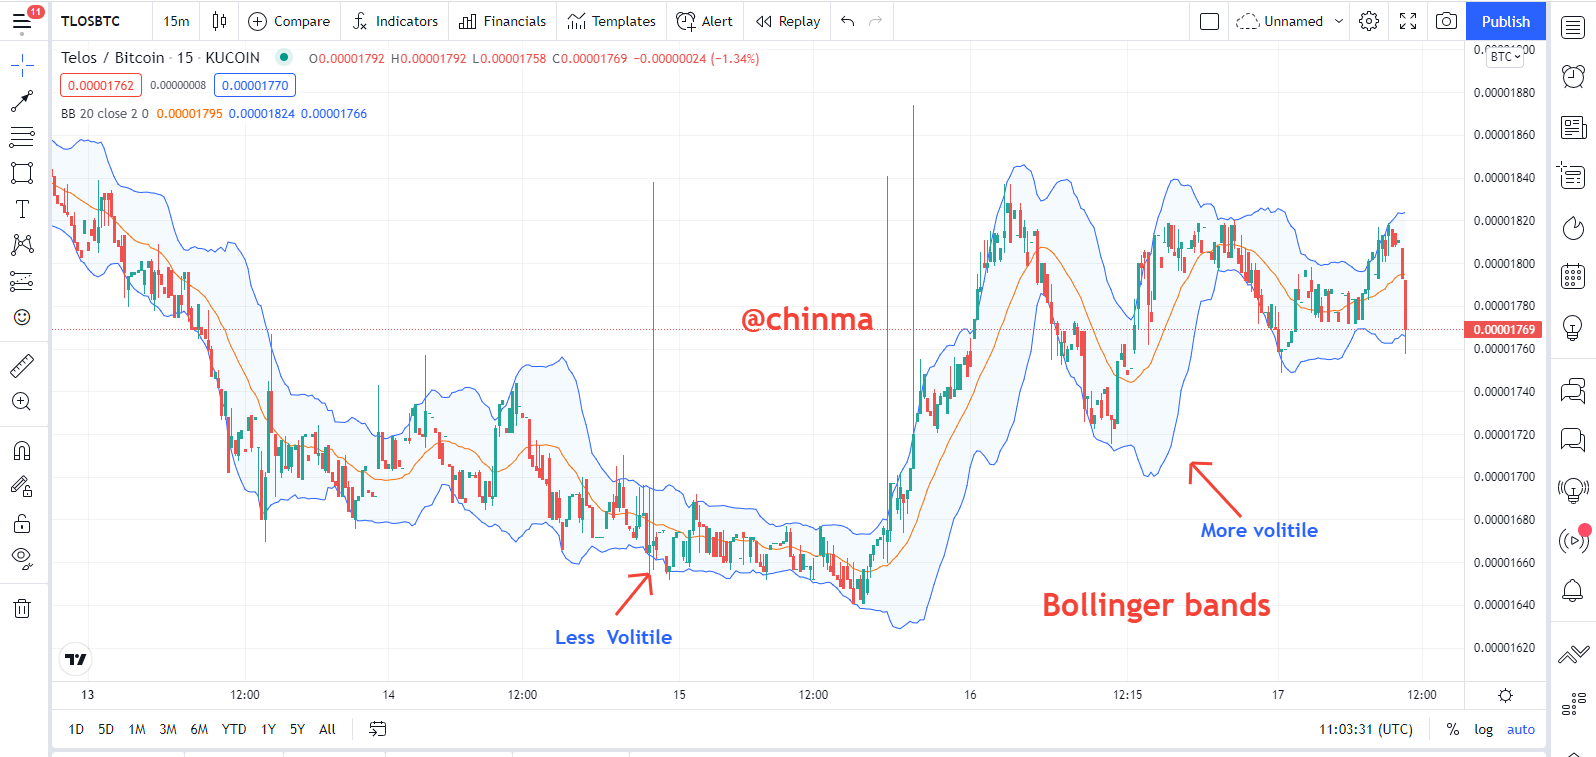
Volatility Based Indicators:
This indicators is used to show the volume of the trade at a particular time period, the in flux of traders will determine the market movement. If there is much traders at that particular time, the candlestick will be longer and if there are smaller traders the candlestick will be smaller which we can also refer to as swing high and swing low.
The technical indicators are use to determine the price fluctuation based on the swing high and the swing lows. Some technical indicators that has such functionality include the
Bollinger bands
Average True Range.
A Example of Bollinger Bands
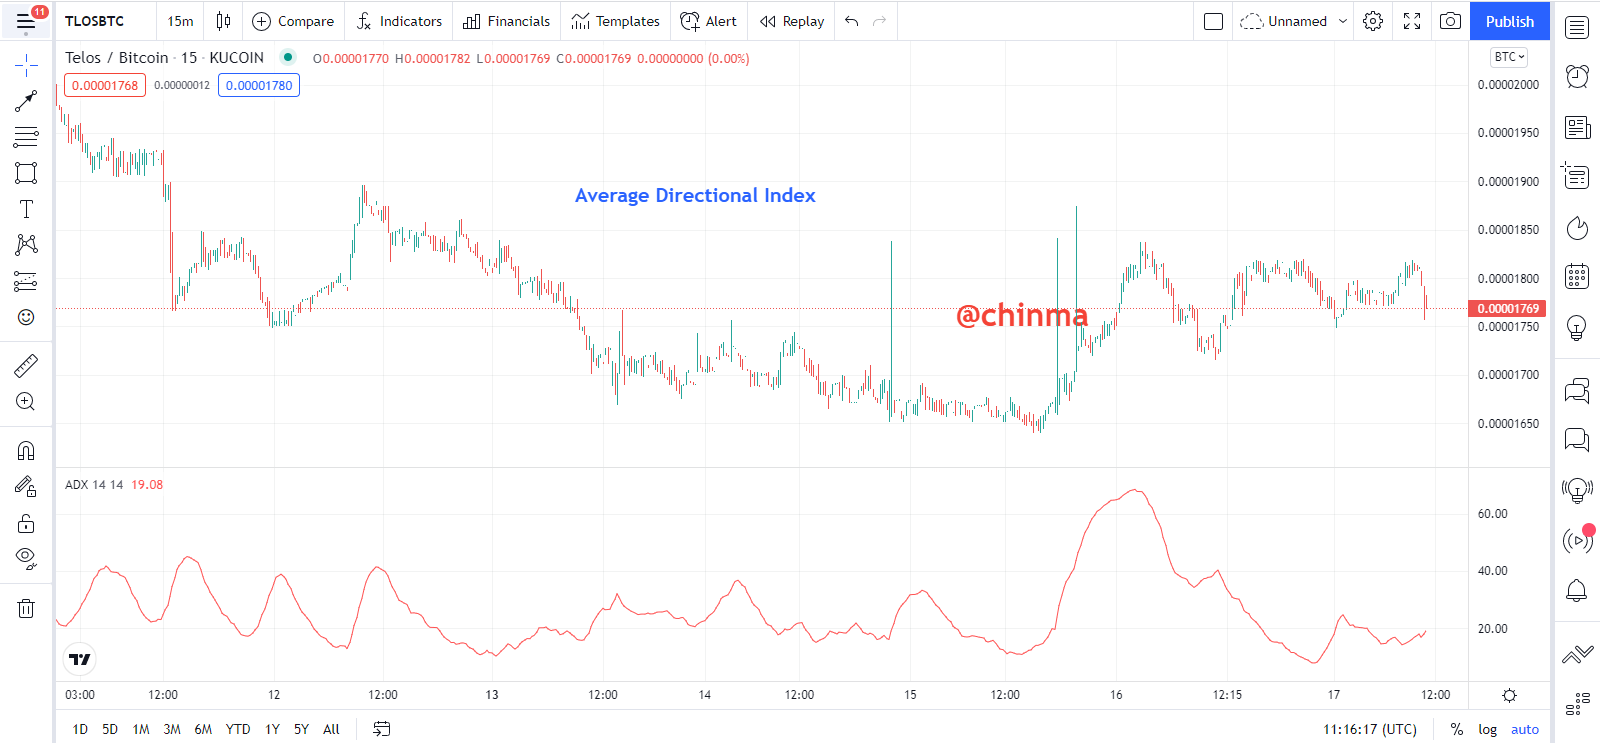
Trend base Indicators
Most traders have made it in the cryptocurrency market by simply obeying the trend and some traders had also lost huge amount by simply walking against the trend. Trend is simply following the direction of the market either upwards or downwards. The trend based helps traders to determine the current trend of the market and duly follow and the indicators also tells the traders when the trend is about to change or reverse. The indicators also tell if the trend is strong and also weak. This is trend based indicators can make you very profitable. Such indicator include
- Average Directional Index
- Ichimoku Kinko Hyo
- Moving Averages
An Example of the Averages Directional Index
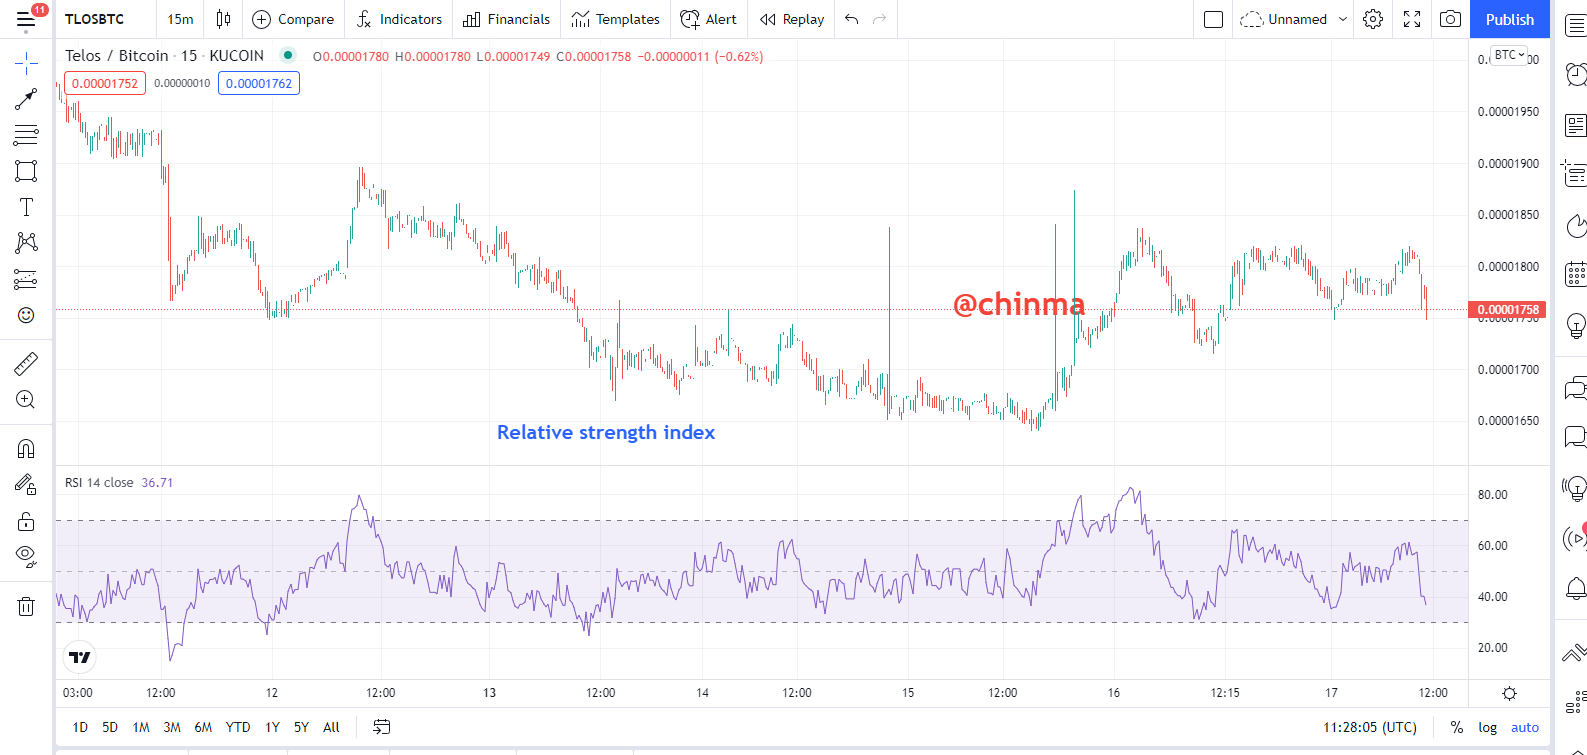
Momentum Based indicators
Momentum which is some how related to distance can also be used by the Technical indicators to determine the distance that a price can travel in the market. It is also known as the Oscillator. Oscillators in the market helps to determine when an assets has been overbought or oversold which can also cause a change in the direction of the price in the market.
You can a huge if you are using this indicator, for instance, the price has been overbought, the technical indicators will inform you in order for you to execute a sell order in the market. Same thing happens when the market has been oversold, then should execute a buy order.
Such indicators includes
- Stochastic
- Moving Average Convergence Divergence (MACD)
- Relative strength index
It is not advisable for trader to use only indicators while doing technical analysis, because it is high importance to know some simple pure price action before applying any other technical indicator. Pure price action like support and resistance, candlesticks, different pattern can also help the indicators to accurately predict the outcome of the market.
Of a truth, the technical indicators are of very importance if you really want to make it big in the market with the following reasons
- It helps the investors to predict the future of the price, in doing these, you are in full control of the market. You can make it big if you can predict the price future in the market, you will become very profitable.
- Technical analysis can not be completed with the technical indicators which helps to confirm the that the technical analysis are very correct. And your price action will be very correct using the technical indicators.
- The technical indicators also helps us to make a very good entry point and exit point in the market. Thereby providing us with alert in the market. Telling us when the trend is strong or when it is weak for us to leave the market. So using the technical indicator can make us very profitable
- Using technical indicators also helps us to have good trading management while trading. Helping you know where to place your stop loss and take profit . this is a very good way to be a very profitable investor
In conclusion the technical indicators are there to helps make the most out of the market, using it effectively will enhance our trading skills and make us more successful traders
Cc: @reminiscence01
Hello @chinma, I’m glad you participated in the 2nd week Season 4 of the Beginner’s class at the Steemit Crypto Academy. Your grades in this task are as follows:
Observations:
I am not sure you understood the question in 2c
Recommendation / Feedback:
Thank you for completing your homework task.