Crypto Academy| Season 4 - Week 2 | Homework Post for [@kouba01] : Crypto Trading With Volume Indicator

Hello there,
We are all aware of the importance of technical indicators at this moment. It's all because to the Crypto Academy Courses. Some of us have already applied them in our day-to-day cryptocurrency trading. In today's task, I'll try to address all of the following questions on Crypto Trading using Volume Indicator.

I. Explain the volume indicator in your own words.
Volume is important for every factor, as it indicates the amount. In the same way, it is very important in crypto trading with the help of the volume indicator. Because all other indicators were established after combining price and volume, price and volume played the most essential role in chart interpretation.
When we use volume indicators to trade, we can see the market trend more clearly. It is possible to see the market trend by examining the volume of any asset at a specific moment.
The volume also looks at price movement to see if it will continue in the same direction or reverse. As a result, Volume offers traders early warning signs about the market's direction.
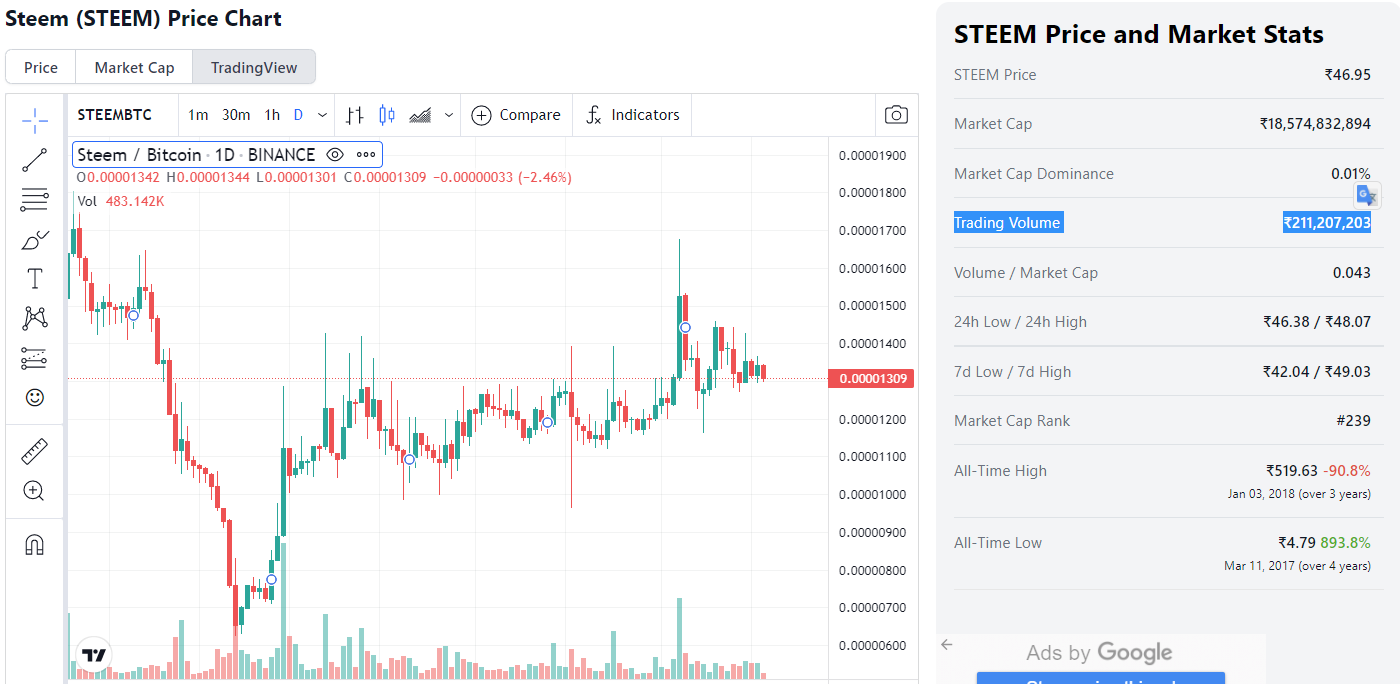 ~Example of Volume, the total traded volume of Steem in last 24 hours~
Volume, in this context, refers to the quantity of any cryptocurrency traded at any given moment which includes buy & sell.
II. Use a platform other than Tradingview to present the volume indicator on a chart and show how to configure its parameters by justifying your choices. (Screenshot required)
To answer this question, I am using my wazirx trading account.
Logged in to my wazirx trading account and selected a crypto asset like below:
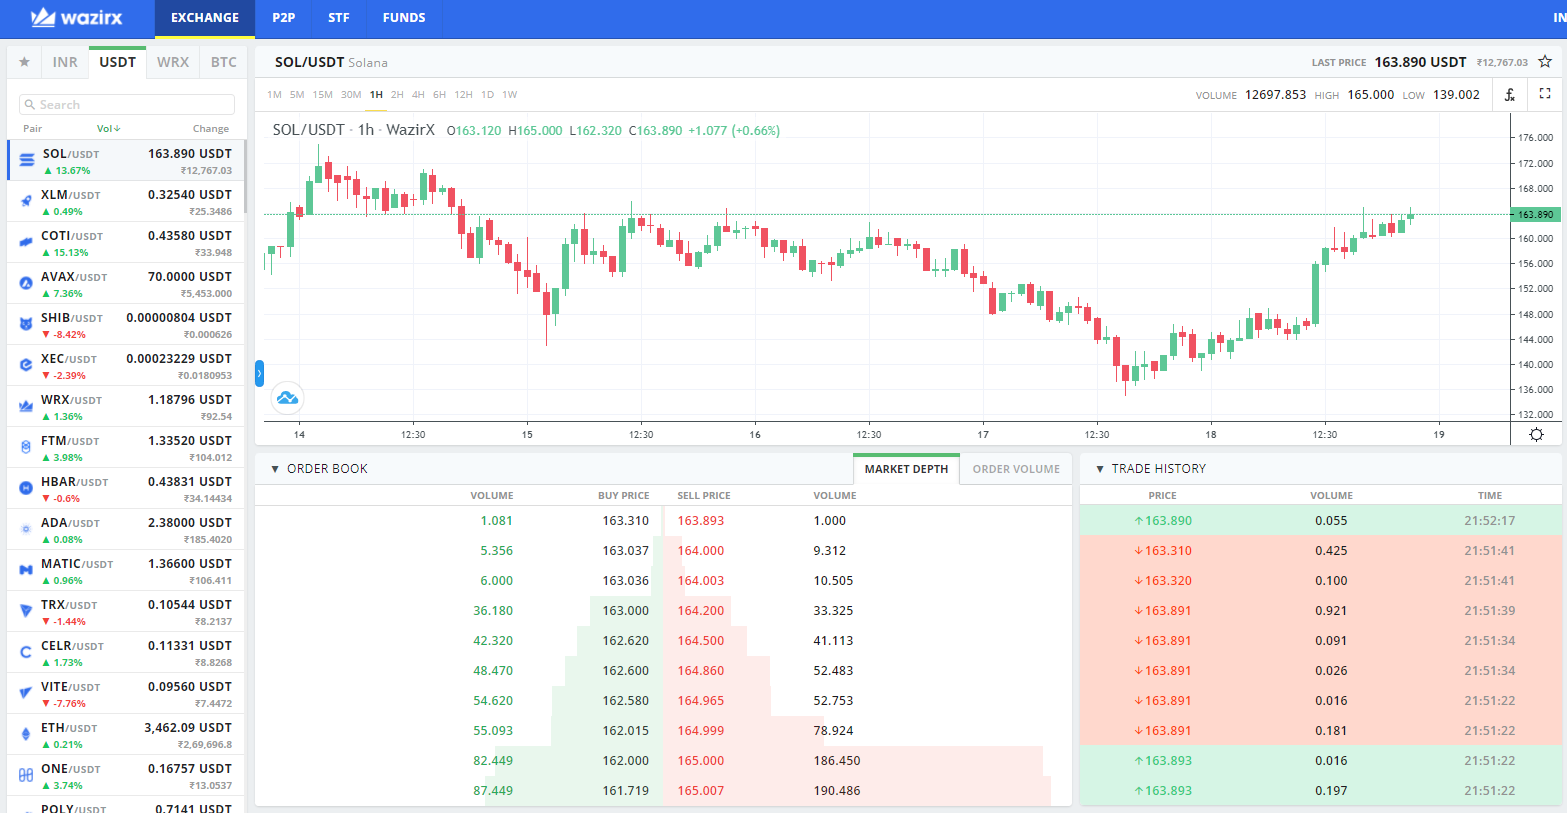 ~Screen capture from my wazirx trading account~
 Once we select any asset, a chat will appear for that particular selected asset like on the above screen capture.
In the wazirx chart, there is a function icon at the top right corner of the chat, after clicking the function icon, we will get the list of indicators available to apply on the chart.
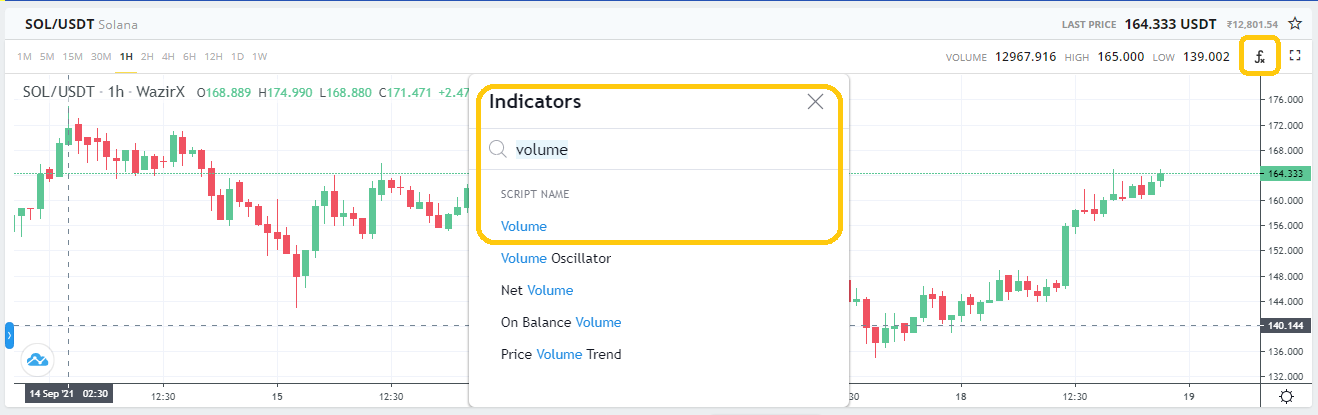 ~Screen capture from my wazirx trading account~
 - Just search for the volume and we will get many related indicators, select the "volume" indicator and it will get applied to the chart with default settings.
- After applying the volume indicator, we can edit the settings by clicking on the setting icon.
- After clicking on the setting icon, we will get a popup, under which, 1st section will give us an option to change the MA Length and the 2nd section will give us an option to change colors and graphic stuff.
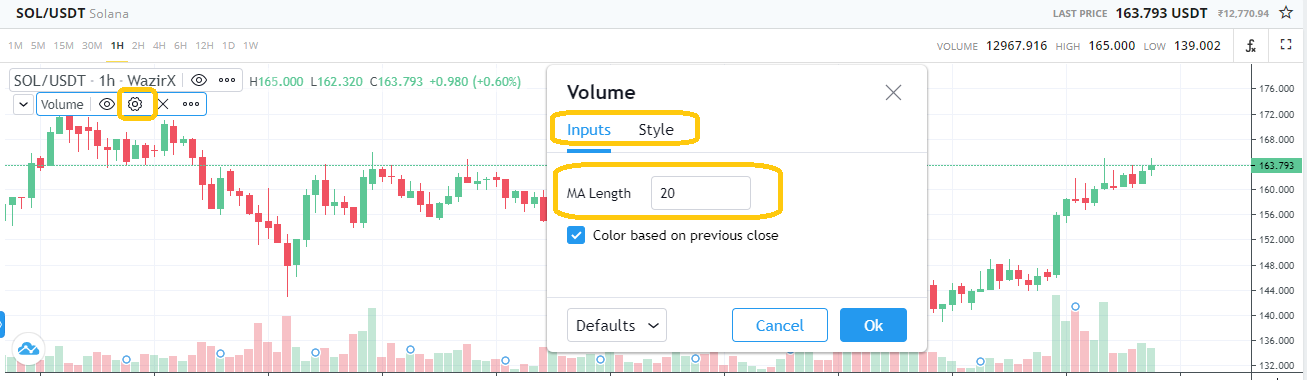 ~Screen capture from my wazirx trading account~
 - After performing all these steps, our chart will have a volume indicator with our own settings.
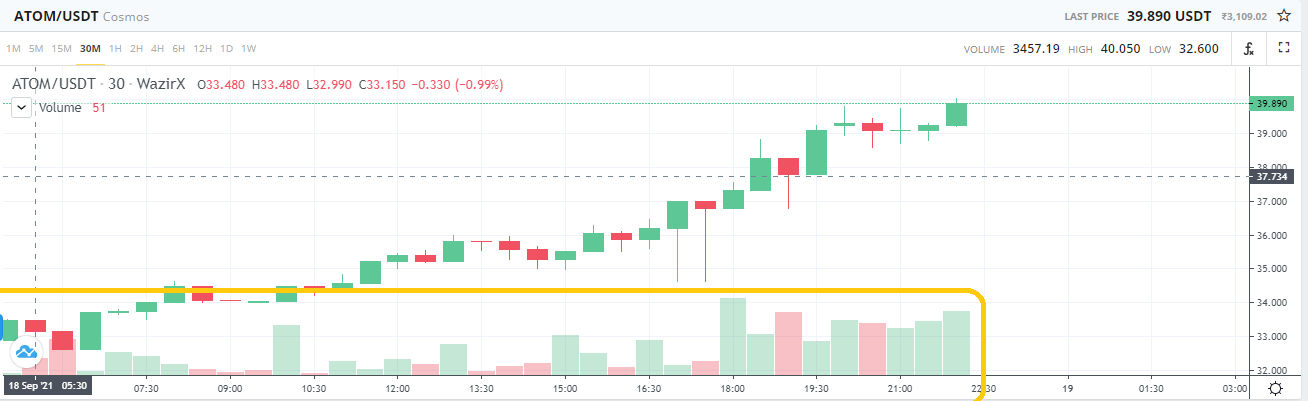 ~Screen capture from my wazirx trading account~
 - As we can see on the above screen capture, it will show us the volume of trades in each selected time frame, in my case, it was 30 minutes.
III. What is the link between Volume and Trend and How to use volume to predict a trend reversal? (Screenshot required).
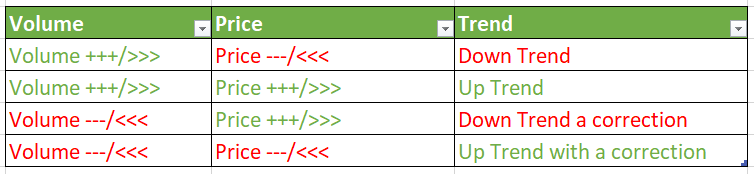
The falling prices and low volume is also seen as an uptrend. wherein sellers are still active and it is a bearish sign as it is the time of correction.
The increasing prices with low trading volume indicate a downtrend. This is the sign that its trend is about the end with a high and then it will start falling. The low volume represents that change the trading behavior of the traders.
If a price is falling with a high volume of trades, it could be a sign of a present trend continuation. If the price is fluctuating with a low volume of trades, this could be a clear sign of trend change, it could be up or down.
With this volume information, we can predict the trend reversal. While trading with the volume indicators, we will have to look for the buyers at the bottom and sellers at the top. In this case, the previous candle is very important.
Then the price is falling with low volume, it is a possible sign of trend reversal which means a sign of an uptrend. At this point, we will have to wait until the trading volume gets high on the buyer's side. Once the volume is increased, will check the next volume candle, if the next volume candle is on the buyer's side, then it is clear that it is a trend reversal and the next move will be bullish.
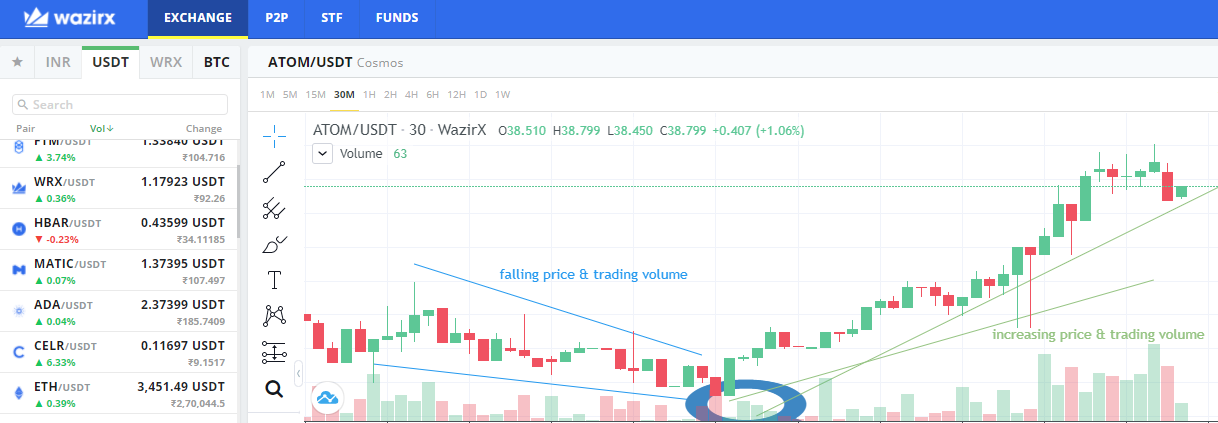 ~Example of Trend Reversal Pattern with Volume Indicator~
 On the above screen capture, we can see that both price and trading volume were falling, which is a possible sign of trend reversal. At the bottom, we can see there was a sudden increase in trading volume and price after a big fall. Then we can clearly see that the whole downtrend is now reversed and an uptrend is started and going up.
IV. How to use the volume to have a signal confirmation? (Screenshot required).
To use the volume as a signal confirmation, we can check the support & resistance levels. If the price has crossed the resistance level with a high volume, then it is confirmation of a bullish trend.
If a price has crossed the support level with a high volume of trade, then it is a sign of a downtrend.
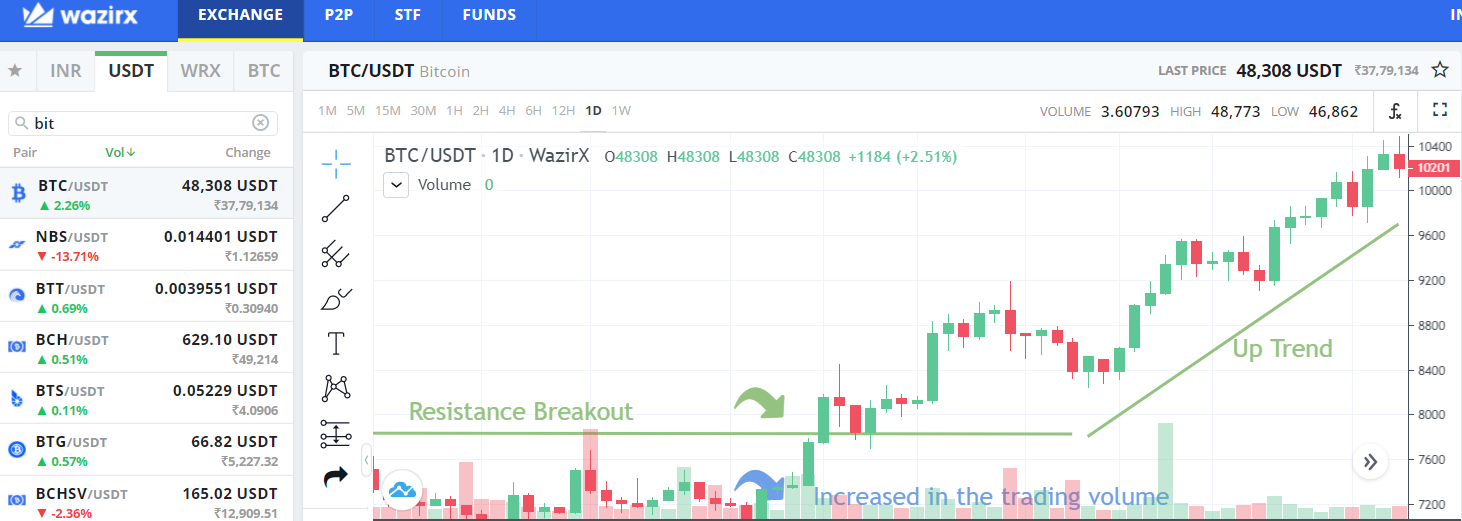 ~Example of Volume Confirmation~
 On the above screen capture, we can clearly see the resistance level, and then there a high volume of buy trades then the resistance level was broke. The candle was closed above the resistance level, which was a clear sign of uptrend and that happened here.
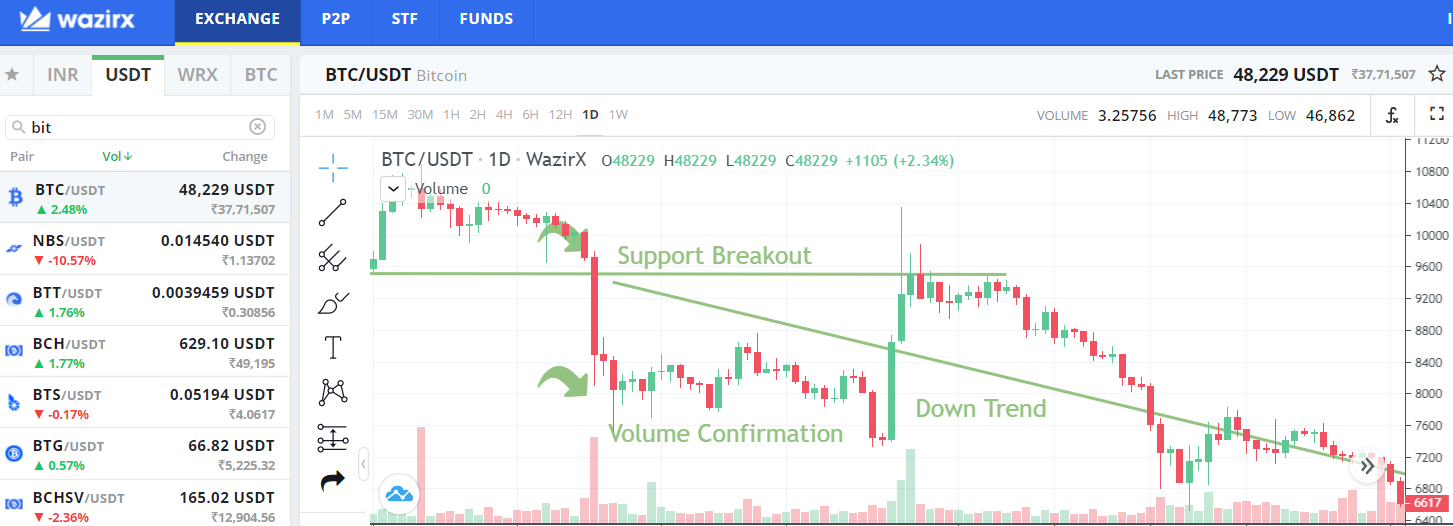 ~Example of Volume Confirmation~
 On the above screen capture, we can clearly see the support and there was a huge volume on the seller side, after the same candle the trend went down. The candle was closed below the support level which was a clear sign of a downtrend and that happened here.
V. How does the volume reflect the evolution of prices in the charts and why does the volume sometimes anticipate the price? (Screenshot required).
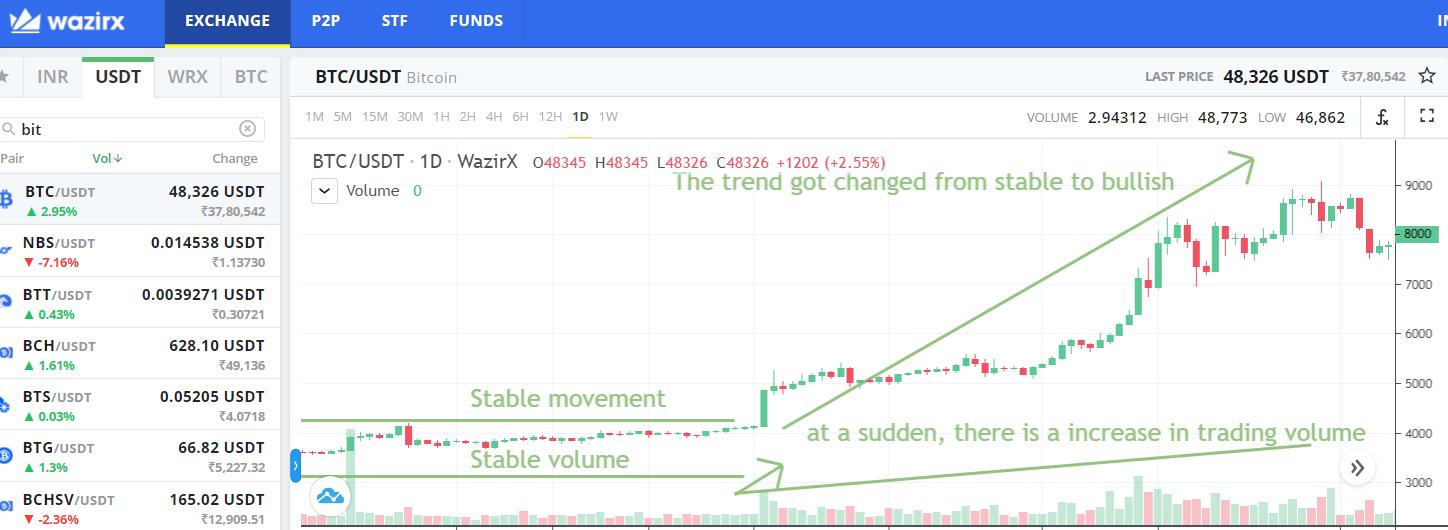 ~Example of Price Movement with Volume Indicator~
 As we can see on the above screen capture, the price was quite stable from the last few days along with the trading volume. All of a sudden, a huge green candle appears with huge trading volume on the buyer side, which changed the marker direction and resulted in an uptrend.
This isn't always the case; occasionally, despite a large number of trades, the price doesn't shift significantly. This is a common response when the market is entrapping traders.
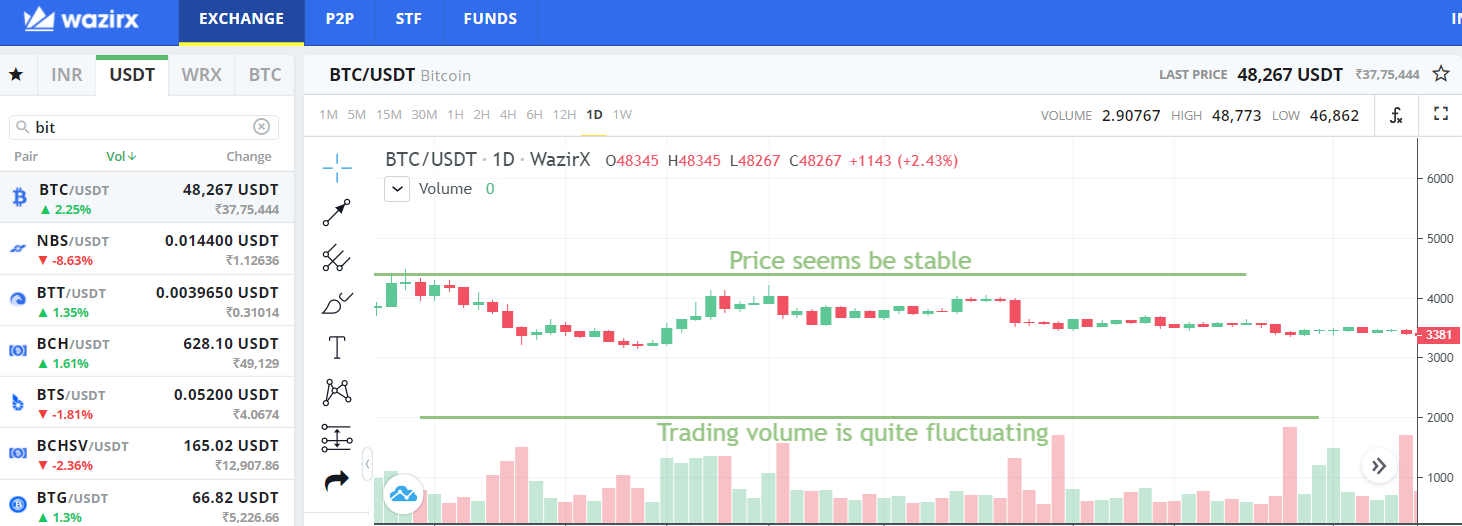 ~Example: Volume anticipate the price~
 Here, it can be seen the fluctuating high volume of trades, still, there were no significant changes in the price movement. In this case, the price is quite stable wherein the trading volume is not.
VI. Is it better to use the volume indicator alone or use it in parallel with another indicator when trading? Justify your answer.
As we all have backup plans, it's always better to apply a few different indicators when trading, but don't use too many or you'll get distracted. We can't rely on just one candle, thus I like to utilize 3-4 different indications on my charts instead.
With the help of these indicators, we can understand the market movement and make better trade decisions. No indicators are 100 % accurate, combining these indicators can give more accurate information and reduce the risk of huge losses.
If we have applied 3-4 indicators and they all are pointing towards the uptrend, then we can go for the buy trade. If they are pointing down, then we can exit the trade or place a sell trade.
But at some point, we all may have seen one indicator shows uptrend and another down, this creates confusion, which one to trust. It is always good to ignore these situations waits for all indicators to point in the same direction.
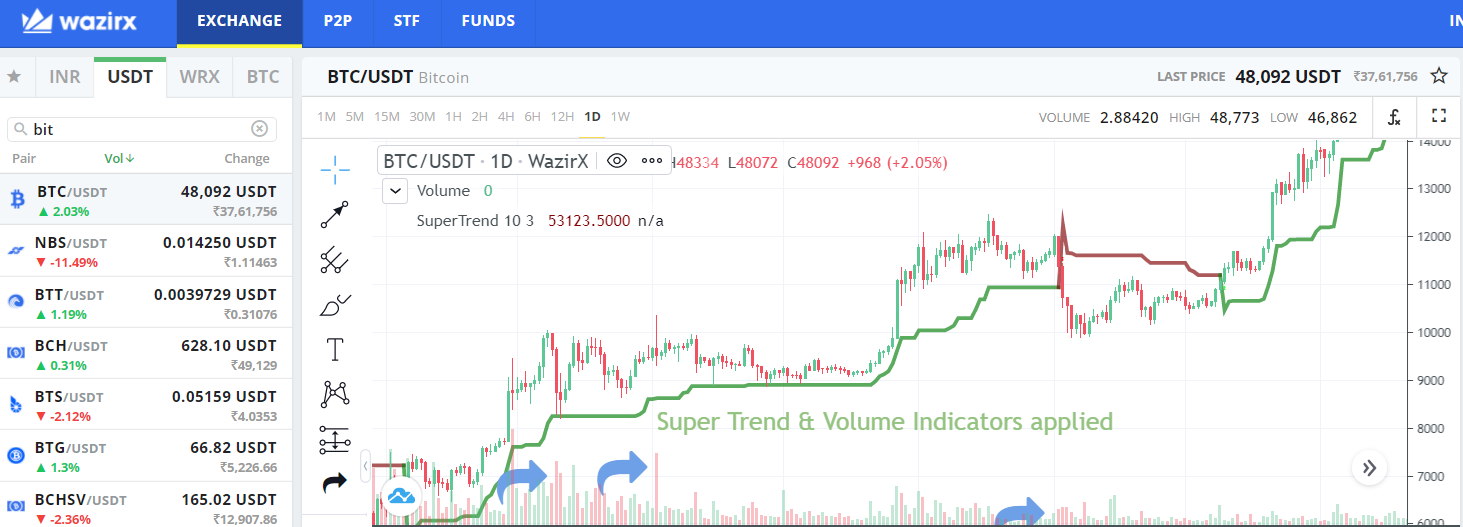 ~Example: Super Trend & Volume Indicators~
 On the above screen capture, a super trend and volume indicator is applied. We can see that there were times when there was a huge trading volume of sell with a red candle, but the market trend is up.
Every indicator works differently than others, the support & resistance levels followed by one indicator might not be the same for others. On the above screen capture, we can see the support level of super trend, multiple points where the trading volume of the seller was huge, but as per the super trend, the buyers have dominated the point and pushed the price up. So it will be our call to go with one single indicator in this situation or wait for the next move on which both will indicate the same.
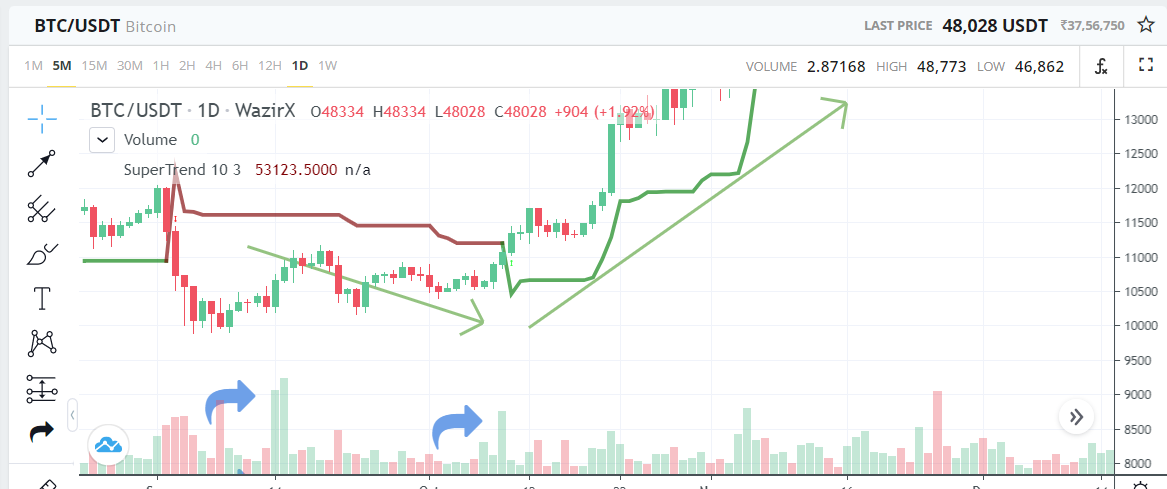 ~Example: Super Trend & Volume Indicators~
 In this screen capture, we can see multiple points wherein is the volume of buyers still price was going down which was also below the resistance level of super trend, the brown line, it is because of the resistance level of super trend the trend was down. Then at a time, the volume was little improved and the price was already above the support level of super trend and then the trend got changed to an uptrend.
Even with the 2 indicators, there are times, when they both works differently, but it is our call to wait and take the right decisions when most of the indicators are in the same direction and giving the same call.
VII. The volume indicators are multiple, choose one of them to briefly explain its usefulness in crypto trading.
Meaning:
The Price Volume Trend Indicator is a technical indicator that helps us in determining the price of an asset and the volume of trade taking place. It helps us in determining the current supply and demand for the asset. Also, it's useful for a price forecast. The volume line alters an asset's trend and present volume by adding or subtracting a percentage based on the asset's upward or downward trend.
PVT, I feel it is one of the best and easy-to-use indicators available on the market. It has multiple as mentioned, it is useful to identify the supply & demand also for the price prediction.
Use/Working:
- When price & volume are increasing, the PVT confirms that the trend will be up & bullish.
- When a price is falling with low trading volume, then it is a sign of a coming downtrend.
- When at a point, price is increasing but the trading volume is low and decreasing, then it could be a trend reversal sign as the downtrend is fading.
- There are times when the price is falling but with a huge or increasing trading volume then it could be a sign of a reversal trend as the uptrend is fading.
Chart Study:
It is a very easy-to-use tool with many features. As per the definition, it automatically does the calculations and gives us the proper information of demand & supply, and helps us to predicate the price action.
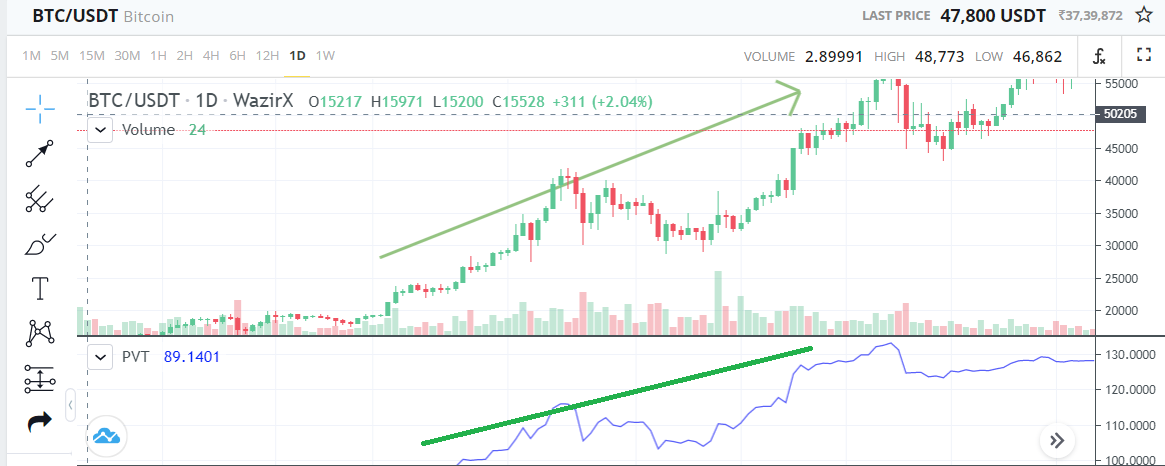 ~Example: Price Volume Trend(PVT) Indicator~
 As we can see, it is very easy to notice that the volume is increasing and so is the price of the asset. The asset is in an uptrend with increasing trading volume.
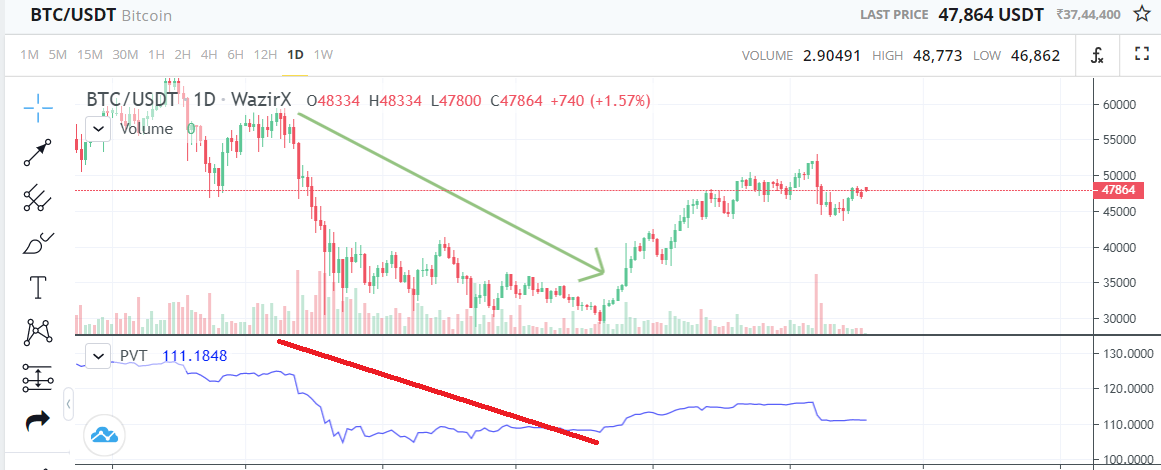 ~Example: Price Volume Trend(PVT) Indicator~
 In the above screen capture, it can be easily seen that the trading volume is falling so that the asset price. So it is provided that according to the demand, the trend of the asset is changed to downtrend as the trading volume was deceased.
#kouba-s4week2
#cryptoacademy
#india
#nepal
cc: @kouba01
20 % Beneficiaries rewards set for @steemingdiaries!
Thank you!
@ghostfacer99
Thank you!
Hello @ghostfacer99,
Thank you for participating in the 2nd Week Crypto Course in its 4th season and for your efforts to complete the suggested tasks, you deserve a Total|7.5/10 rating, according to the following scale:
My review :
A good article in which you were able to answer most of the questions ably, and you have some notes that I made.
Thanks again for your effort, and we look forward to reading your next work.
Sincerely,@kouba01
Thank you for your feedback, I really appreciate and I will continue to work to improve my work.
#affable
You have been upvoted by @sapwood, a Country Representative from INDIA. We are voting with the Steemit Community Curator @steemcurator07 account to support the newcomers coming into Steemit.
Engagement is essential to foster a sense of community. Therefore we would request our members to visit each other's posts and make insightful comments.
Thank you
Thank you for your support!
@ghostfacer99
Appreciating for your best work sir.
I have published a post in Steemit Nursery. Tomorrow, my post will be expired.
Kindly check my post as soon as possible
Cheers .
@aaliarubab,
Thank you for your comment!
You are already part of our Steemit Nursery Family. You are welcome to post anything here. If you are referring to 500 SP Support program support, they work round the clock and they have their schedule and I am sure, you get the support in time.
Have a pleasant stay in Steemit Nursery Community, Thank you! 💐
Best regards,
Steemit Nursery Team
#affable
Thanks Sir @ghostfacer
I hope this community will support me .
@aaliarubab,
Please note that Steemit is blockchain-based blogging and social networking site that rewards users in STEEM cryptocurrency for posting and curating material. Do participate by making posts, commenting, and voting on others' posts.
I can see that, you have only made 6 votes from your account so far. To receive the support, you will have to give to the other, please do vote (minium 5 votes per day) and comment on other users' posts.
Have a pleasant stay in Steemit Nursery Community, Thank you! 💐
Best regards,
Steemit Nursery Team
#affable
Ok sir @ghostfacer
I'll do vote and also comments.
Hope so you will encourage me.
Thanks
Flagged due to disagreement with rewards