[Trading with Contractile Diagonals] - Crypto Academy / S4W3- Homework Post for @allbert
Good day beautiful Steemians, I am @hadassah26, welcome to my stem crypto academy season 4 week 3 homework for professor @allbert on Trading with Contractile Diagonals.
.png)

"1. Define in your own words what a contractile diagonal is (screenshot required / Bitcoin not allowed)."
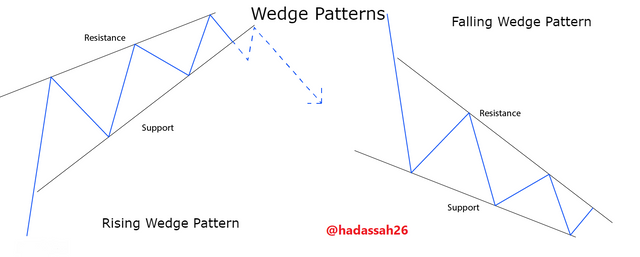
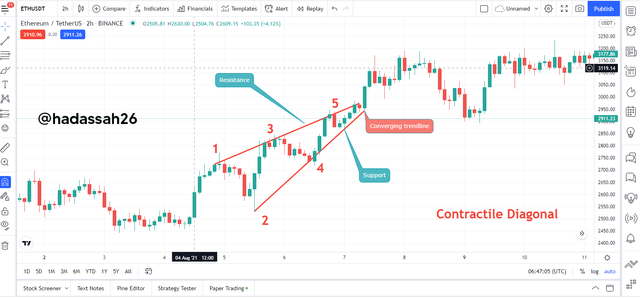
A contractile diagonal or simply wedge pattern is a price action where price candlesticks give a converging structure with a 1-2-3-4-5 wave pattern in the direction of the current trend of price.
The Contractile diagonal can be identified by drawing two converging diagonal lines on the price, one on top signifying a resistance line and the other a support line on the converging market structure.
In the wave pattern of the contractile diagonal, 1-3-5 are mostly the impulsive move of price based on the trend, while 2 and 4 are normally retracement or price correction.
Contractile diagonals are of two types, which are the bullish Contractile diagonal(Rising Wedges) which is formed as a result of the weakening of a bullish trend of the market, and a bearish contractile diagonal(Falling wedges) which is formed as the result of the weakening of a bearish trend of the market. An example of the contractile diagonal can be seen below.
On contractile diagonal structures, there is seen to be reducing the volatility of price candlesticks, this with the wedge-like structure in the direction of the trend goes with some other signals on any indicator used along with on the chart. An example is a "Divergence" formed on Oscillating indicators during these contractile diagonals, and a "reduction in Volume" tells us that the current trend power is reducing and the opposite trend is about to gain power on the market.
"1b. Why it is important to study it"
- "The trend is your friend" is a general crypto/forex trading phrase, but sometimes we need to try to predict what happens after the end of a trend. The contractile diagonal helps traders to predict what might happen at the end of a trend.
- Catching breakouts: The Contractile diagonal trading technique allows traders to be able to catch big moves in the market called "Breakouts". Market breakouts which usually go some good pips can be very profitable and a little hard to come by, so getting to predict one with the Contractile diagonal can be very profitable for a trader.
- General Profitability: With proper use of the contractile diagonal, traders can secure profits from trend reversals, this is the main aim of gaining knowledge on any strategy
"1c. Explain what happens in the market for this chart pattern to occur"
The contractile diagonal is caused by some market situations in both its bullish and bearish directions, these I shall be treated in the two categories below:
Bullish Contractile Diagonal(Bullish Wedge)
During the Bullish wedge, the market has been in a bullish run and is now overbought, it soon starts seeing some weakness, as it retraces a little downwards. Bulls still try to push the market upwards, breaking the immediate resistance, causing the market to move to the “1” Position.
The bears are beginning to gain the power of the market as they retrace the market back down to the “2” position. This back and forth continues “2” to“3”, “3” to “4”, and then “4” to “5”. The bulls are seeing weaker strengths as they still try to push the market upwards.
The bears gain the market and there is a breakout. The Price slumps down huge pips and traders become fully bearish.
Bearish Contractile Diagonal(Bearish Wedge)
Opposite of the bullish wedge, here the bears have had good control of the market as price soon starts the see some oversold positions.
The bearish trend starts seeing some weakness as bulls start getting in. Market retraces a little upwards testing the immediate resistance. The bears push is back downwards, causing the wave “1”, bulls coming in now push it back upwards to “2”. The back and forth continue up to “5” and then a strong bullish trend is started. More bullish traders join the trend as can be confirmed from the volume.
"2 Give an example of a Contractile Diagonal that meets the criteria of operability and an example of a Contractile Diagonal that does NOT meet the criteria. (screenshot required / Bitcoin not allowed)."
Identifying the Contractile Diagonal must involve crosschecking some laid down constraints, these are to enable the trader to properly certify it is a Contractile diagonal and make profitable trades.
These laid down constraints are:
- The resistance and support diagonal lines should be converging
- The first wave must be greater than the third wave,
- The third wave must be greater than the fifth wave,
- The second wave must be greater than the fourth wave,
- The resistance diagonal should approximately touch the tops of the first, third and fifth waves.
- The support diagonal should approximately touch the tops of the second and fourth waves.
N/B:
Although the market structure may be similar, it must not be the same, so the point where the diagonals touch the tip of the 1-2-3-4-5 waves of the contractile diagonal must not be perfect, the market may fluctuate a little higher or lower, but the structure should mean the same thing.
First Example
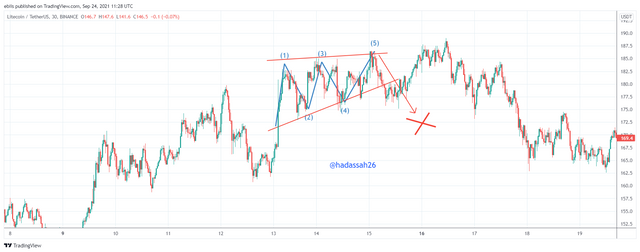
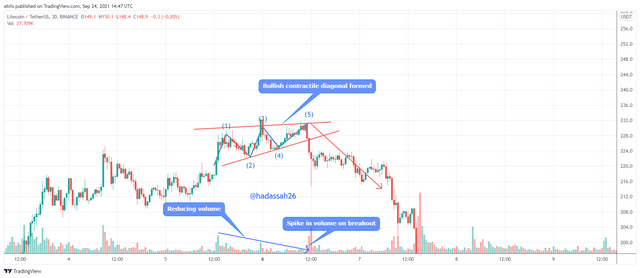
From the above chart, we can see that the contractile diagonal is distorted on the third wave as it has two waves which make it want to seem like the fifth wave already. The bullish market is still strong and at the end of the fifth wave, the breakout is not fulfilled as the market quickly retraces to find higher levels.
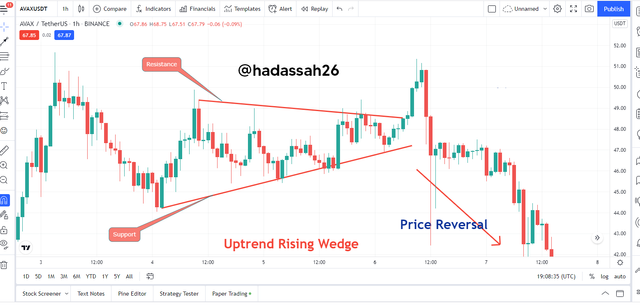
Second Example
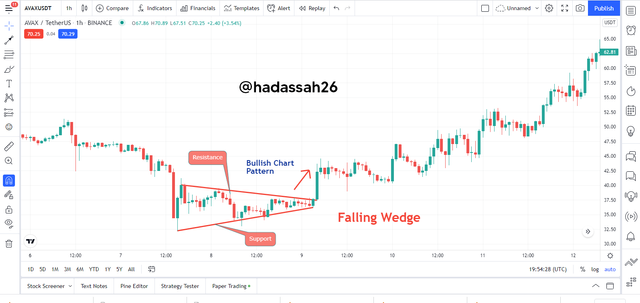
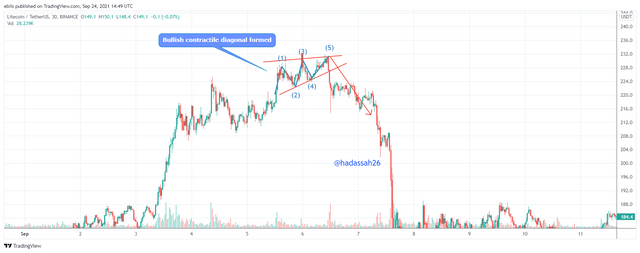
From the chart above, we can see it fully fulfills the requirements for a bearish contractile diagonal formation. the price contracts as the tries to see a more bearish run, but is stopped and it starts a new bullish run with the bullish engulfing candle. This then continues as a bullish trend.
”3. Through your Verified exchange account, perform one REAL buy operation (15 USD minimum), through the Contractile Diagonal method. Explain the process and demonstrate the results and graphical analysis through screenshots. Your purchase data must match your analysis data: such as cryptocurrency and entry price.”
On the contractile diagonal satisfying the above-mentioned constraints in question 2, we can now wait for a breakout before entry.
Entry
For Entry positions, we should make sure that the breakout is confirmed either with a good engulfing candle on the new trend or a strong move towards the new trend, we can also wait for some retest to me more cautions before entering the market.
Using my verified account on Binance as shown below,
.png)
I search for an incumbent contractile diagonal. Looking at the ACM/USDT on the 1 minute time frame, we can see that a bearish contractile diagonal is forming,
.png)
I make a trade at the next strong bullish candle. Trade data shown below:
.png)
Trade Data (Buy Trade)
| Crypto Pair | ACM/USDT |
|---|---|
| PRICE | 9.55 |
| **Amount | 1.5 |
| Total | 15USDT |
”4. Through a DEMO account, perform one sell the operation, through the Contractile Diagonal method. Explain the process and demonstrate the results and graphical analysis through screenshots. Bitcoin is not allowed.”
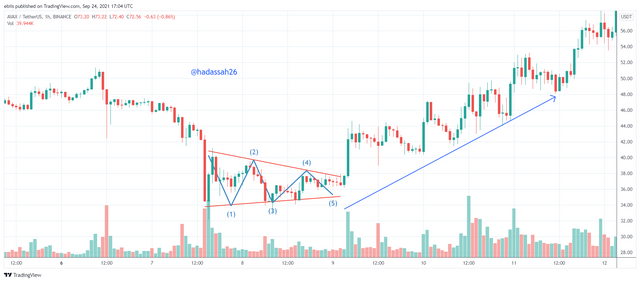
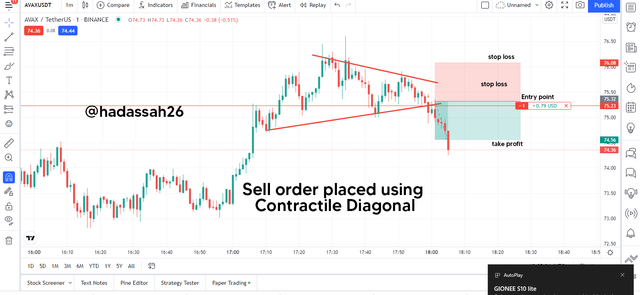
In this chart of AVAX/USDT in a 1min time frame, a sell order was placed in the market based on the contractile diagonal criteria.
- We can see from the chart, that the price was being compressed and the price was moving in between the diagonal line. There was an impulsive movement and retracement within the diagonal lines.
- From the chart we can see that all the criteria were met, which was discussed in question 2.
- I took the trade after I had noticed that the contractile diagonal price had broken out from the diagonal line which was going to fall. It was going to fall or move in the downward direction which is similar to sell
- The first breakout occurred but I waited because it was a fake-out, but when the second breakout came, I knew this was real. So that was my entry point.
- And you can see that the Diagonal Contractile is bullish, so I knew that it will result in the bearish reversal
- The exit point is at the horizontal support level which should be the "Take-profit" and the horizontal level should be my "Stop-loss".
Trade data in Picture below:
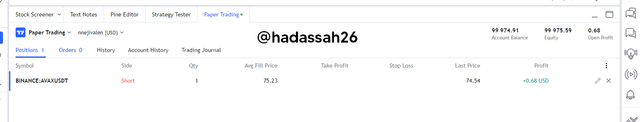
Trade data
| Crypto Pair | AVAX/USDT |
|---|---|
| Trade type | Sell |
| Last price | 74.54 |
”5. Explain and develop why not all contractile diagonals are operative from a practical point of view. (screenshot required / Bitcoin not allowed)”
No matter the accuracy of any strategy or price structure, it can never be 100% perfect.
Trading strategies and price analysis tools are all empirical and have not yet been scientifically proven to always give "True".
Price is still just a function of traders' psychology and hence it is prone to erroneous fluctuations. This then is why sometimes very similar contractile diagonal patterns may not be operative from a practical point of view.
In the example below:
we can see that although the price pattern seems to converge like a Contractile diagonal, price still continues trending upwards continuing its bull run,
On the other example below;
we can see that although the contractile diagonal has seen some erroneous waves, which should mean we abandoning the entry position, it still goes ahead and makes a sell.
These examples and price imperfection, in general, is why we should always have a risk to reward ratio when trading, setting a "Stop-loss" and a "Take-profit" cause one never really knows where price may go.
The Contractile Diagonal AKA, Wedge pattern is a great tool for price reversal detection. Traders are better informed by using price momentum and reduced volatility to detect an end to the current trend and the start of a reverse trend.
Thanks to professor @allbert for the wonderful lecture, it is always a pleasure learning new topics in the crypto academy.
Trade cautiously.
CC @allbert