On-Chain Metrics (Part-2)- Steemit Crypto Academy- S4W3- Homework Post for @sapwood
Good day everyone. Thanks to @sapwood for such a wonderful lecture on On-Chain Metrics (Part-2). I will be doing the homework from the lecture, so sit back and look for somewhere quite quiet and comfortable as you read through this amazing article I created just for you(😉). Let's get started!!!


Question 1: What is the difference between Realized Cap & Market Cap, How do you calculate Realized Cap in UTXO accounting structures?
Market Cap
Market Cap is the total value of a token, as it is calculated by multiplying the price of the token by the total circulating supply of the token. Hence, market cap, is very volatile as it is directly linked with the price of the token, so whenever the price of the token goes up, the market cap increases and vice versa.
Although, the market cap is not so realistic, as some tokens may be lost due to some reasons such as, a user forgetting his/her keys or the death of a user. So, those tokens value shouldn't be added to the total value of the token, as it may be miss leading to potential investors.

Take a look at the image above, you can see the coin details of TLOS token. Now, let's see calculate the market cap of the token.
From the image, the Market Cap is same with the Market Cap, I calculated. But what if among the total circulating supply, 50,000,000 TLOS token has been lost, is the Market Cap, the true value for the token's total value? I will touch this part later on, in the article, follow me.
Realized Cap
Realized Cap is a variation of the Market Cap, as it calculates each token based on the price it's was bought or it last moved, rather than it's current value. What this simply means is that if some users bought a token some time back, which was below the current value, the value which they bought the coin will be what is calculated and not the current value.
As a result of this, Realized Cap is very realistic with the value of a token's total value, as the lost tokens won't affect the total value of the token. but why?
Now imagine if Person A bought 1000 TLOZ at $0.1, that's $100 worth. The current value TLOZ is now $0.7, that's 7 times more than when Person A bought it, as the worth will now be $700. Realized Cap will calculate the value $100 for Person A, instead of $700, because we don't know if Person A has lost his/her keys or is died, hence, giving us a more realistic value of the token.
If Person A decides to make any transaction at all, like selling even 10 TLOZ, the entire value of this wallet will be adjusted to the current value of market, as the user is active and keys are still secured. The reason why his entire value of the user's wallet will be adjusted, is because, as soon as he sells 10 TLOZ, the entire 1000 TLOZ is sent out and remaining balance minus transactions will return back to the users account in the current market rate.
So, if Person A should make a transaction, the Realized Cap will experience an increase, because instead of $100 that has been recorded on the blockchain, $700 will now be recorded on the blockchain, thus, increase in Realized Cap of the token and vice versa, if Person A make a transaction below the price he bought TLOZ in the first place i.e if TLOZ current value is $0.08, the Realized Cap will experience a decrease in the value of token.
I hope you now understand the differences between Market Cap and Realized Cap.
How do you calculate Realized Cap in UTXO accounting structures?
I suppose you know how to calculate Realized Cap from my explanation above but let me further explain it.
Realized Cap is calculated by multiplying the number of tokens by the value of the token as at the period it was bought. I'm not using the UTXO term, in order for people who don't understand what it means. So, in other words, Realized Cap is the UTXO token multiplied by the value of the token as at the period it was bought.
For example, imagine Person A bought 10 BTC at $1 in 2010. 2012, He sold 2 BTC at $5. 2017, He sold 3 BTC at $100 and in 2021, the value of BTC is $2,000. What's the Realized Cap now? (This is just an illustration, that's not the real value of BTC)
The unspent token will be 5 BTC, since 2 BTC was sold in 2012 and 3 BTC was also sold in 2017. Hence, Person A Realized Cap in 2021, is $500. Why?
The last time Person A made a transaction was in 2017, when the value of BTC was $100, hence, the value remains $100. So, 5 unspent BTC token multiplied by $100 is $500.
Under Market Cap, Person A, Market Cap in 2021, will be $10,000. Because the unspent token, which is 5, will be multiplied by the current market value of BTC which is $2,000 and that will give us $10,000.
Question 2: Consider the on-chain metrics-- Realized Cap, Market Cap, MVRV Ratio, etc, from any reliable source(Santiment, Glassnode, etc), and create a fundamental analysis model for any UTXO based crypto, e.g. BTC, LTC [create a model for both short-term(up to 3 months) & long-term(more than a year) & compare] and determine the price trend/predict the market (or correlate the data with the price trend)w.r.t. the on-chain metrics?
Realized Cap
Short Term Analysis (3 months)

As you can see from the image above, you can notice that Realized Cap (RC) followed the priced movement of BTC. When the price of BTC started rising, the RC started rising too, but why? The reason for this, is that, holders of BTC were transacting and making good use of the bull run and taking their profit, hence, the rise of RC.
But if you noticed January 11th, the price of BTC dropped but the RC didn't fall with the price. The reason for this, was that, holders, didn't want to sell their coins, because they believe it was just a market correction and that the price will rise again. Funny enough, they were correct, the price of BTC continued it's bullish run on early February.
In the on month of April after BTC reached it's all time high and started falling, the RC didn't fall with it. But later in the month of May, RC started falling, why? The reason for this was that, holders were thinking it would be another market correction and didn't sell their coins when the price of BTC started falling in the month of April. But middle of the month of May, some holders started noticing, that it isn't a market correction but the beginning of a bearish market, so in order to take profit from their hold, they started selling and that resulted in the fall of Realized Cap.
In the month of July when the price of BTC started rising again, the RC didn't rise with it. The reason for this, is that, holders are not yet willing to sell their coins because they believe the price will go even higher in the future.
Long Term Analysis (2 years)

The long term is quite straight forward. As the price of BTC started rising in December of 2020, the Realized Cap(RC) started rising too. Because holders were selling and transacting their coins because they thought the price was right to sell. And as the price kept rising, they kept selling and taking their profit.
In the month of May 2021, when the price of BTC started falling, the RC didn't fall, it just remained the same. The reason for this, is that, holders are not willing to sell their coins at a lower rate and many new BTC investors bought at the All Time High and won't want to sell at a loss, so they are holding their coins, and waiting for the price of BTC to pump again.
Market Cap
As I said earlier, the price of a Coin and the Market Cap move together, but why? The reason is quite simple, the price of the coin is what makes the Market Cap(MC). If the price of a coin goes, the MC goes up too and vice versa.
So the analysis for short and long term of BTC Market Cap will be the same and there would be nothing to pick out from the chart. Because the MC is overlapping the price, because the MC depends on the price of BTC at every given time. Look at the image below for more understanding.

MVRV Ratio
MVRV Ratio is Market Cap divided by Realized Cap. MVRV is a leading indicator that helps traders determine the direction of market trend.
Short Term Analysis (3 months)

From the above, I will give attention to two major spot in the chart, that would help you know how the MVRV ratio can determine the trend direction.
In month of January 2021, the MVRV ratio experienced it's lowest level, since the month of October, 2020 when the MVRV ratio was 2.45%, ever since then, it hasn't gotten that low, until January 2021, when the MVRV got to as low as 10.13%. What that indicates, is that, traders will be willing to buy more of BTC as they believe BTC has gotten to it's lowest support level. So, it is an opportunity for traders to buy more BTC. After the MVRV ratio hit 10.31%, we notice a huge pump in price. This is because traders feel, this is the lowest BTC can get, and it is an opportunity to buy more and more of the coin, which resulted in the pump of the price.
In a all, I noticed that whenever MVRV goes low, the price of BTC goes up. You can see it in the image below.

Long Term Analysis (3 years)
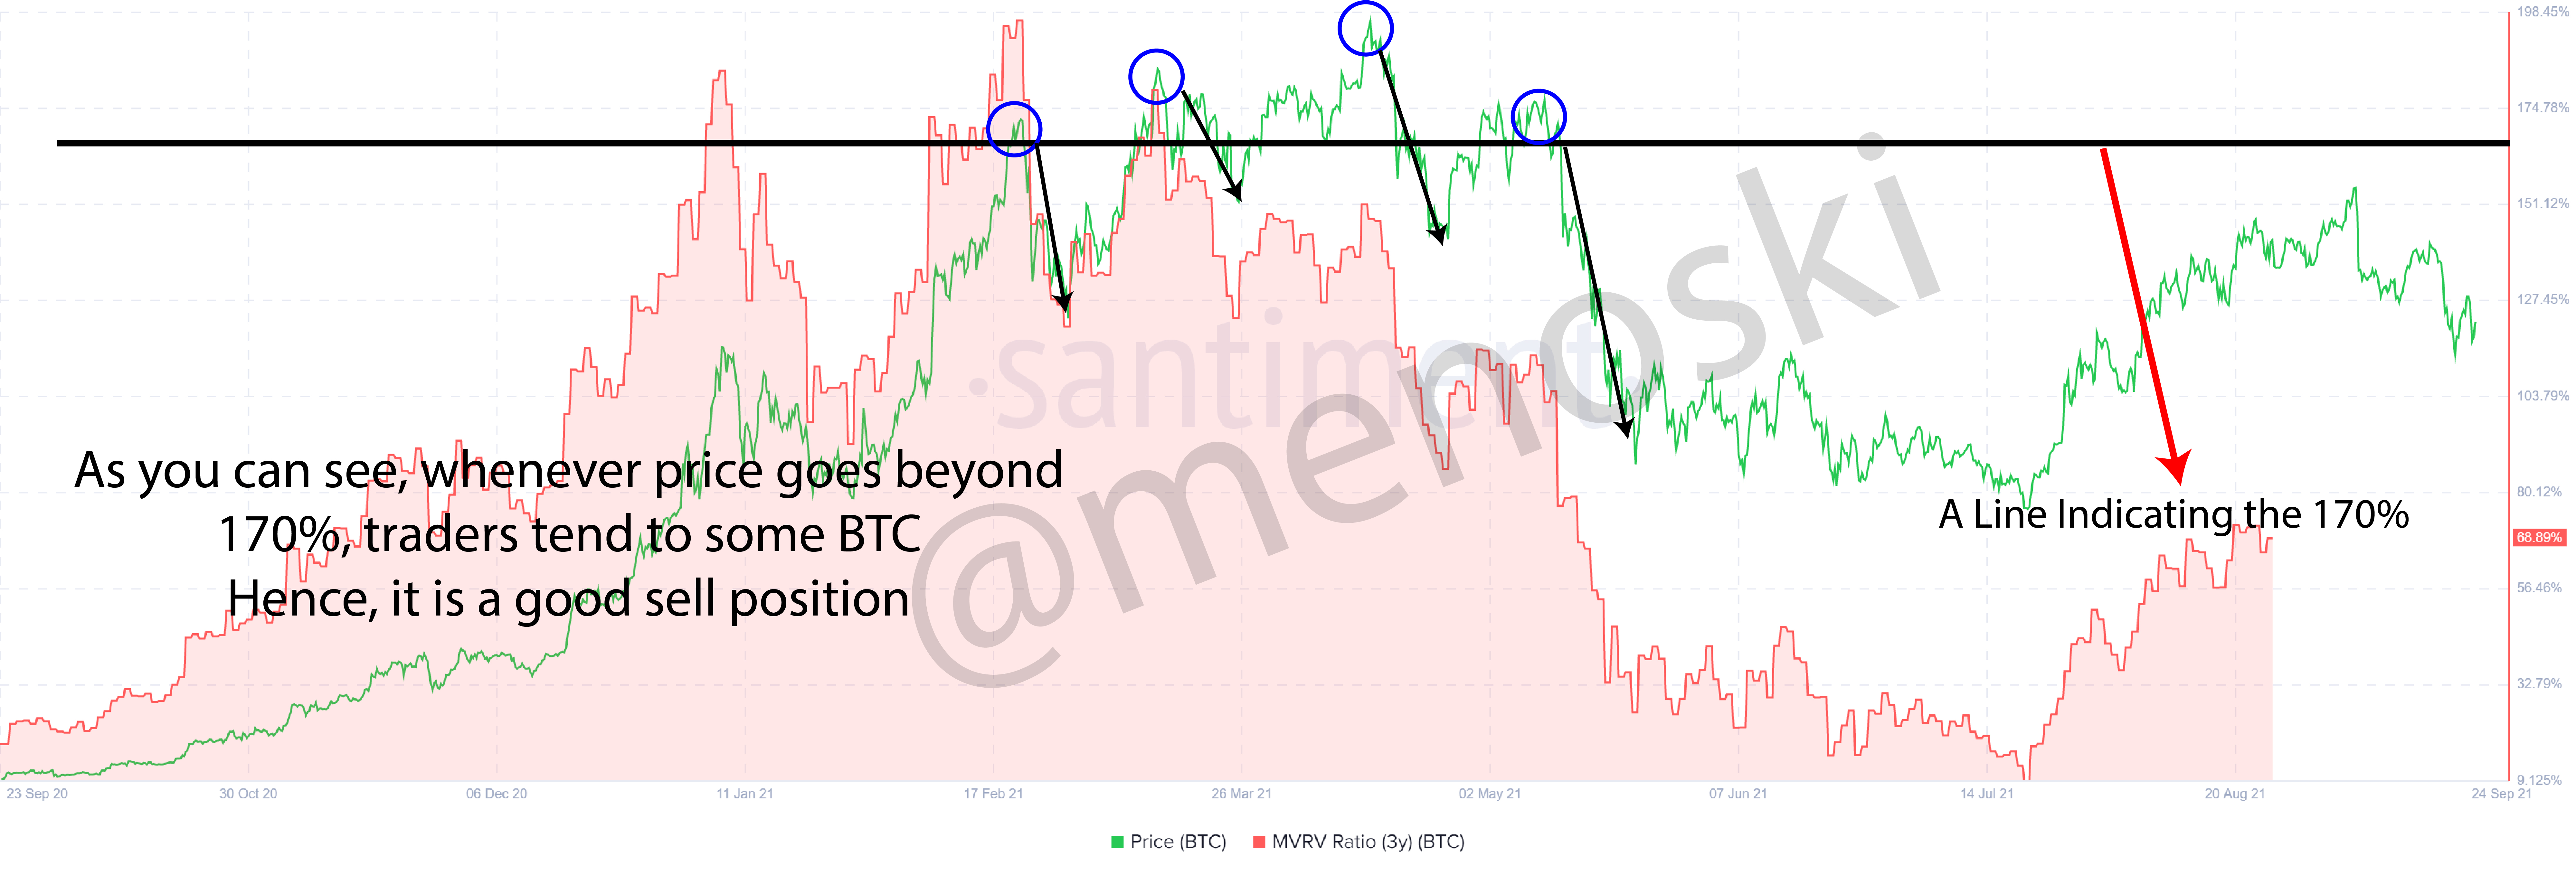
For the long term, which is 3 years and above, I noticed that a good selling position for traders is when the Price is over 170%. And I have three trends to prove this theory is accurate.
And also, whenever MVRV goes low, we always notice the price of BTC will go up(Just like Short Term, which you saw above). Why is it so? This is because traders are seeing as an opportunity to buy more BTC.
Note: MVRV Ratio has some differences with MVRV for a specified period of time and that's why I gave the long term period a good sell position percentage for traders, whereas the MVRV Ratio has some set percentage which is a good signal for traders to buy or sell, which I will talk more later in the article.
Question 3: Is MVRV ratio useful in predict a trend and take a position? How reliable are the upper threshold and lower threshold of the MVRV ratio and what does it signify? Under what condition the Realized cap will produce a steep downtrend?
Is MVRV ratio useful in predict a trend and take a position?
Yes, MVRV can predict a trend. As I said earlier on, MVRV is a leading indicator that help traders predict the trend of the market. Although, it has some principle or conditions guarding it. So, in order to know just how well to predict the market using MVRV, you have to know these conditions, which are;
Whenever the Price is above 250% - 300%, this is a position for traders to sell some of their assets, as a bearish trend will be expected soon enough. Reason for this, at some point, traders must take profit from their investment and at the 250 - 300% position, traders feel it is time to sell. And as soon as some big whales start selling some of their assets to take profit, the market will experience a fall in price of the asset. When the Price is above 250%, be alert to a change in trend but when it is over 300%, it is highly advisable to sell, as a change in trend is close.
Whenever the Price is below 100%, this is a position for traders too buy the asset and accumulate the asset, as a bullish trend will be expected soon. Reason for this, is that, at this point, traders feel this is the lowest the asset can fall below and it is the right to buy the asset because the asset is below it's value. As traders begin to buy more and more of the assets, that will definitely lead to the rise of the price of the asset. So, whenever the Price of an asset is below 100%, it is time to buy more of such asset.

How reliable are the upper threshold and lower threshold of the MVRV ratio and what does it signify?
I believe both the upper threshold and lower threshold are reliable to some extent. If your MVRV is above 300%, I believe you are pretty sure, a fall in price is expected soon enough and if your MVRV is below 100%, you are pretty sure also, that a rise in price of the asset will be expected. Hence, both the upper threshold and lower threshold are reliable, whenever the MVRV Ratio reaches those percentages respectively. Between the two threshold, the lower threshold is more reliable to me. Because I feel it's time to acquire more of the assets, and definitely with time, the price of the asset will pump. I believe this approach are for long term traders/investors.

Under what condition the Realized cap will produce a steep downtrend?
Hmmmmm, quite interesting. I believe a steep downtrend of the RC is rare but it does happen. And a condition where this would occur, is if investors/traders doesn't believe in the project anymore, so investors/traders just want to get out of the project, then you can see this condition occuring.
I believe I witnessed this condition in 2020, when Sushi developer stole about $14m worth of Sushi. The price of the asset fell from $10 to $0.4, in matter of days.

Damn!! I guess I haven't witnessed this condition because RC remained unchanged regardless of the major fall in the price of Sushi. I wished I had the knowledge of Realized Cap, back then because Realized Cap didn't fall with the price meaning, the major investor of the project, still believed in the project and were not ready to sell their Sushi. Because I bought at the peak($10) and sold at $1, thinking the project was done for. Months later, it rose over my initial position. So, Realized Cap shows the real picture of asset and not the Market Cap.
So, it is quite rare for this condition to occur, but it is possible. When a project wants to shut down or investors of the project, no longer believe in the project, we should be able to witness a steep downward of the RC of that project.
Conclusion
This was an insightful homework, it took me 3 days, because I was excited about the topic and wanted to know more and more about the topic and it was great having this knowledge. If I had this knowledge back then in 2020, I wouldn't have made 10x loss in my sushi investment, because I would have seen the fall of the price as an opportunity to buy more Sushi tokens.
On-Chain Metrics really does give traders an in sight into the background information of how the price of an asset really is. Understanding Realized Cap is a huge plus, because I can see when major investors are selling or holding which will give me the needed information to make a good financial decision of either hodling my asset or selling it.
Special thanks to you, @sapwood, for organizing this amazing class and giving this excellent assignment, as it has helped me in the understanding Realized Cap, Market Cap and MVRV Ratio.