Crypto Academy Season 3 Beginners’ Level - Homework Post for WEEK 7: [Analysis and Trading with the indicators "Stochastic Oscillator +" Parabolic Sar "] by @reddileep for Professor lenonmc21
HOMEWORK WEEK 7
Entire Question
Theory
Define in your own words what is the Stochastic Oscillator?
Explain and define all components of the Stochastic Oscillator (% k line,% D line + overbought and oversold limits).
Briefly describe at least 2 ways to use the Stochastic Oscillator in a trade.
Define in your own words what is Parabolic Sar?
Explain in detail what the price must do for the Parabolic Sar to change from bullish to bearish direction and vice versa.
Briefly describe at least 2 ways to use Parabolic Sar in a trade?
Practice
It shows a step by step on how to add the Stochastic Oscillator to the chart (Indicating the% k Line and the% D Line, the overbought and oversold zone.
Show step by step how to add Parabolic Sar to the chart and how it looks in an uptrend and in a downtrend.
Add the two indicators (Stochastic Oscillator + Parabolic Sar) and simulate a trade in the same trading view, on how a trade would be taken.


- Stochastic Oscillator is a useful indicator that we use to analyze charts and minimize trade losses and it was developed by George Lane. Actually, the advantage of using this indicator is that we can trade using this indicator even without the support of any other indicator. However, if we can use this indicator with any other useful indicator, we can get a high percentage winning rate.
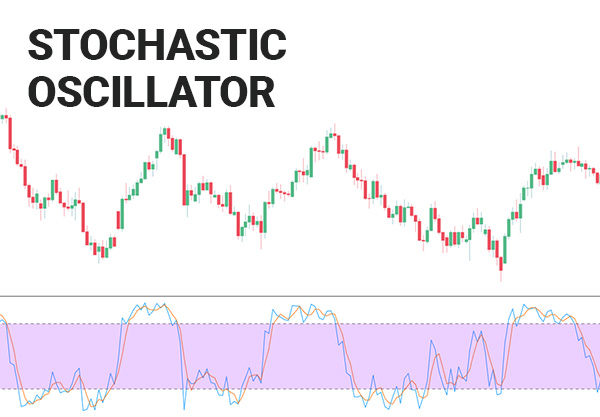
Image Source
Primarily this indicator works with two lines "%K" and "%D". So, here we can use this indicator as a signal to start the trade and to close the trade. So even if the signals here are not always successful, they are more likely to succeed.
Furthermore, when the "%K" line crosses the "%D" line and goes up, we can see it as an uptrend in the market price. At the same time, when the "%K" line crosses the "%D" line and goes down, we can see it as a fall in the market price. Additionally, most traders use this indicator to identify overbought and oversold conditions. I will briefly explain about them from the next question.

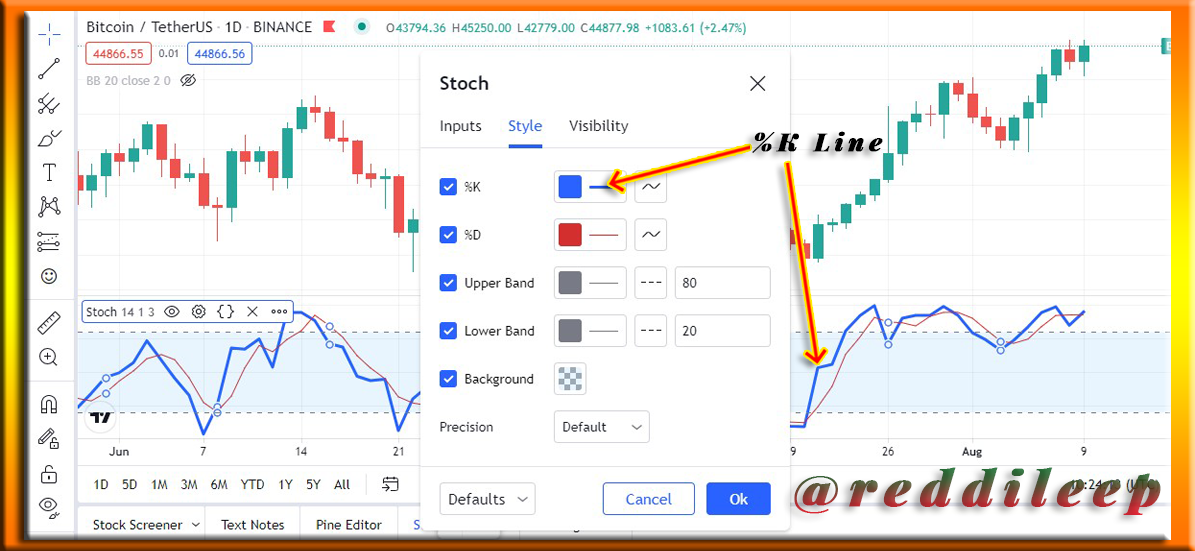
% K Line :-
- When we use this indicator in our chart window, we see that there are basically two lines. So primarily we consider the behaviour of the "%K" line to make decisions and it is also known as the "fast" stochastic indicator. When the "% K" line rises above the %D line, we can place the buy order. This means that prices in the market can go up. When the "% K" line drops below the %D line, we can place the sell order or we can sell our coins. Because this means that prices in the market can go down.
Below I've included the calculation of %K Line
% K = (Current Close – Lowest Low) / (Highest High – Lowest Low) x 100
Below I've highlighted "% K" line through Tradingview site.

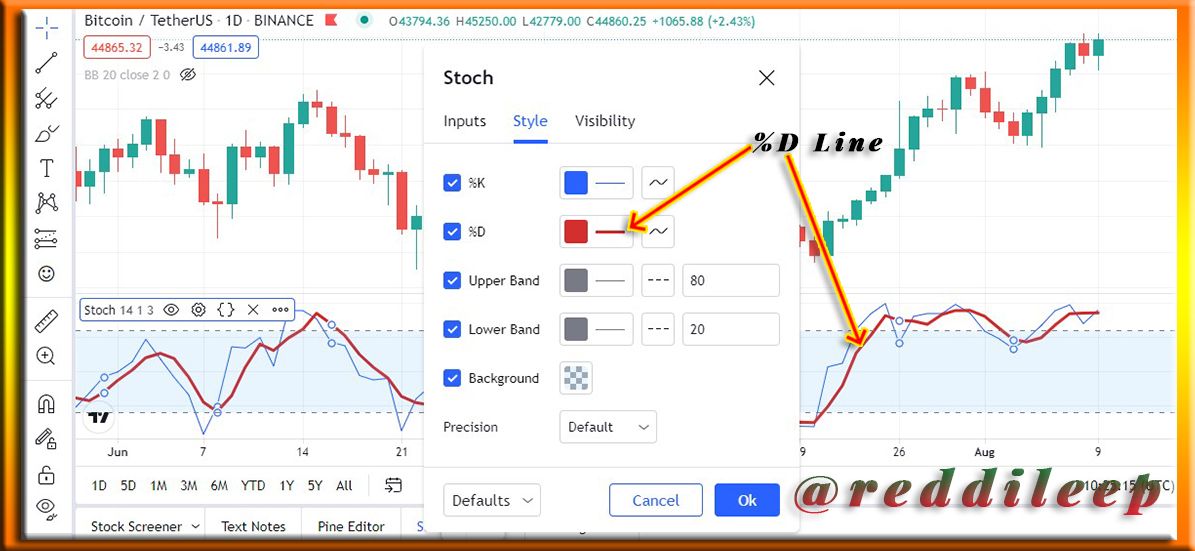
% D Line :-
- This is the second line of this Stochastic Oscillator and it is also known as the "slow" stochastic indicator. Furthermore, this % D Line is working as a moving average line of %K line. This % D line also helps to generate signals along with the % K line. Sometimes we can see this %D Line displayed as a dotted line like MetaTrader 4 charts.
Below I've included the calculation of %D Line
% D = Simple Moving Average of % K
Below I've highlighted "% D" line through Tradingview site.
Overbought & Oversold limits :-
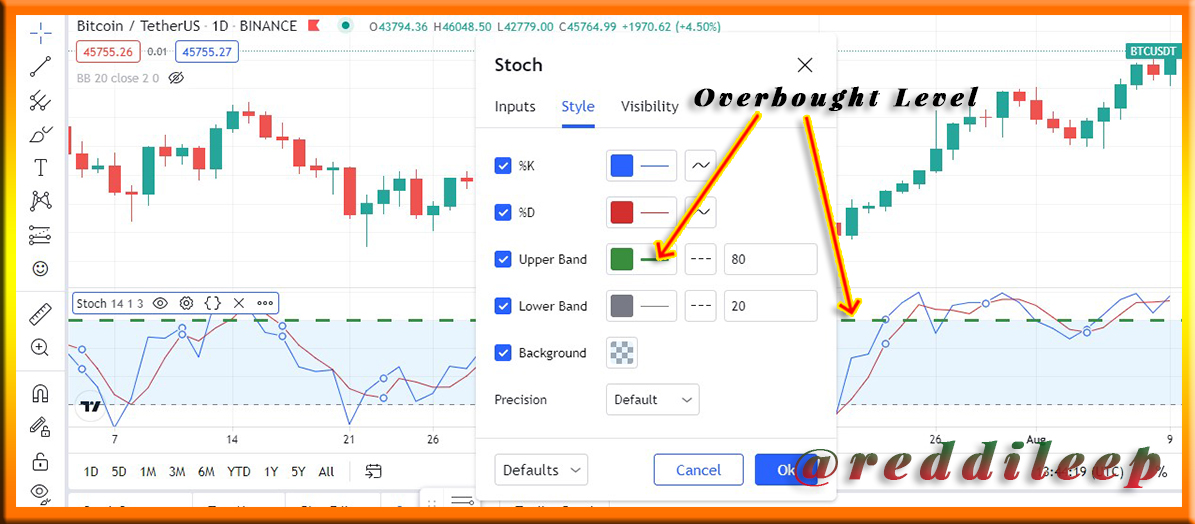
In the Stochastic Oscillator indicator, we can see it is ranged between 0 to 100. So, readings over 80 are considered in the overbought range and readings under 20 are considered oversold according to default settings in the indicator.
Furthermore, Overbought is displayed as the Upper band in the indicator and when prices move above the Overbought level, we can realize that the market has strong bullish momentum.
Below I've highlighted the Overbought level through Tradingview site.
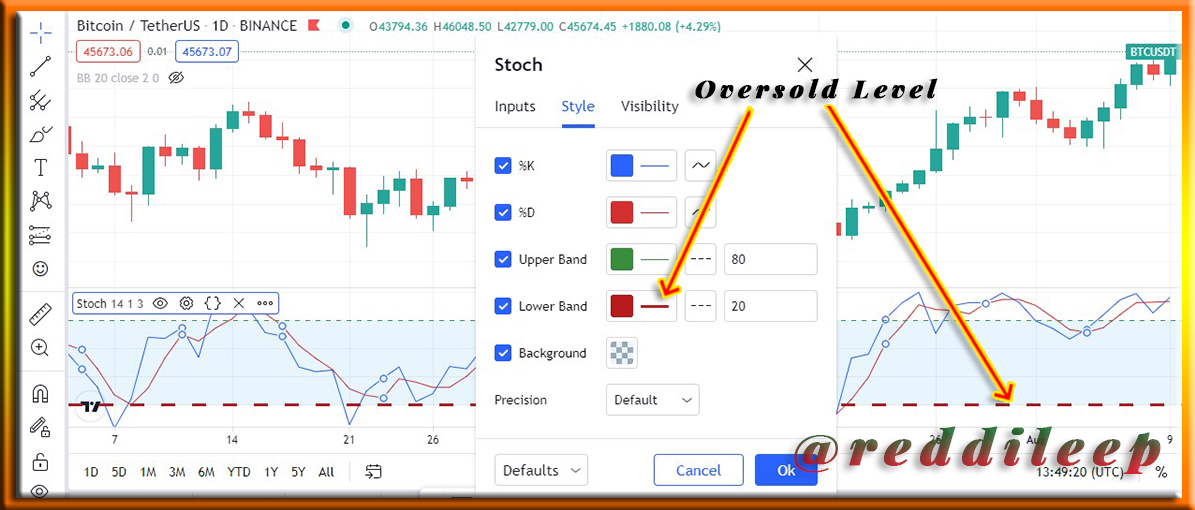
- In the same way, Oversold is displayed as the Lower band in the indicator and when prices move below the Oversold level, we can realize that the market has strong bearish momentum.
Below I've highlighted the Oversold level through Tradingview site.

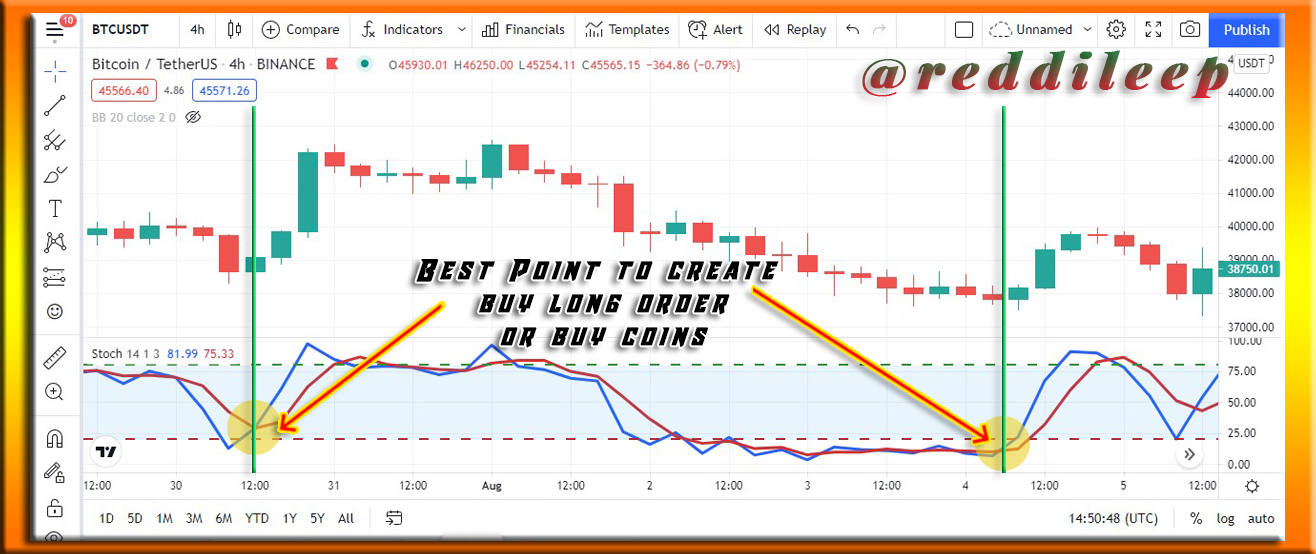
To identify the opportunity to start a trade
- Simply put, identifying the best place to buy coins or create a buy long order. According to my knowledge, if we are able to buy coins below the Oversold level, there is a possibility to go for a higher profit. But we should identify the correct point that the %K" line crosses the "%D" line and goes up. Then we can create the order if we can see a clear and lengthy bullish trend.
Below I've highlighted the trade starting point through Tradingview site.
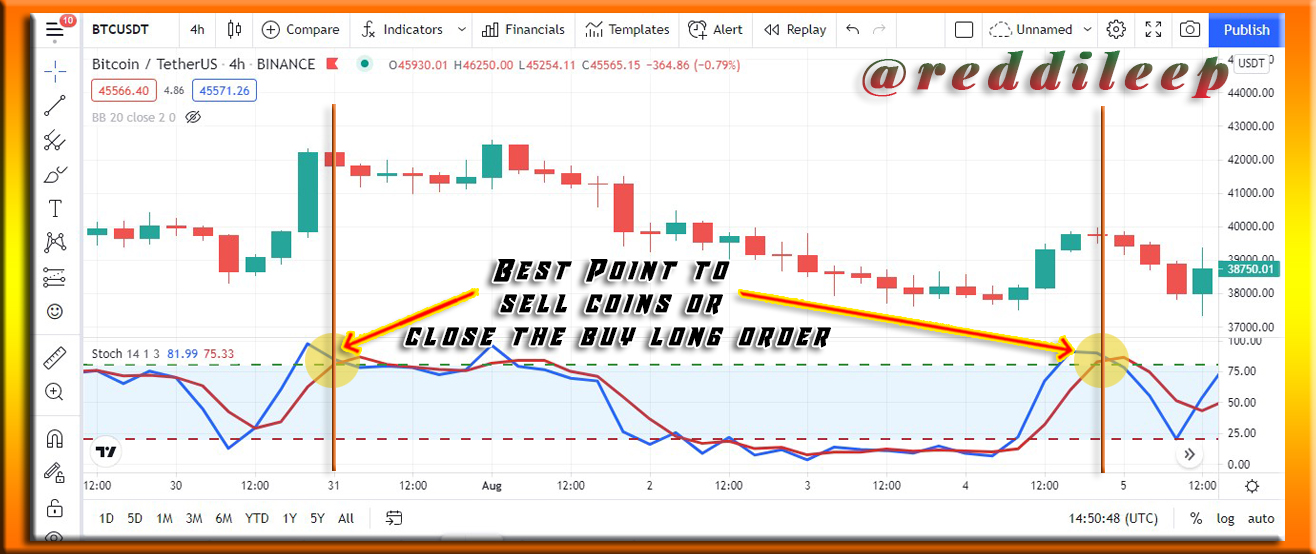
To identify the opportunity to close a trade
Simply put, identifying the best place to sell coins or close our buy long order. This is basically the reverse of the previous topic. So, according to my knowledge, if we are able to sell coins above the Oversold level, there is a possibility to go for a higher profit. But we should identify the correct point that the %K" line crosses the "%D" line and goes down. Then we can close the order if we can see a tendency to reverse the trend.
Below I've highlighted the trade closing point through Tradingview site.

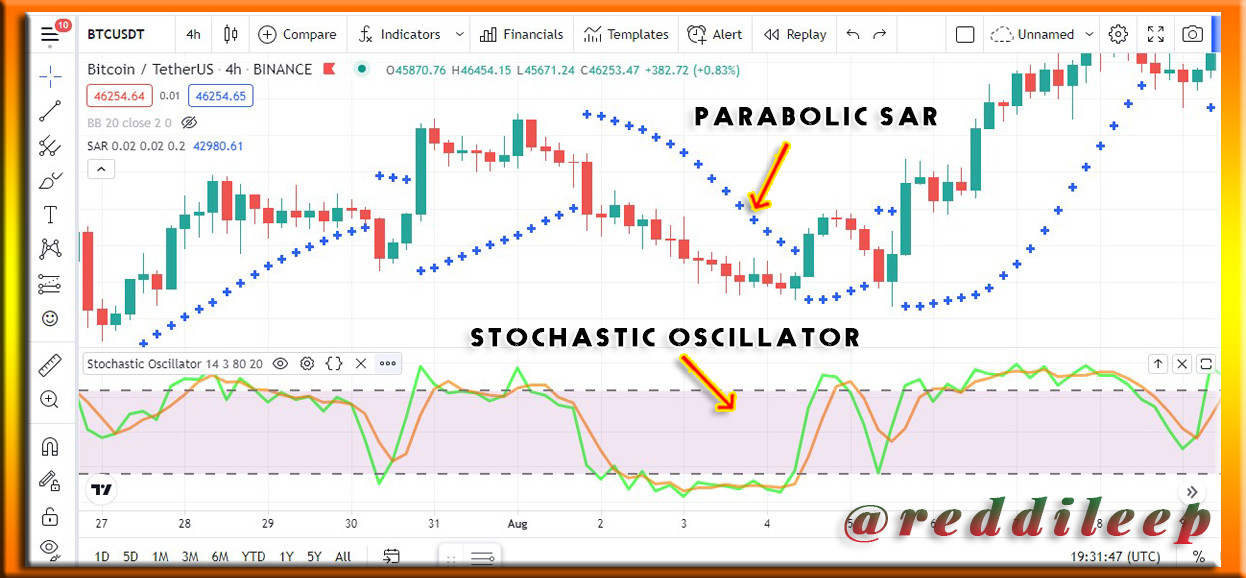
- Like most other indicators, this Parabolic Sar can be referred to as an indicator that helps in identifying the correct direction of the underlying market and getting the correct entry point. Although this indicator Parabolic Sar indicator works like a moving average, we can generate faster and higher accurate signals through this Parabolic Sar indicator. therefore, this indicator is very popular among most traders including me.
Below I've included a sample image of the Parabolic Sar indicator.

Image Source
Here the indicator shows a dotted line above and below the market. So, a dotted line above the market or above the candlesticks chart indicates that the market is going down. That is, the market trend is reversed and goes back to a downtrend. And also, if a dotted line displayed below the market or below the candlesticks chart indicates that the market is going up. That is, the market trend is reversed and goes back to an uptrend.
So, we can use this indicator to buy coins at the right time and sell coins at the exact point. And also, we can enter for a sell short order or a buy long order at the right time. However, we can't make a decision with 100% confidence and we need to analyze charts very carefully to get a higher winning percentage.

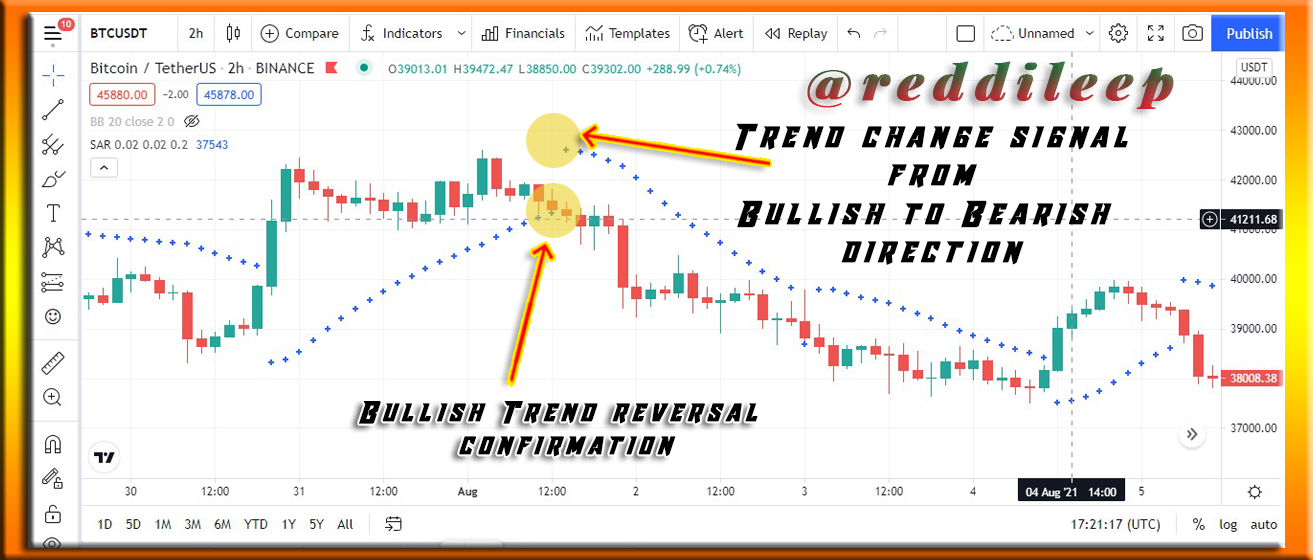
Change from Bullish to Bearish direction :-
- We already know that when the dotted line displayed below the market price or below the candlesticks chart indicates that the market is in a Bullish trend. So, the time that this dotted line touches a candlestick and change the dotted line from below to above market price can be defined as a trend reversal situation. It means it changes the market price from bullish to bearish direction
Below I've highlighted the Bullish to Bearish direction trend change point through Tradingview site.
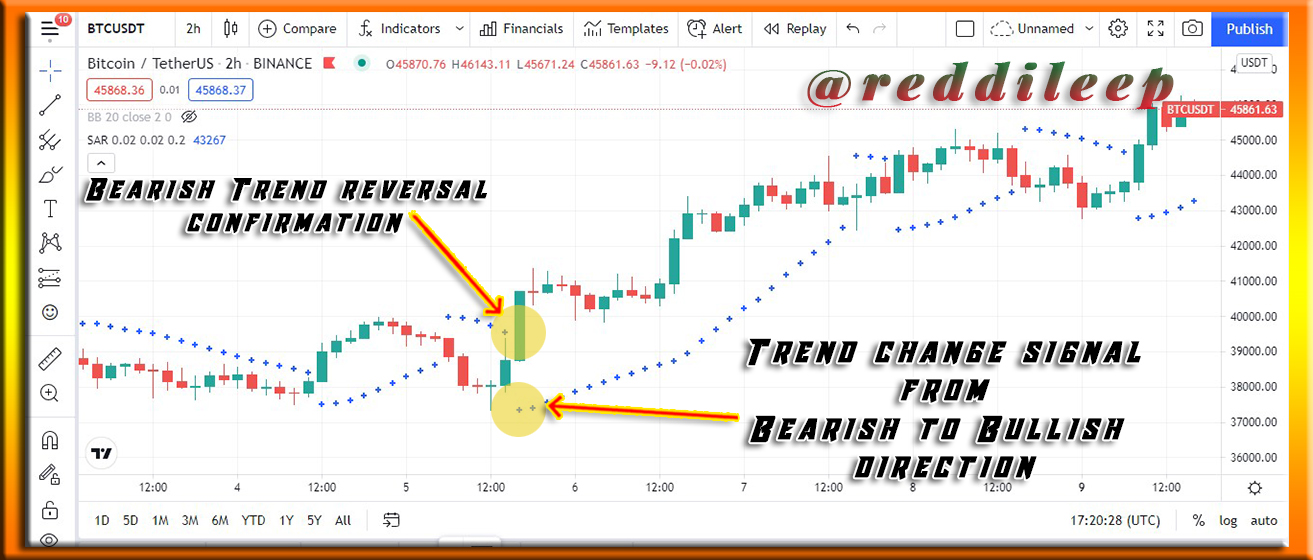
Change from Bearish to Bullish direction :-
- This is the reverse situation of the previous topic. So as I described earlier when the dotted line displayed above the market price or above the candlesticks chart indicates that the market is in a bearish trend. Furthermore, the time that this dotted line touches a candlestick and change the dotted line from above to below market price can be defined as a trend reversal situation. It means it changes the market price from bearish to bullish direction.
Below I've highlighted the Bearish to Bullish direction trend change point through Tradingview site.

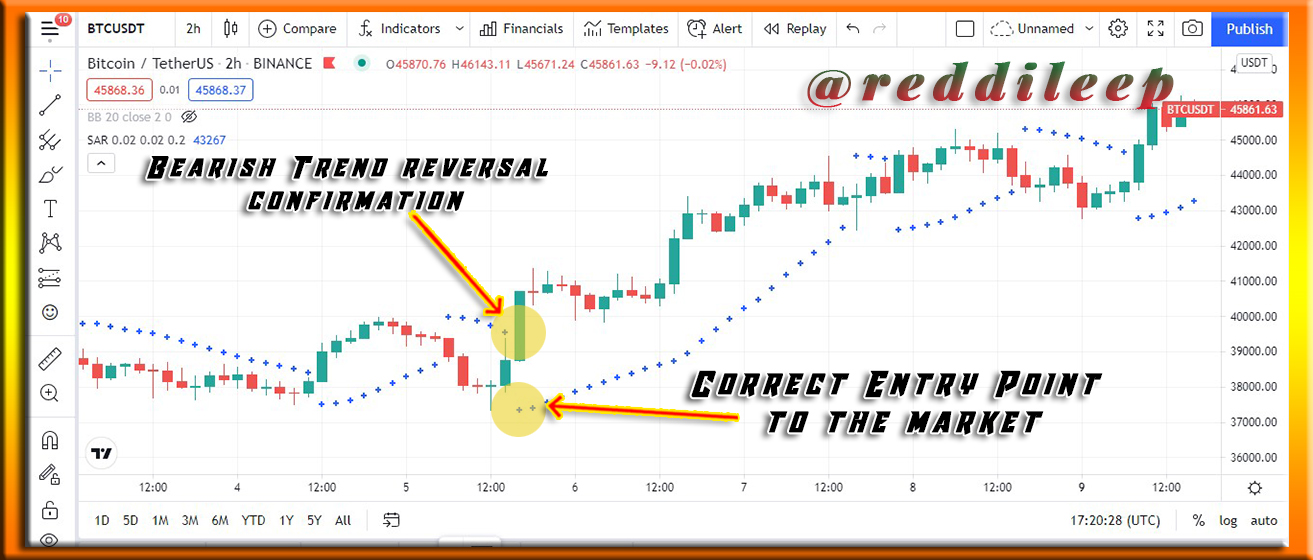
Identify possible Entry points to the market :-
- If we enter the market from the wrong entry point, it can be a reason to lose even our whole investment. Therefore, we can use this valuable Parabolic Sar indicator to identify correct entry point to the market. So, we can enter the market when the dotted line begins to indicate below the market price. Below I've explained it through the chart.
Below I've highlighted a possible Entry point through Tradingview site.
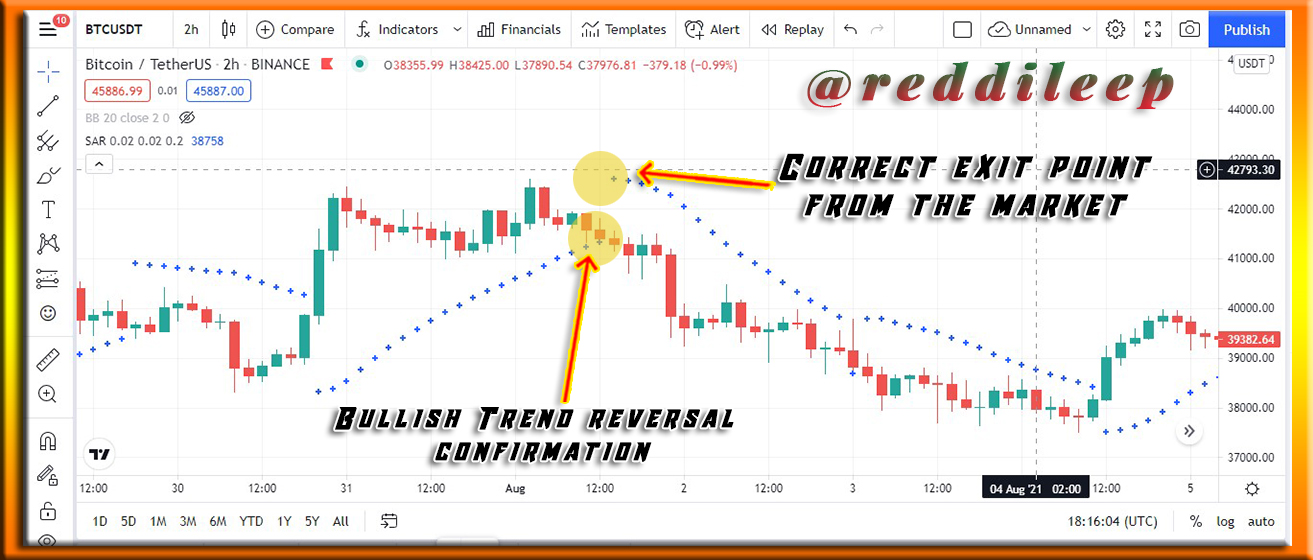
Identify possible exit points from the market :-
- If we exit from the market at the wrong point, it could be a reason for the decline in profits. Therefore, again we can use this Parabolic Sar indicator to identify correct exit points from the market. So, we can exit from the market when the dotted line begins to indicate above the market price. Below I've explained it through the chart.
Below I've highlighted a possible exit point through Tradingview site.


Here I've used Tradingview site to demonstrate my steps in adding the Stochastic Oscillator to the chart.
STEP 1
- First of all, we can open the chart using any currency pair. Here I've used Tradingview chart with BTC/USDT pair. Then we can open the chart.
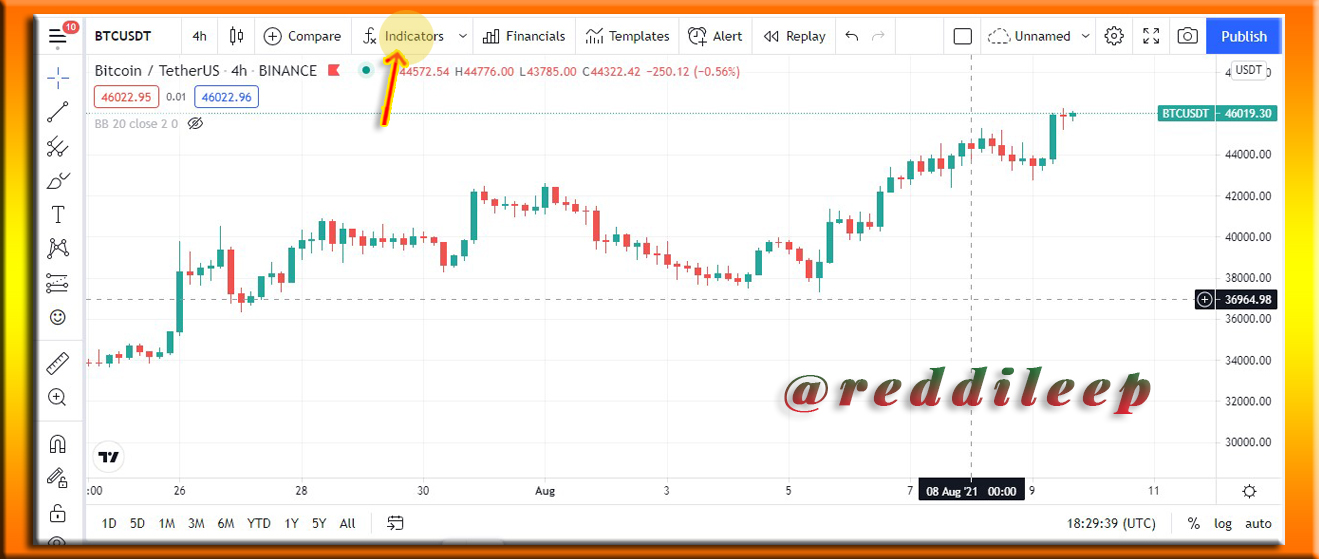
STEP 2
- After that, we can click on "Indicators & Strategies Icon" from the top tools panel to open the Stochastic Oscillator. Below I've demonstrated it.
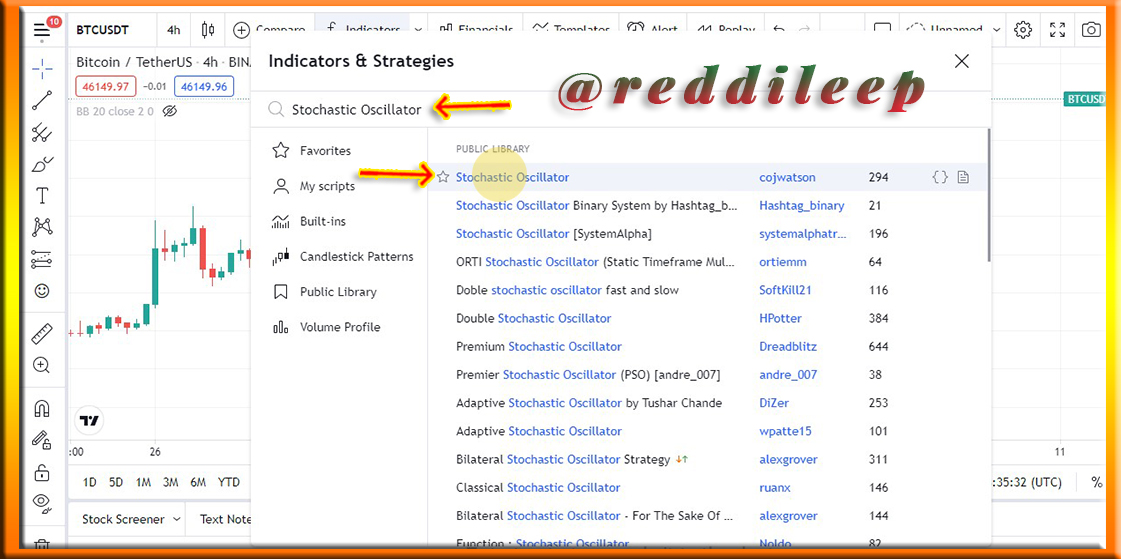
STEP 3
- From the popup window, we can search on "Stochastic Oscillator" in the search bar.
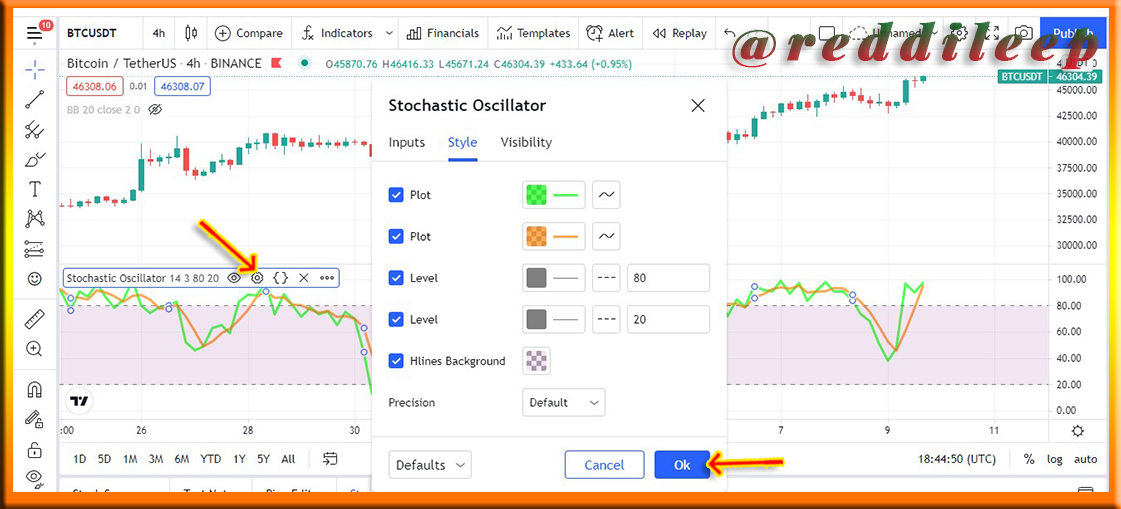
STEP 4
Now we can see Stochastic Oscillator has displayed in our chart. We can customize it according to our requirements. Here I will increase the thickness of the lines as I need to highlight them.
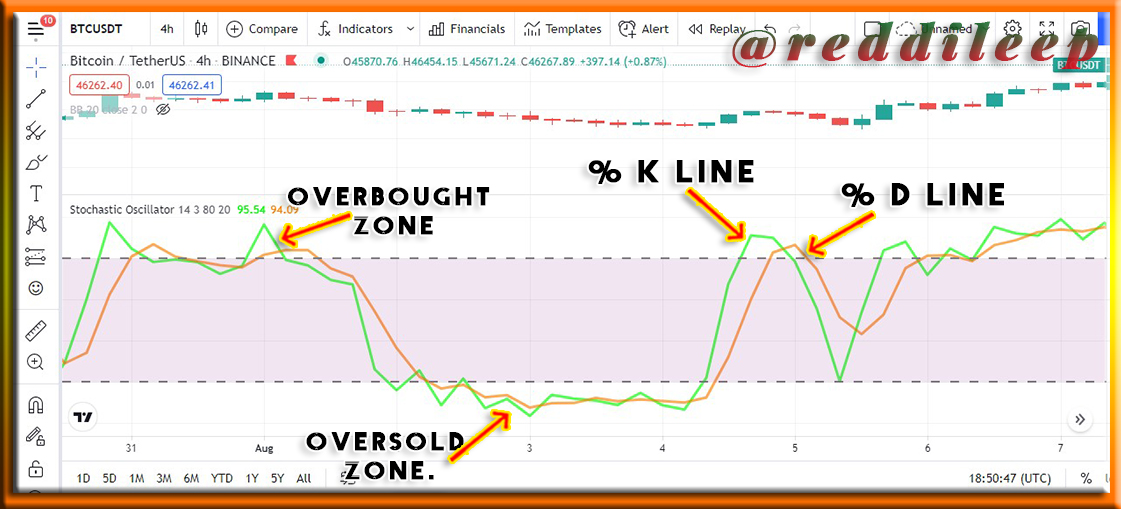
STEP 5
- Finally, we can see Stochastic Oscillator has been successfully added to our chart. Furthermore, here I've highlighted % k Line and the% D Line, the overbought and oversold zone.
STEP 1
- First 2 steps are the same as previously. However, I will repeat them again to demonstrate my steps. First of all, we can open the chart using any currency pair. Here I've used Tradingview chart with BTC/USDT pair. Then we can open the chart.
STEP 2
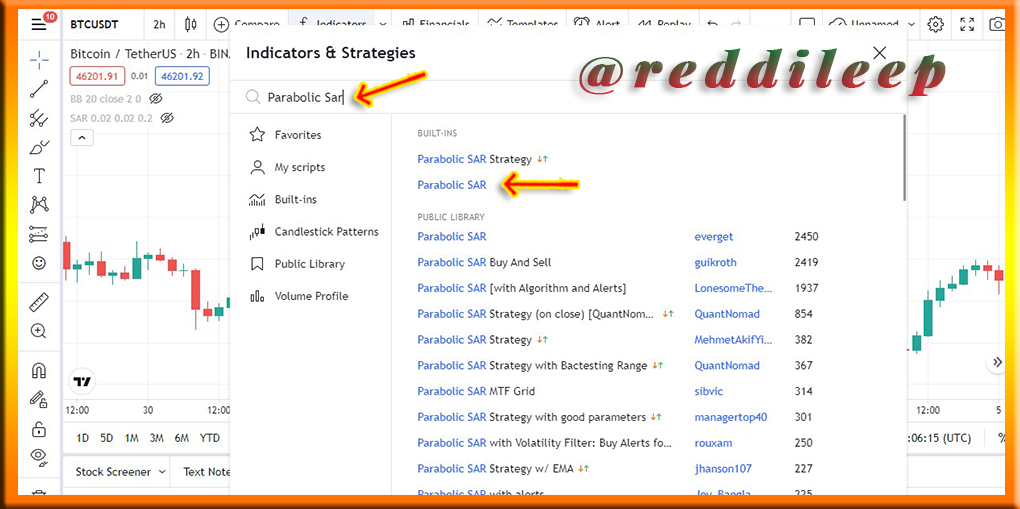
- After that, we can click on "Indicators & Strategies Icon" from the top tools panel to open the "Parabolic Sar" indicator. Below I've demonstrated it.
STEP 3
- From the popup window, we can search on "Parabolic Sar" in the search bar.
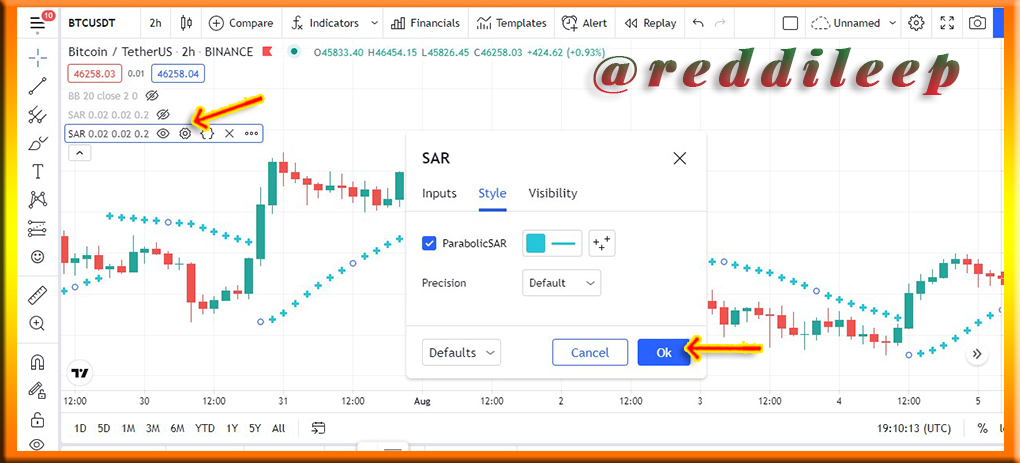
STEP 4
Now we can see the "Parabolic Sar" indicator has displayed in our chart. We can customize it according to our requirements. Here I will increase the thickness of the dotted lines as I need to highlight them.
STEP 5
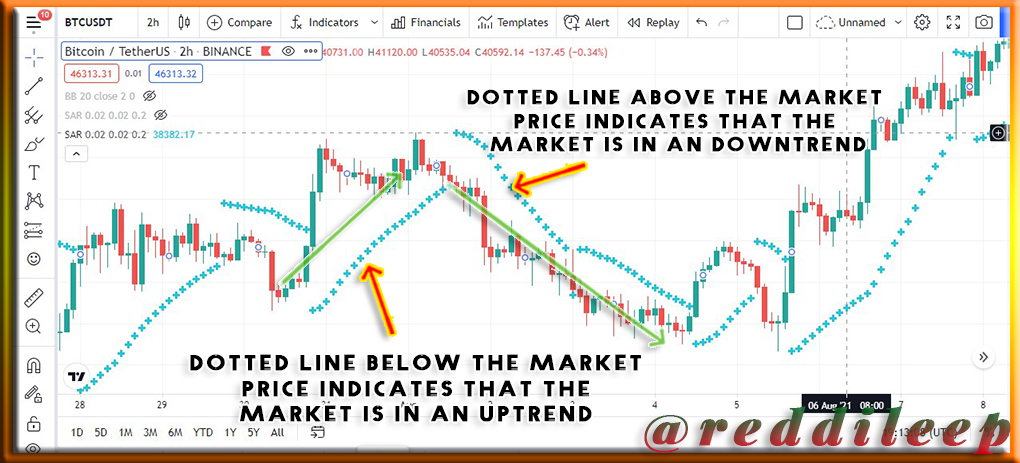
- Below we can clearly see when the dotted line goes below the market price, it means the market is in an uptrend. And also, when the dotted line goes above the market price, it means the market is in a downtrend.

STEP 1
- here I've added both indicators to the chart from the indicators panel.
STEP 2
- Below I've simulated a trade in the same trading view. Here I've selected to simulate a trade entry point according to both indicators. Actually, we should find a point that the "%K" line crosses the "%D" line and goes up in the Stochastic Oscillator and the dotted line should be started to indicate below the market price. Then we can enter the trade as the market price begins to create an uptrend.
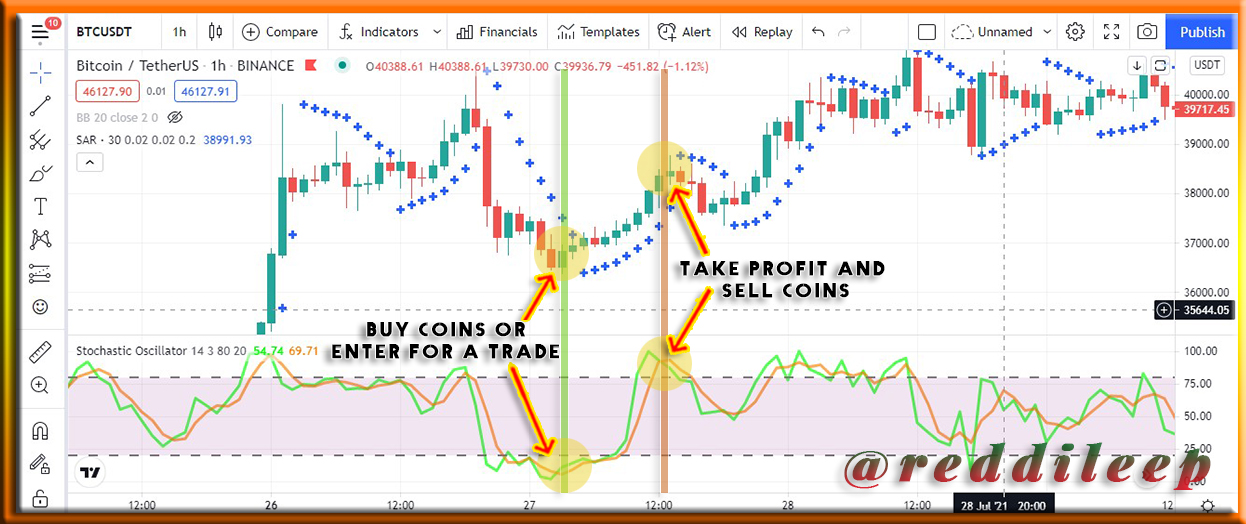
Above we can see when we get the correct signal from both indicators, we can get an accurate signal and a higher possibility to increase our profits.

When we trade in the crypto market, it is essential to use some indicators as we can't take decisions alone. So, if we want to increase our winning rate, we can use more than one indicator in our chart. Today, we learnt about another important two indicators. Stochastic Oscillator is a good indicator that even we can use alone without any other indicators. Parabolic Sar is another indicator that we can get a higher winning rate. However, both indicators together we can create a successful order in the market.
This is all about my homework and I really appreciate Professor @lenonmc21 for your valuable lesson and your dedication to creating a very essential lesson for us. Usually, this lesson is really important to my life as I am still trading in the cryptocurrency market.

Thank you..
Hello @reddileep,
Thank you for taking interest in this class. Your grades are as follows:
Feedback and Suggestions
You have done a very wonderful job on this! Very detailed and informative.
A good arrangement as well. Good job!
Thanks again as we anticipate your participation in the next class.
Thank you very much for your feedback 👍