Crypto Academy Season 4 | Intermediate Level Course for Week 2 : [Heikin-Ashi Trading Strategy] by @reddileep
Image Created by Adobe PS
Hello Steemians!
This is my first lesson as a Crypto Professor in this Academy. So, I hope to explain a number of important things in the field of crypto that was not discussed in the previous season. You will definitely learn new things and enjoy my lessons. 😎
Furthermore, I present these lessons only for educational purposes and keep in mind that the cryptocurrency market is a very risky market and even a small mistake can ruin your entire investment.

Today I am going to teach you about a special trading technique. Most people may not have known about this. We call this technique Heikin-Ashi Trading. Let's see what Heikin-Ashi Trading is all about.

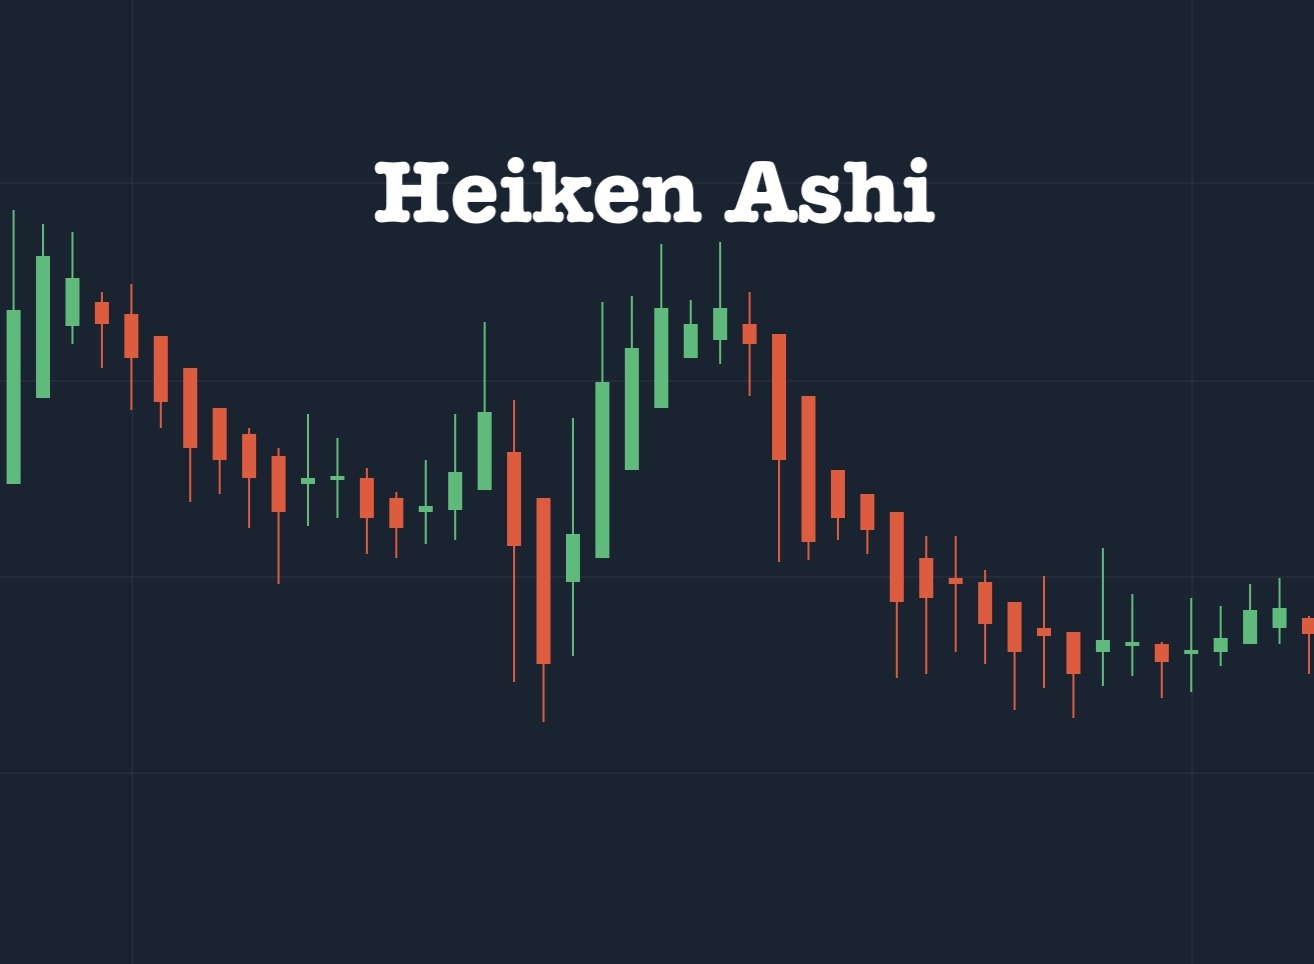

When we discuss the difference between the traditional Japanese candlestick chart and the Heikin-Ashi chart, we can first clearly see the difference in the appearance of these two charts. In fact, the traditional candlestick chart is a bit more complex and the Heikin-Ashi chart is designed to clearly identify the price trends. Below I've shown the appearance of both graphs.
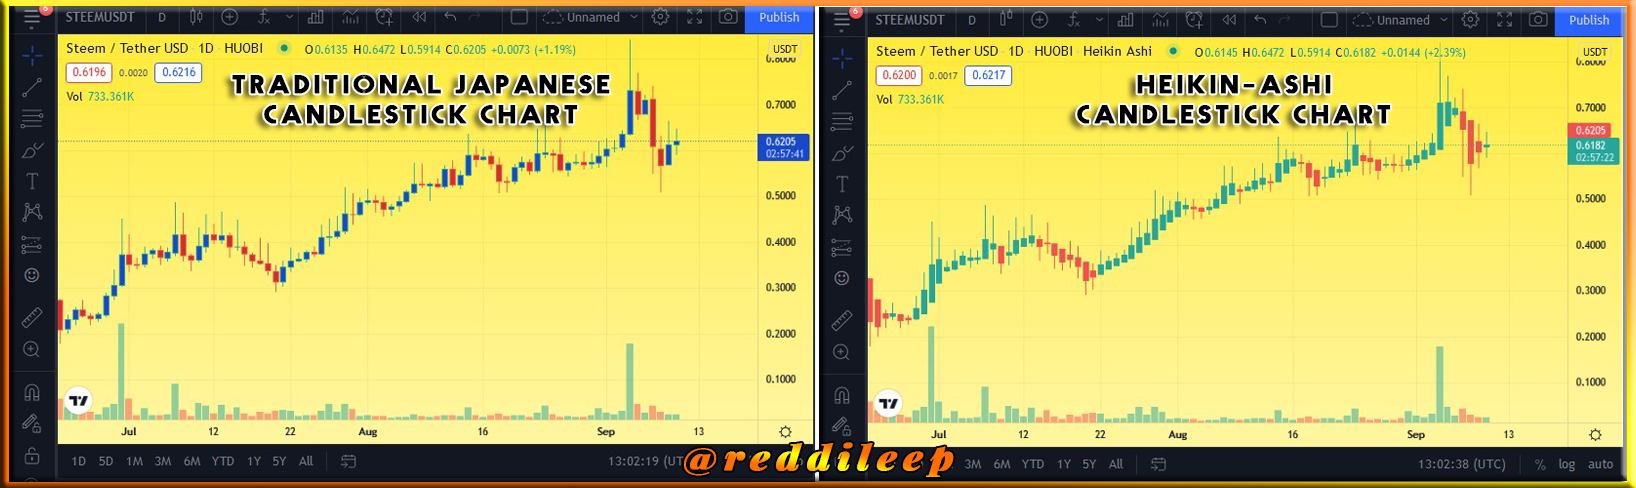
Screenshot is taken by https://www.tradingview.com

Here, I've briefly explained the difference between this traditional Japanese candlestick chart and the Heikin-Ashi chart through a table.
| Heikin-Ashi candlestick chart | Japanese candlestick chart |
|---|---|
| The graph looks very smooth. | The graph looks a bit complicated |
| The market trend can be easily identified | Difficult to identify the market trend |
| The colour of the candles changes only when the clear market trend changes | Even the slightest change in the market changes the colour of the candles |
| Candlesticks are created by calculation | The new candle starts at the level where the previous candle closed |

We already know that Heiken-Ashi candlesticks use 4 types of data to create current candlesticks in a chart.
- Open
- Close
- High
- Low

Here the opening of the previous candle and the close of the previous candle are added and divided by two. Below I've explained it through the formula.

Image Created by Adobe PS

Here the open, close, high and low points of the current candle are added together and divided by four. Below I've explained it through the formula.

Image Created by Adobe PS

Here, High equals to the maximum value of the High, Open or Close points of the current candle. Below I've explained it through the formula.

Image Created by Adobe PS

Here the Low equals to the minimum value of the Low, Open, or Close points of the current candle. Below I've explained it through the formula.

Image Created by Adobe PS

We can use this Heikin-Ashi Candles technique to explore any type of chart. Here I've selected https://www.tradingview.com to demonstrate it.
First of all, we can select Heikin-Ashi Candles from the top tool panel. We can click on the candles icon and select Heikin-Ashi from the given list. Check the below-attached screenshot to get an idea.
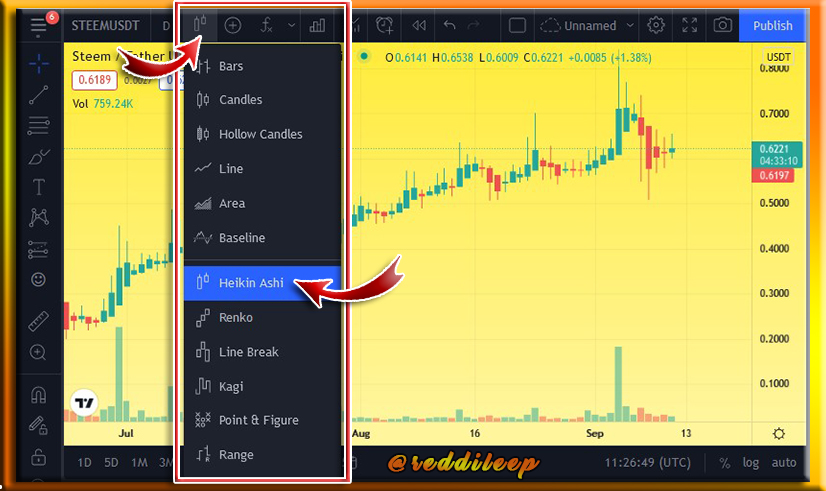
Screenshot was taken by https://tradingview.com
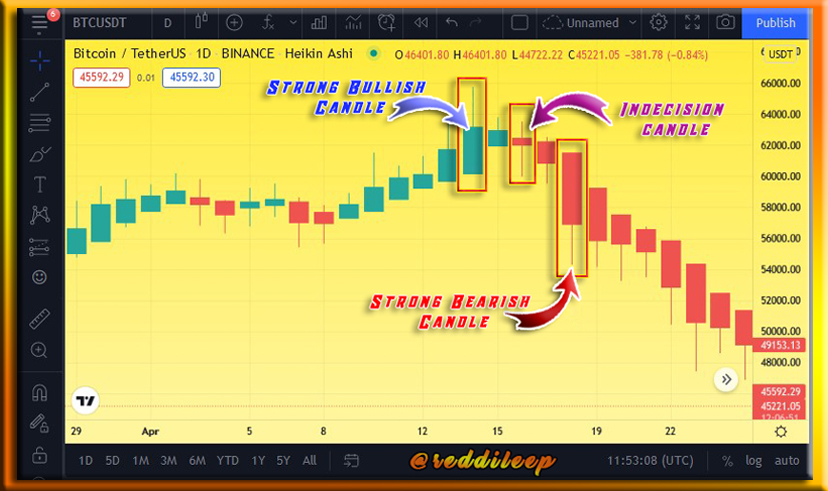
Here the trend is much easier to spot on Heikin-Ashi Candles charts than on traditional candle charts. Below we can clearly see the appearance of the Strong Bullish Candle, Strong Bearish Candle and the Indecision Candle. If we closely look at the candles, we can see there is an upper wick to the Strong Bullish Candle and the Strong Bearish Candle is consist of a lower wick. At the same time, we can see wicks on both sides in an Indecision Candle. So this indecision candle often comes after a continuous uptrend or a continuous downtrend. So this means that the trend will change or the trend will be somewhat paused.
Screenshot was taken by https://tradingview.com

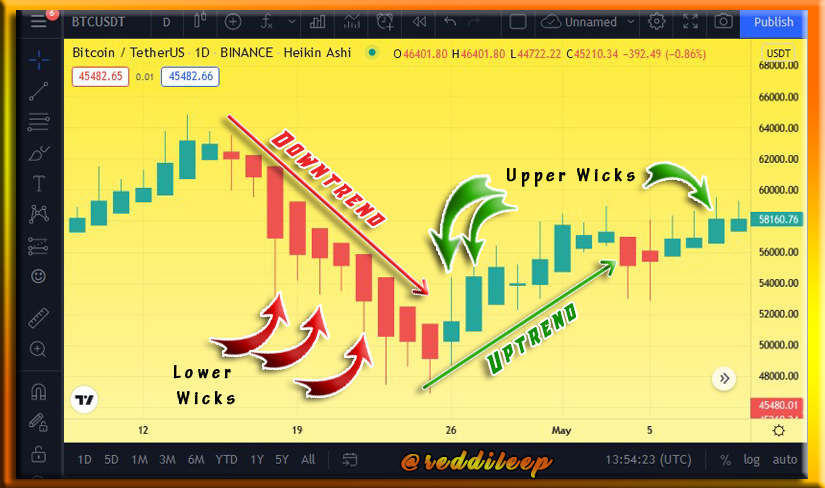
As I described earlier, we can easily identify the trend of the market using these Heikin-Ashi Candles. If we can see the candles with the wick above the candle, the market can often be called an uptrend market. At the same time, if we can see the candles with the wick below the candle, the market can often be called a downtrend market. That is, the type of candle does not change except for a clear change in the market. Below I've attached a screenshot to get an idea of the explanation.
Screenshot was taken by https://tradingview.com
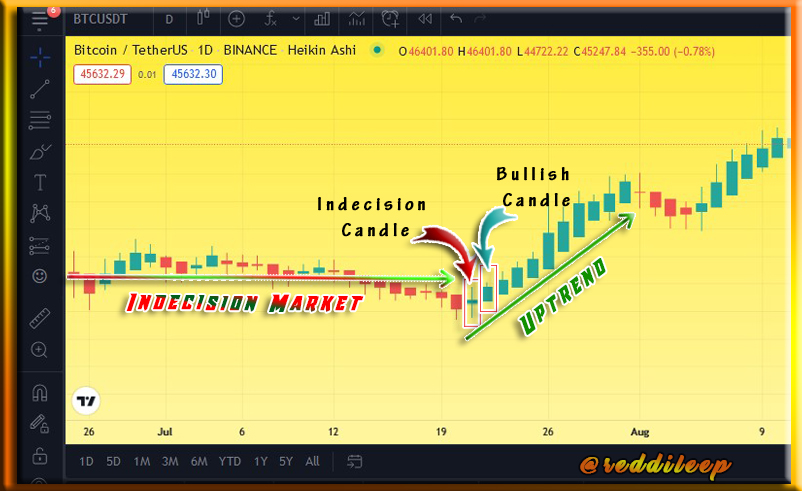
Furthermore, if the market moves indecisively and a clear bullish Heikin-Ashi candle opens at a certain level, we can use it as a buy signal. At the same time, if the market moves indecisively and a clear bearish Heikin-Ashi candle opens at a certain level, we can use it as a sell signal. It should be noted that none of these indicators are 100 percent successful and the market behaviour can happen unexpectedly at any moment. However, if we use more indicators such as 55-EMA and 21-EMA, we can increase the effectiveness of the received signals. I've discussed that further in the next subtopic. Below I've attached a screenshot to get an idea of the explanation.
Screenshot was taken by https://tradingview.com

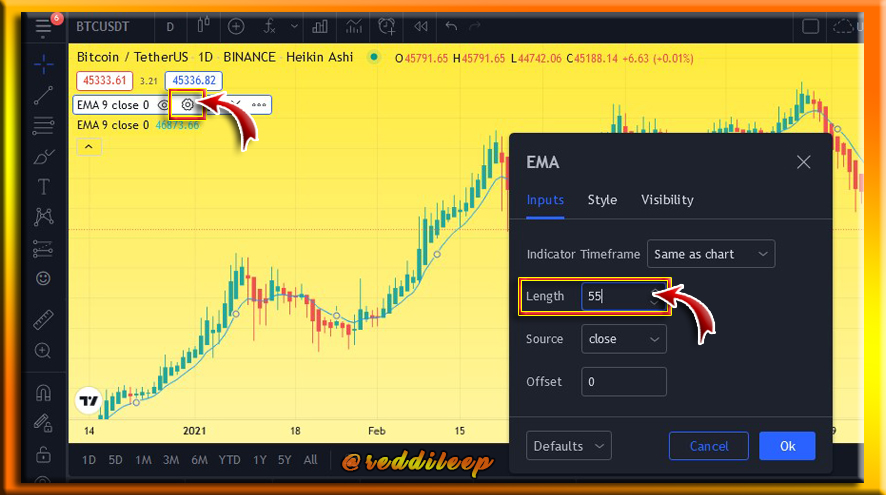
In cryptocurrency trading, we can increase the accuracy of our signals by adding more indicators than just using a single indicator. So, Exponential Moving Average (EMA) is a better indicator that we can use with another indicator. Out of these, 55-EMA and 21-EMA are the most commonly used in Exponential Moving Averages. Therefore, below I've clearly explained how to add this to the chart and how to use it.
Here I've used the https://www.tradingview.com platform to demonstrate it. Alternatively, you can use any platform such as Binance, Coinigy and MT-4. First of all, we can add 55-EMA and 21-EMA to the chart by using the Indicators and Strategies icon.
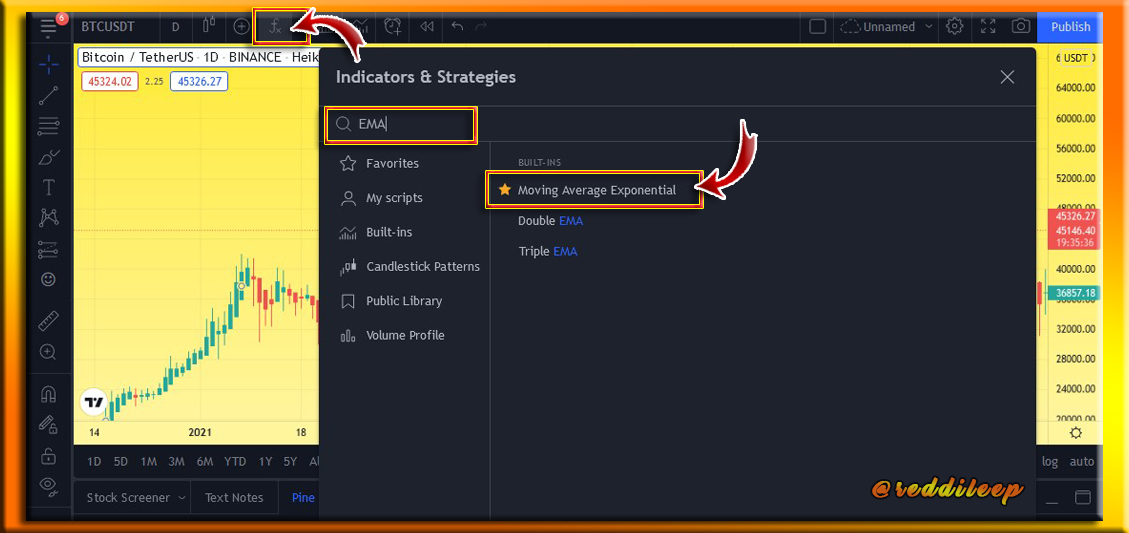
We have to click twice as we need two EMA lines in the chart. Then we can change its length according to our needs. However, I will not explain the most basic steps in my lesson as we have already discussed EMAs in beginner courses.
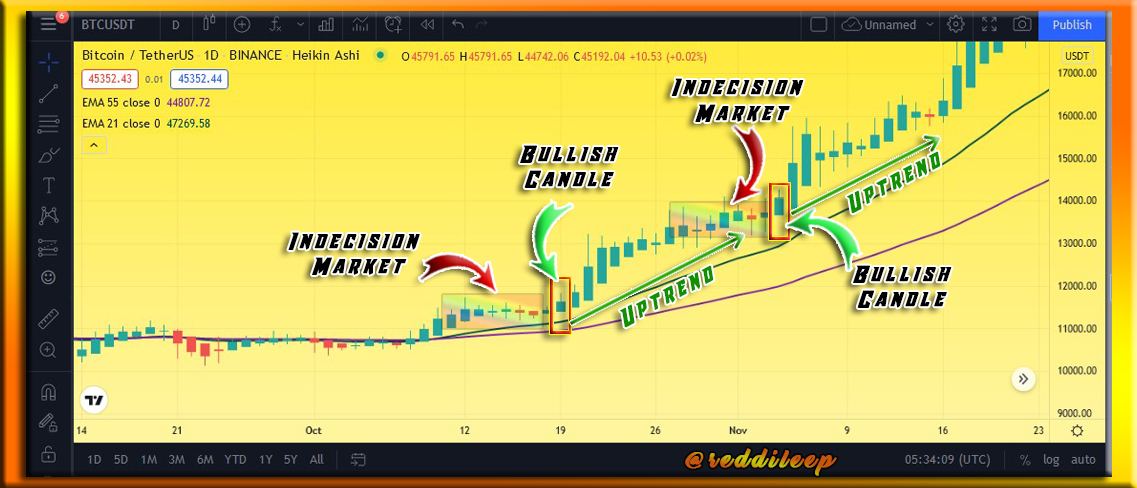
If we often see the market above 55-EMA and 21-EMA, there is a possibility of opening buying position. So in this case if the market is indecisive and a strong bullish candle opens, it can be taken as a buy signal. I have outlined a few such instances below.
Screenshot was taken by https://tradingview.com
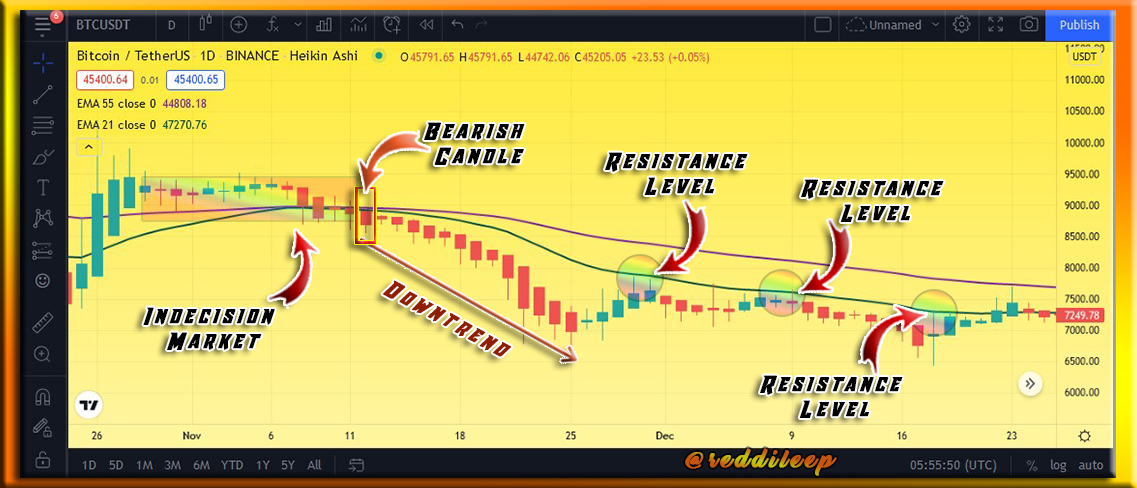
On the other side of it, if we often see the market below 55-EMA and 21-EMA, there is a possibility of opening selling positions. So in this case, if the market is indecisive and a strong bearish candle opens, it can be taken as a sell signal. (It is important to remember that this may not always be the case) And also, most of the time, these EMAs are working as support and resistance levels. So with the help of them, we can easily identify stop loss points and entry points.
Screenshot was taken by https://tradingview.com

In summary, Heikin-Ashi Technique can be defined as a useful alternative to traditional candle charts. So, if we are able to analyze both types of charts with additional indicators such as MAs and EMAs, we can get better results. However, according to the method I explained today, we increase the accuracy of the signals received at higher time frames than when using lower frames. At the same time, it is important to remember that trading in cryptocurrencies is extremely risky and trading without any experience can ruin all the investments.

In my lesson, I have described only a summary of these topics and you should do better research and answer all the following questions in your own words. Specially, you have to provide screenshots through your own charts without including sourced images.
1- Define Heikin-Ashi Technique in your own words.
2- Make your own research and differentiate between the traditional candlestick chart and the Heikin-Ashi chart. (Screenshots required from both chart patterns)
3- Explain the Heikin-Ashi Formula. (In addition to simply stating the formula, you should provide a clear explanation about the calculation)
4- Graphically explain trends and buying opportunities through Heikin-Ashi Candles. (Screenshots required)
5- Is it possible to transact only with signals received using the Heikin-Ashi Technique? Explain the reasons for your answer.
6- By using a Demo account, perform both Buy and Sell orders using Heikin-Ashi+ 55 EMA+21 EMA.

You must submit your Homework Posts in the Steemit Crypto Academy community.
You have to include all the details in your own words without including someone's words in your content. The concept can be the same but your content should be unique.
You must include at least 500 words in your homework posts.
Plagiarism is strictly prohibited in the whole Steemit platform and you will not receive any privileges.
All the screenshots and images should be fully referenced and the referenced images should be copyright-free. And also, include your user name as a watermark in every screenshot.
You should use tags #reddileep-s4week2 #cryptoacademy and your country tag among the first five tags. Furthermore, you can include relevant tags such as #heikin-ashi, #trading-strategy.
Your homework Title should be
[Heikin-Ashi Trading Strategy]-Steemit Crypto Academy | S4W2 | Homework Post for @reddileepHomework task will run from Sunday 00:00 September 12th to Saturday 11:59 pm September 18th UTC Time.
If you have a reputation of 60 or above, and a minimum SP of 400, then you are eligible to partake in this Task. (You must not be powering it down and your effective SP should not be delegated-in SP) And also, if you have used any buying vote services to build your reputation, you will not be eligible to partake in this Task.
If you didn't receive the score for your homework post within 48 hours, you can put the link in the comment section. Otherwise, don't leave your post link here.
If you have any queries related to my lesson, you are totally free to ask anything in the comment section.
Cc:
Hello professor, I congratulate you on your new role, and I can say you delivered your first lectures excellently. I enjoyed reading the piece, and it's very clear and understandable. Thanks prof
Thank you. 👍
Woow extremely beautiful lessons profesor. I have never known about this trading technique but after going through your lessons, I have learned alot about the Heikin-Ashi technique and I think it's very simple when using the technique in Trading
Thank you. 👍
This is a great lecture presented with creativity. Kudos! Prof. @reddileep
Thank you mate 👍
Good lecture, professor @reddileep. Keep this up
Thank you 👍
Hi @reddileep could you please recheck my ARTICLE
Actually, we are unable to help you regarding this matter. You can try this week though. But strictly remember all the rules.
Thank you
No problem :-(
Very explicit lecture sir. In Question 1 sir
Are we to Explain Hiekin-Ashi as a chart or we are to come up with a technique with hiekin-ashi and explain ? i await your clarification sir . Thank you @reddileep
You can explain it as a technique. So we already know that this technology is associated with charts. Actually, you can mention things like what this technology is and its importance here.
You can ask if you have anything else to know.
Thanks
Thanks
Profesor @reddileep, tengo una duda que me gustaría aclarar.
Quiero hacer una delegación de SP a la comunidad latina, ¿si mi SP llega a ser menos de 400 después de la delegación (200 en billetera y 600 delegados) puede seguir siendo elegible para las tareas intermedias?
Of course you are still eligible
Okey, muchas gracias.
.
Always follow the guidelines. Your homework post will be reviewed within 48hours. If not, just submit it here. Thank you
I'm sorry about that, It has been removed.
No problem mate. Just remember it in your mind 😎
Respected Sir @reddileep! please verify My Achievement 2.
https://steemit.com/hive-172186/@hamidsaqi/achievement-2-hamidsaqi-task-basic-security-on-steem
Please don't put your achievement links here. This section is only for Crypto Academy For homework submitters.
I'm so sorry sir @reddileep I did not know about it.
Please verify my achievement1 post
https://steemit.com/hive-172186/@sors/my-introductory-post-achievement1
Please don't put your achivement links here. This section is only for Crypto Academy For homework submitters.