Crypto Academy Season 6 Week 2 - Crypto Trading with Price Action.


Hello Steemians, I welcome you all to the 2nd week of Season 6 in the Steemit Crypto Academy. This is my first lesson for this season and it's my pleasure to be your teacher in crypto trading. In the previous seasons, we mainly focused on introductory courses for beginners. The previous studies focused on technical analysis to prepare the users to trade effectively in the crypto market. In this season's courses, we will focus on crypto trading professional courses and trading strategies in the crypto market.
Trading is made up of two kinds of players. The smart money who are the big banks and hedge funds investors manipulating the market to generate liquidity for their positions because of the volume of their transactions. Then we have the confused retail traders like me and you who don't know what we are doing. Why I used the word confused is that we always follow price to any direction the smart money manipulates to and most times we end up falling for their trap. We are not only fighting the market, we are also fighting against price manipulation.
As retail traders, we mainly forecast and predict the direction of the market to make a profit. This can be very difficult and requires a lot of expertise in both technical and fundamental analysis. To be able to know what's currently happening in the market, we look back to the historical price movement to understand the present.
Study shows that price movements are a result of the emotions and psychology of traders which are represented on the chart. This gives rise to our topic today which is Price action. Price action enables us to understand the present market condition by looking at historical price movement. Only then we can be able to predict the direction of the market to make a profit.
Understanding Price Action
Most traders rely on fundamental analysis to make trading decisions in the market. Fundamental analysis indeed causes the major price movement in the market. The problem with fundamental analysis is that it doesn't reveal key price information to traders such as areas of high demand and supply, risk management, and also the psychology of traders.
Price action traders believe that everything they need to know about the market and price movement is already discounted in price. For this reason, studying past price and chart patterns is utilized in making trading decisions. Price action entails the use of chart patterns, support, and resistance, volumes, market structures, technical indicators to predict the direction of price.
Price movement is a result of the emotions and psychology of traders which is discounted on price and can be seen on the chart. Price action traders study historical chart patterns and previous price movements. It is assumed that price will react the way when these patterns unfold in the market. A good example is the formation of the double top pattern on the chart which signals a bearish trend reversal. There's high selling pressure when a double top appears on the chart and this is triggered by the emotions of traders based on previous information on the chart pattern.
Also, with price action, we can be able to develop a good trading plan with proper risk management based on the information we have on the chart. Price actions enable to spot entry and exit opportunities on the chart. A good example is placing a buy order after a break of resistance and targeting the nearest resistance as a profit. The next resistance is targeted with the assumption that selling pressure is expected to enter the market at this point. Stoploss for such trade can be placed below the broken resistance. These are wonderful ways price action helps us to make good decisions in the market.
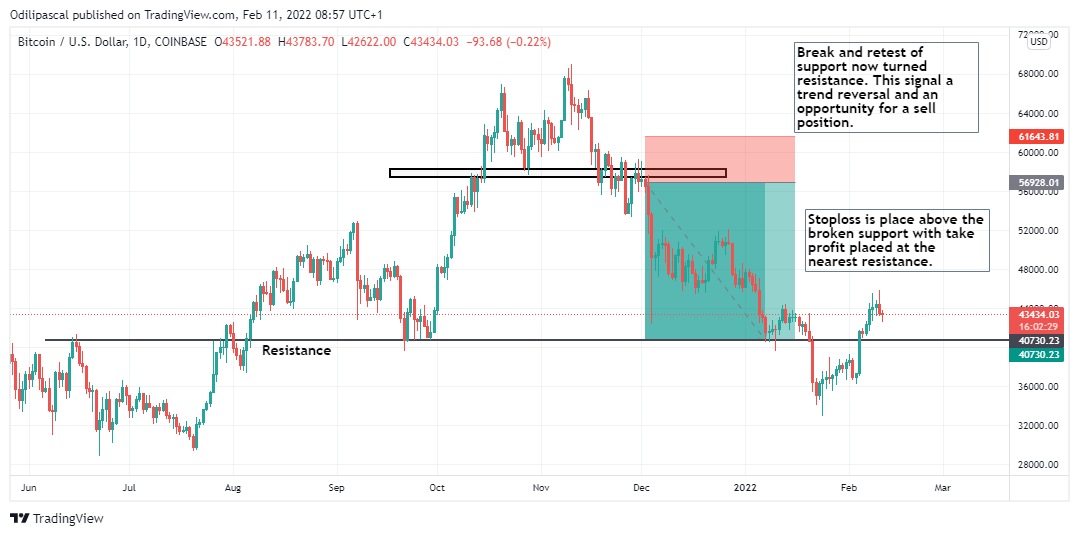
The image above shows a good example of price action. Here we have identified a break of market structure to determine a trend reversal. We have also executed a sell trade for this signal using proper risk management positions on the chart.
The crypto market is affected by fundamental factors which cause high volatility in the market. As a price action trader, it is required that you pay attention to the fundamental factors as it mostly affects the market. Remember that the price action will not save you from high-impact news. The market can go in any direction and major impact news can liquidate your positions. Always keep an eye on the news as a price action trader.
Why Price Action
In this section, let's look at the reasons why trading price action is important in today's market.
Understanding the Structure of the Market
Price action helps us to understand the structure of the market with a glance at the chart. It is very difficult to predict the direction of price. But with price action, we can be able to identify key price information. We can identify the current market trend, we can identify and spot trend reversals and we can also identify areas of high demand and supply (support and resistance). This can help us to predict the next price movement and the extent price can move in the future.
Reflection of Traders Emotion and Psychology
Price action helps to reveal traders' emotions and psychology and this is represented with the formation chart patterns. By understanding the emotions of traders using patterns on the chart, we can be able to predict what the price will do next. As I explained in the previous section, the collective traders' emotions and psychology can be seen in a double top formation. That's why we always see price reversal after a double top formation on the chart.
Price Action filters Noise and False Signals
The market is mostly manipulated by the big players which causes the price to deviate from the original trend. Also, technical indicators are prone to false signals as they rely on the historical price data point for signals. These indicators can be lagging behind the current price or leading price. Price action helps to filter these false signals by revealing the current price movement in the market. Also, during the ranging market (dull price movement), price action helps to remove the filter the noise that comes along with this market condition.
These noises can confuse a trader to understand the current market trend. The best way to filter the noise in the market is the use of Multi-timeframe analysis which we are going to discuss in the next section of this lesson.
Price action can be applied to any market and any trading strategy. It gives you the confidence to trade with an edge. It will give you a signal to wait for the right trade setup to enter and exit the market.
Candlestick Chart as an important Price Action Tool
What moves the market is the forces of supply and demand. If the demand is higher than supply, then the price will go up. On the other hand, if the supply exceeds the demand then the price will decline. These forces of demand and supply can be represented on the chart.
The charts help to visualize the interaction between buyers and sellers in the market. The chart helps us to identify areas of high demand and supply of previous price movement and this can help us to identify support and resistance levels on the chart. There are so many types of charts in the financial market and these include:
- Line chart.
- Candlestick chart.
- Bar chart.
- Hollow chart.
- Heikin Ashi chart etc.
The candlestick chart is the most commonly used in the financial market today. The candlestick chart is preferred over other charts because it also helps to visualize the human behaviors and psychology of traders on the chart. The candlestick charts display the forces of demand and supply of an asset over some time.
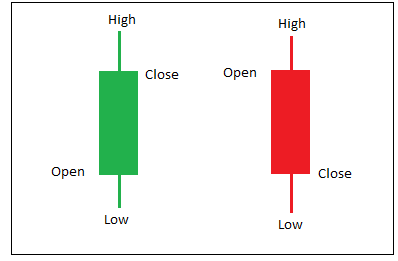
The color of the candles determines if the price of the asset increased or decreased over a specified period. The default color for a bullish candlestick is green while the default color for a bearish candlestick is red. This color can be customized by the trader.
When the candlestick is bullish, it simply means that the price is closed above the open of the candle. Similarly, the candlestick is bearish, which means that the price is closed below the open of the candle. With this information, traders can determine which side of the market is in control of the price.
Furthermore, the momentum of demand and supply can also be determined using the length of the candlestick body and its wick. Understand that every candlestick formed tells a story of the buying and selling pressure over some time.
The candlestick patterns are strong price action signals especially when they are formed at support and resistance areas. The formation of a bullish engulfing candlestick at a support level signals a bullish price reversal. Similarly, when the inverted hammer candlestick is formed at a resistance level, it signals a bearish price reversal. We are not discussing candlestick patterns in this lesson, we are trying to establish the candlestick chart as an important price action tool.
Understanding Multi-timeframe Analysis
In the previous section, we explained how we can cancel out noise in the market using multi-timeframe analysis. There is still another importance of multi-timeframe analysis which we will discuss in this section.
In order not to lose key price setups, areas of support, and resistance on the chart, and also to have proper risk management positions, multi-timeframe analysis plays a crucial role in our trading today and many professional traders use this to make good trading decisions.
In a multi-time frame, we look at a currency pair in different timeframes to have clear information on the current price. In multi-timeframe analysis, the higher timeframes can be used to determine the direction of the market while the lower timeframes can be used for entries to get a tighter stop loss position. Below are the three main reasons why multi-timeframe is very important.
To Cancel out noise in the market
Sometimes, looking at the chart we find it difficult to understand what is going on in the market. The formation of the candlesticks won't be in any clear pattern and this will make it difficult for a trader to predict the direction of the market. In situations like this, a trader can apply multi-timeframe analysis to understand this price condition in both either lower or higher timeframes.
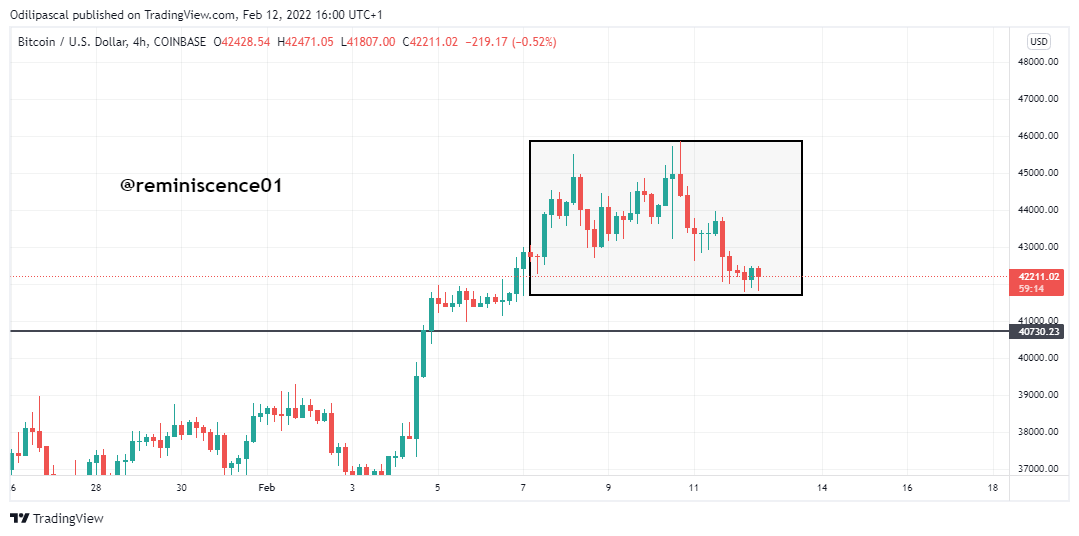
Looking at the BTC/USD 4hour chart above, we can see the indecisions in determining the direction of the market. The candlestick formations can't reveal any clear pattern to signal of price going up or down. In such cases, we will switch to the daily timeframe to cancel out this noise and have a clear picture of the direction of price.
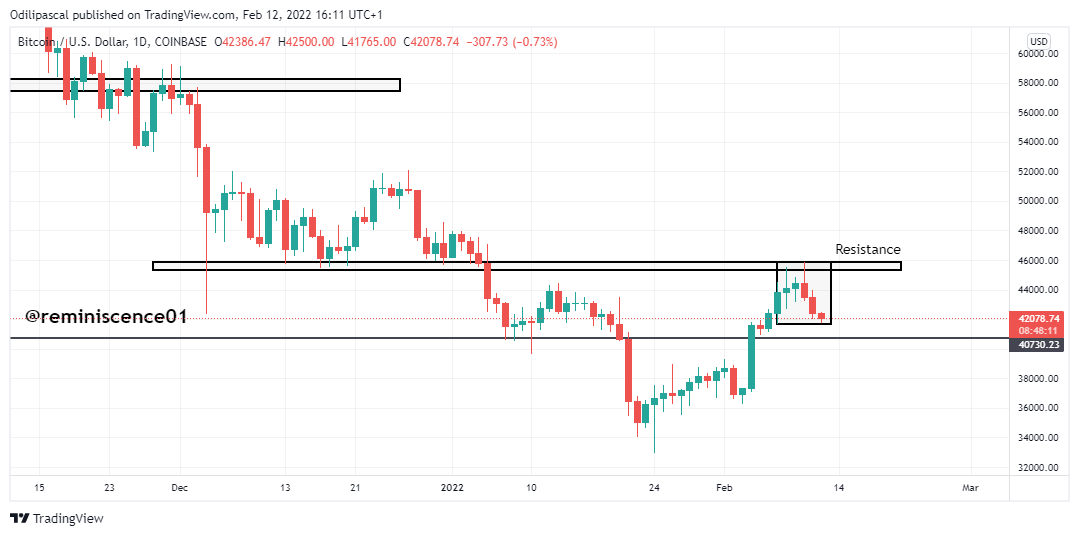
Looking at the Dialy chart of the same BTC/USD, we can see that there is clear information on the daily chart, and all the noise in the 4hours chart has been canceled. Furthermore, we can also see that we have a clear picture of the direction of the market on the daily chart. Looking at the daily chart, we can see that prices have been rejected at resistance to continue the bearish trend. Some traders go as far as the monthly chart, weekly charts to understand the overall market trend. But this will depend on the type of trader you are.
Now that we have a clear picture of market direction, we can now comfortably look for an entry in the direction of the market. If we consider placing an entry using the daily timeframe, we will probably have an entry after the bearish inverted hammer candlestick. This means that our stop loss will be placed above the resistance.
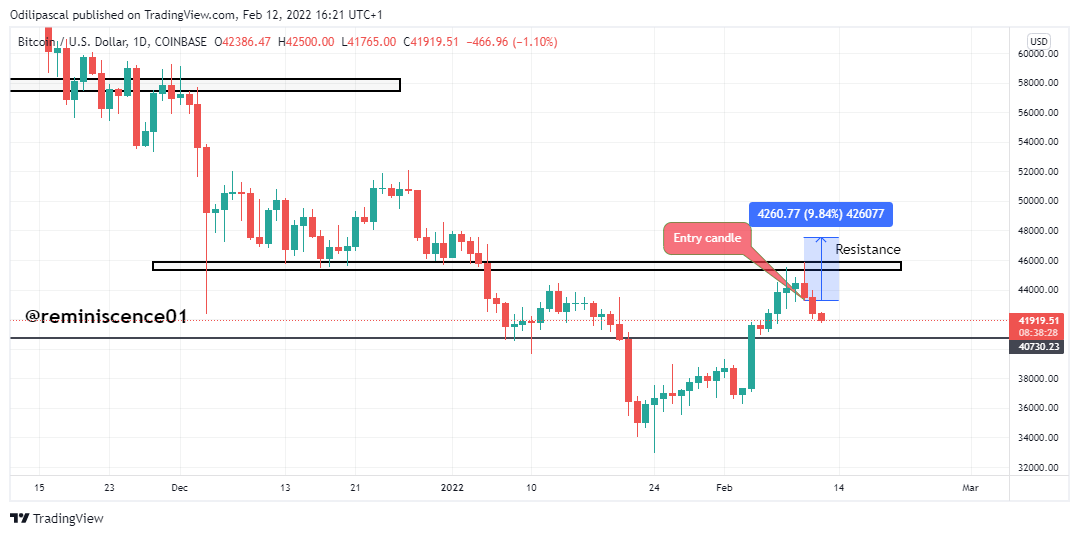
Looking at the chart above, assuming that we placed a sell entry after the bearish inverted hammer, we will have a massive stop loss of about 426 points. For this reason, we can go back to a lower timeframe to get an entry position.
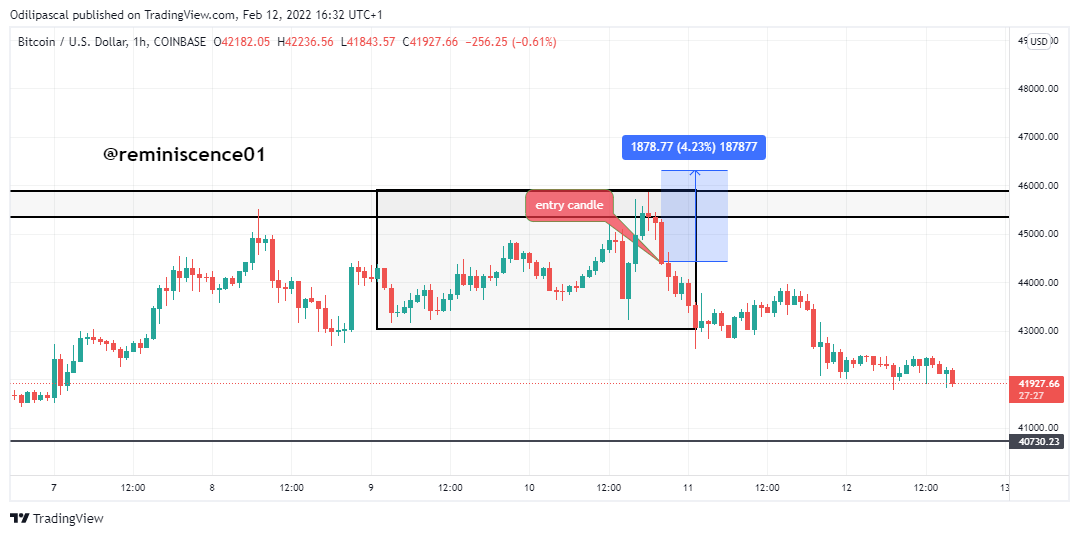
The chart above shows the 1hour chart of the same currency pair (BTC/USD). We can see that we have a better entry on this timeframe and also a tighter stop loss. On the daily chart, we have a stop loss of 42 points. Switching to the 1hour timeframe, we have a better entry position with a tighter stop loss of 18 points.
We can still get a tighter stop loss if we go down to a lower timeframe. This time around, let's look at the 15mins chart for the same trade setup on BTC/USD.
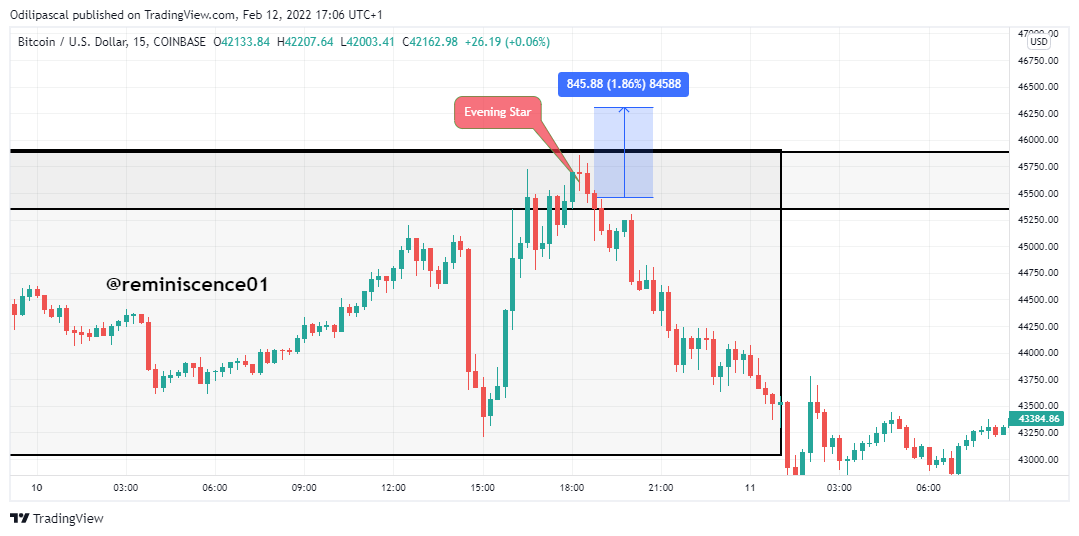
On the 15mins timeframe, we can spot an evening start candlestick pattern which is a bearish trend reversal signal. Now taking a selling trader based on that, we can see that we have a better entry position than the daily and 4hour chart. Here, we have an early entry for this position which helps to tighten our stop loss to 8 points.
Multi-timeframe analysis plays a major role in our trading journey which we have seen in the examples above. It helps us to get a better entry and also to tighten our stop loss position. This analysis can be done and trade setups can be spotted using the higher timeframes like the Weekly, Daily, and 4hr timeframes. The lower timeframes like the 30mins, 15mins can be used to get a good entry after the setup has formed on the higher timeframe.
Understand that the timeframe to apply depends on the type of trader and your trading strategy. A swing trader will focus on monthly, weekly, and daily charts for trade setups. Then he can go down to 4hr and 1hr charts to look for good entries. Similarly, a scalper will focus on the 1hour, 30mins, and 15mins for trade setups. Then he can go down to 5mins and 1min charts for entry positions.
Conclusion
In this study, we have explained price action as an important technical analysis tool. Price actions reveal the psychology and emotions of traders in the market which can be spotted on the chart using candlestick chart patterns, support, resistance, trend lines, etc. We have also discussed the Japanese candlestick chart which is also an important price action tool. The candlestick formation also reveals the interaction between buyers and sellers over a defined period. This can also help to determine the momentum in price using the candlestick body and the wick.
Multi-timeframe analysis plays a major role in filtering noise in the market. This analysis can also be applied in obtaining a good entry into the market. As a cryptocurrency trader, it is required you understand the factors that move the market and also the necessary tools to be able to predict the market direction correctly. Most importantly, understand the kind of market and design a strategy with the information you have.
Thank you for being part of this lesson.
Homework Task
- Explain your understanding of price action.
- What is the importance of price action? Will, you chose any other form of technical analysis apart from price action? Give reasons for your answer.
- Explain the Japanese candlestick chart and its importance in technical analysis. Would you prefer any other technical chart apart from the candlestick chart?
- What do you understand by multi-timeframe analysis? State the importance of multi-timeframe analysis.
- With the aid of a crypto chart, explain how we can get a better entry position and tight stop loss using multi-timeframe analysis. You can use any timeframe of your choice.
- Carry out a multi-timeframe analysis on any crypto pair identifying support and resistance levels. Execute a buy or sell order using any demo account. (Explain your entry and exit strategies. Also, show proof of transaction).
Homework Guidelines
- Homework must be posted in the Steemit Crypto Academy community. Your homework title format should be " [Your Title] - Crypto Academy / S6W2- Homework Post for @reminiscence01".
- Plagiarism is a great offense in Steemit Crypto Academy and it won’t be tolerated. Ensure you refrain from any form of plagiarism.
- Your post should not contain less than 400 words.
- All images, graphs, and screenshots from external sources should be fully referenced, and ensure to use watermark with your username on your screenshots.
- Use the tag #reminiscence01-s6week2, #cryptoacademy, #club5050, #club75, #club100 if eligible and your country tag among the first five tags. Also include other relevant tags like #priceaction, #trading #cryptocurrency.
- Only users who meet the requirements for #club5050 are eligible to participate in this homework task.
- Homework task run from Sunday 00:00 February 13th, 2022 to Saturday 11:59 pm February 19th, 2022 UTC Time.
- Only users with a minimum of 250 SP and having a minimum reputation of 60 are eligible to perform this homework. Also, note that you must not be powered down.
- Users who have used upvote tools to gain SP or build their reputation are not eligible for this homework.
Note: You can only drop your homework link in the comment section if not reviewed after 48 hours.
The comment section is freely opened for suggestions and feedback on the lesson and homework.
Cc: @steemitblog
This was an Excellent lesson professor.
Thank you.
Nice topic Prof! Will get on it soon
Thank you. Looking forward to your submission.
This is a great lecture professor. Let me start right away to do my homework post.
Great homework post 👍
The lesson was unique and awesome. Thank you professor @reminiscence01
Woow beautiful lesson on trading with price action professor
Thank you. I hope to see your submission.
Amazing lesson, professor. Thanks for it. Can I participate?
I have gone through your account. You met the reputation and sp requirements. Also, i noticed you haven't earned any reward in the last 3months. Kindly power up any little amount of steem to be eligible for #club5050. Only then you can participate in the homework task.
Thanks, professor. So, it can be any amount, isn't it? Not a specific amount
Yes, maybe 10 steem or 20 steem.
I powered up 20 steem, so I'll post my homework soon, thanks professor!
Hello prof, good day, i having problems switching time frames. When ever i switch to lower ones, I can't find my marked spot in the higher time frame. Please how do you do that on trading view?
Thanks
It is there. You just have to zoom in to see it. Remember the lower times requires a lot of chart space. A marked spot on the daily can take scrolling back to find the spot on the 15mins chart.