Trading with Contractile Diagonals - Steemit Crypto Academy / S4W3 - Homework Post for Professor @allbert
Hello everybody, Hope you all are fine and in good health!
My this post is a Homework Task assigned by professor @allbert which is about Trading with Contractile Diagonals

1) Define in your own words what a contractile diagonal is and why it is important to study it. Explain what happens in the market for this chart pattern to occur. (screenshot required / Bitcoin not allowed)
Contractile diagonals are cyclic patterns seen in the trading charts made by the price action. These are important strategies for traders who trade trend reversal patterns. A contractile diagonal chart pattern is demonstrated in the chart of BNB/USDT.
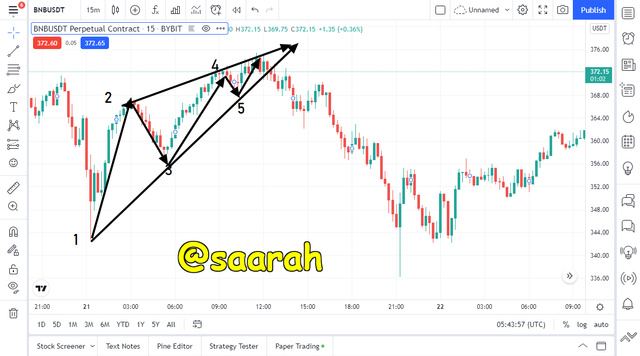
Here the points 1, 3, and 5 correspond to the main trend but the point 2 and 4 indicate price corrections like in the Elliot waves. The diagonal contractile patterns help in identifying trend reversals in the market. These patterns are easy to recognize and are drawn using the price contractions of an asset during a trend.
The price contractions or peaks are then joined to draw diagonals and waves. In a valid diagonal pattern we see that the structure forms in such a way that the two diagonals should meet at the end wave 5. This pattern is possible due to the wave-like motion of the price. The lines that join the peaks of the contractions are called the trend lines and function as support or resistance. The price can be seen to be bouncing between them.
The basis of the wedge is typically the execution of buy and sell orders and as the intensity of the selling or buying pressure changes so does the market structure and we see wedges being formed. Traders widely use this strategy to capitalize as it can predict some strongest reversal. The breakouts confirm these reversals. The wavelength of height of the wedges is impacted by volume of transactions in the corresponding trend. The decreasing wavelength corresponds to a decrease in volume and finally a reversal as the opposite side of the market takes control.

2) Give an example of a Contractile Diagonal that meets the criteria of operability and an example of a Contractile Diagonal that does NOT meet the criteria. (screenshot required / Bitcoin not allowed)
Contractile diagonals have to meet a set criterion to be called operative. A diagonal pattern following some standards is referred to as valid. The basic rule is that the pattern should converge indicating a decrease in the intensity of a trend due to decrease in the trading volume in support of the trend. In addition to that, the convergence pattern should be followed by a trend reversal.
The general rule is that in a valid pattern wave 1 will be longer than wave 3, wave 5 will be smaller than wave 3, and wave 2 will be longer than wave 4. The lines joining the pivots are called trend lines for the trend lines the valid standards are;
Out of the two one trend line should be touching pivots 1 and 3 and 5.The second trend line should be touching pivot 2 and point 4.the convergence of these trend lines should also not lie far away from point 5.
Contractile Diagonal that does not meet the criteria
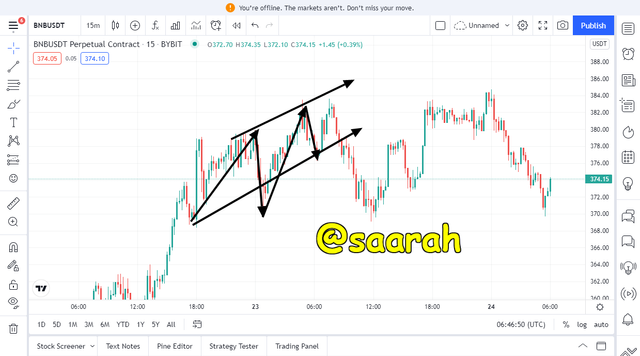
In the chart above we see an uptrend. We see bullish contractions but the waves do not follow the criteria. Wave 1 is smaller than wave 3. Also the successive pattern is not converging rather diverging and hence this contractile pattern does not follow the operability criteria. Another issue in the pattern above is that the main trend line is not combining the three pivots 1,3 and 5.
Contractile Diagonal that meets the criteria
In the BNB/USDT chart below we see a valid contractile pattern where all the standards of the operability are met. The successive waves are converging, the trend lines are meeting and making contact with the peaks of contraction and we also see a trend reversal after the convergence.
3) Through your Verified exchange account, perform one REAL buy operation (15 USD minimum), through the Contractile Diagonal method. Explain the process and demonstrate the results and graphical analysis through screenshots. Your purchase data must match your analysis data: such as cryptocurrency and entry price.
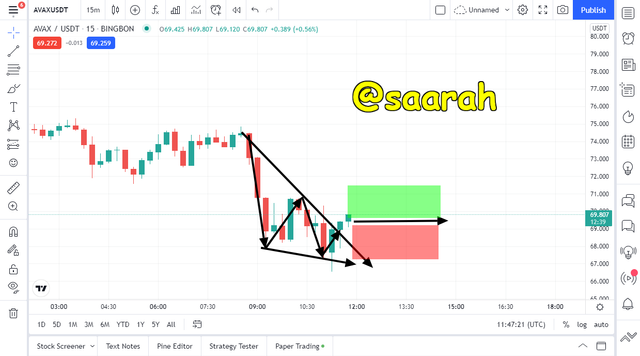
I performed trades in AVAX/USDT. When I entered the market was in a bearish trend and wave 5 was formed. I drew the contractile pattern confirming that it is a valid pattern. When I found that wave 1 is longer than wave 3 and the same is true for wave 2 and 4 and the trend lines are touching their corresponding points I executed the buy order. The stop loss and take profit were in the ratio 1:1 close to point 5 and 2 respectively.
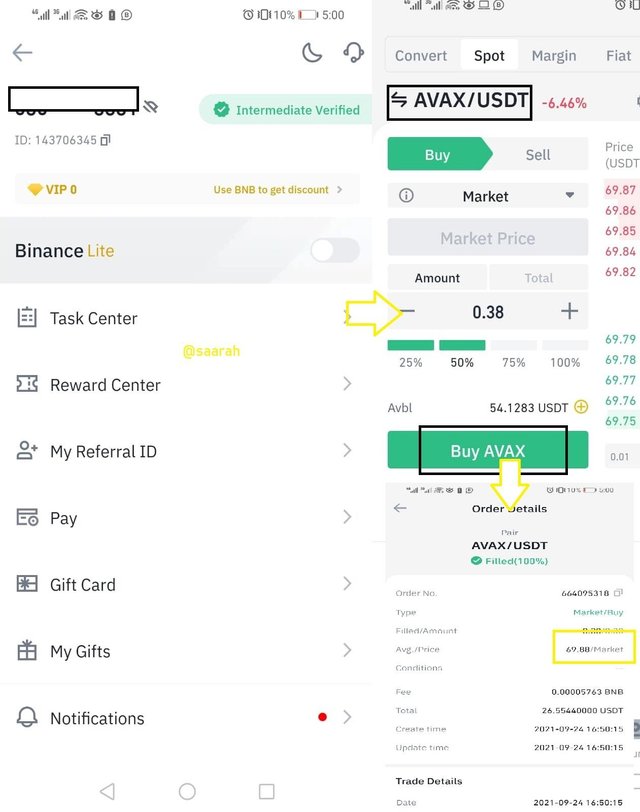
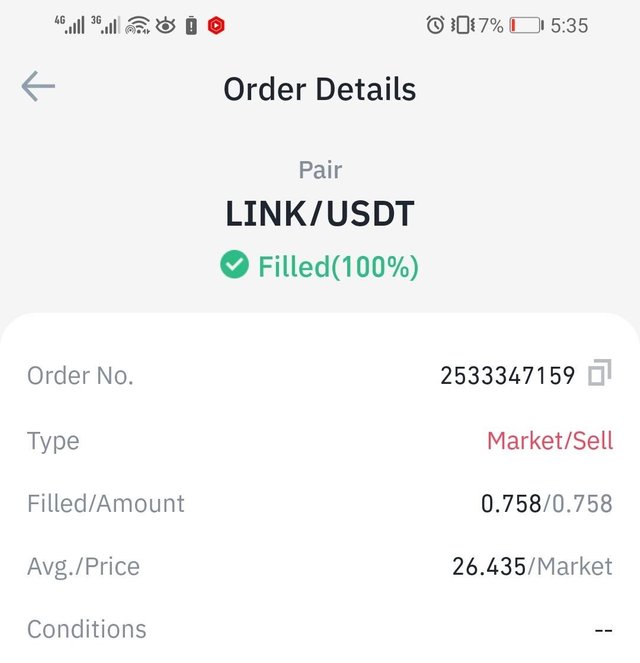
Below I have provided the screenshot of my verified account plus the order details.
4) Through a DEMO account, perform one sell operation, through the Contractile Diagonal method. Explain the process and demonstrate the results and graphical analysis through screenshots. Bitcoin is not allowed.
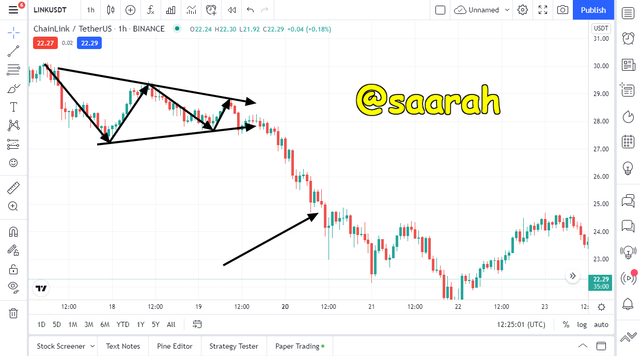
In the screenshot above we see the LINK/USDT chart. I saw a diagonal contractile forming. I traced it on the chart if it was valid. I waited for a breakout once the price action broke out I waited for it to retest. The candles retested and I placed the selling order (the black arrow is not correct) . The sell order was placed at the price of $26.435. The chart was traced later to the purchase. I am attaching the screenshot of the real trade.
5) Explain and develop why not all contractile diagonals are operative from a practical point of view. (screenshot required / Bitcoin not allowed)
All the diagonals in the market structure are not or always operative. The diagonal pattern is the visual representation of the decrease in selling or buying pressure and therefore wavelength gradually decreases. That is why we say that wave 3 is smaller than wave and the same is true for wave 2 and 4. An operable diagonal structure has its trend lines meeting the pivots of 1, 3, 5 from one side and 2 and 4 from the other side and it precedes a strong trend reversal.
All these requirements may not be present in all that contractile diagonals that may form. The trade setup should be such that the TP should be placed near point 2 and SP near the point 5.
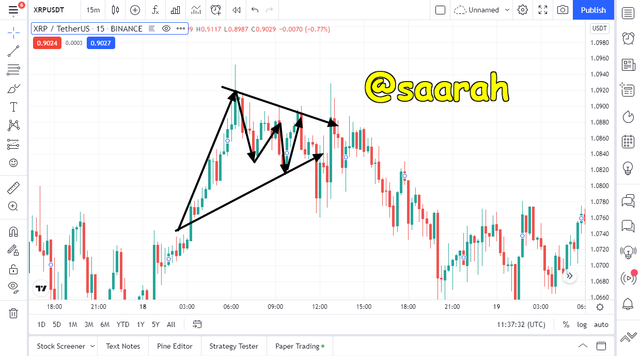
For example in the screenshot below we have the waves structure satisfying the operability criteria such that wave 1>wave 3 and wave 2> wave 4 but all points do not match. This setup thus does not satisfy the standards. This happens due to fluctuating trading volumes and trade executions drived by supply and demand.
Supply and demand have a major role to play in the market structure. If in a downtrend we have more supply than demand the price of the asset instead of decreasing will increase and this will affect the structure of diagonals. In this case the waves or the diagonals may follow the requirements and may converge but price after breakout even after bullish convergence will continue to move higher due to increased demand.
Conclusion
This week’s lecture on Diagonal pattern was very informative. I understood many new areas of the diagonal pattern especially when I was applying it on the chart I was better able to perform with it in the real trades. A lot of traders use this strategy for locating trend reversal patterns as it is quite easy to locate.