Crypto Academy Season 4 | Advanced course - Week 3: Onchain Metrics(Part-2)

Background
A public Blockchain is an immutable incorruptible, verifiable & auditable public ledger, and utilizing the Blockchain data one can leverage into the on-chain metrics to make it relatable with the price development of an underlying asset.
The price action may be an explicit thing, but the underlying microstructure of price action always takes cues from the on-chain metrics.
In Week-1, we discussed different on-chain metrics: Nos of Active Addresses & Nos of Transactions, HODL Wave & Age of a coin, Exchange inflow and Outflow, NVT Ratio, etc. This week(Week 3), we will deep dive into MVRV Ratio, Realized Cap, Market Cap, etc, and their interpretation wrt price action.
MVRV is a powerful on-chain metric that takes into account Realized cap wrt Market cap to portray the momentum in the market and displays the crests and troughs. The best part about this on-chain metric is that it's more accurate to decipher the long-term support and accumulation zone, most importantly the fair value of the coin/asset.
Different reliable sites for Onchain Data
The raw approach to obtain on-chain data is to run a node and extract and sample the data to identify a trend/pattern.
But since the birth of Bitcoin, we have already spent a decade in cryptos. So there are different sites/services available as of date to provide you the readymade on-chain data along with novel approaches to analyze it with a proven history.
List of reliable sites for onchain data
MVRV Ratio, Market Cap, Realized Cap
Before going into the details of the MVRV ratio, it is pertinent to understand the market cap & realized cap.
Market cap & Realized cap
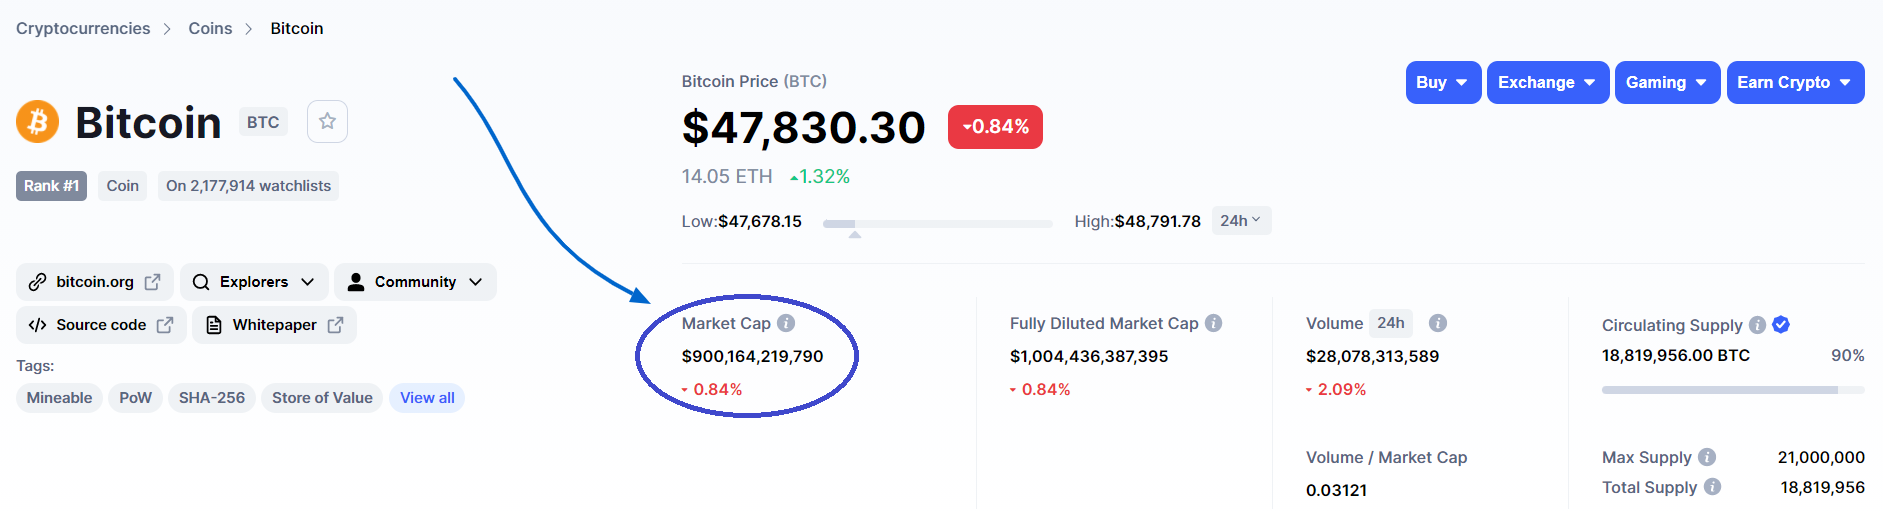
The price of an asset multiplied by the circulating supply of the cryptocurrency is known as the Market cap.
.png)
Source: Coinmarketcap
It is a quick and straightforward way to determine the size of an asset/network. It should not be looked upon as all the circulating supply can be liquidated at the given price, NO, because the perpetual supply to the extent of the entire circulating supply will have a colossal effect on the supply/demand dynamics, so the dynamics will keep on adjusting every second wrt supply.
Therefore, another variant of the Market cap, known as the Realized cap is introduced to give a more realistic figure to the size/valuation of the asset. When we talk about Realized cap in terms of crypto, then it also takes into account the dormant coin or the lost asset and their valuation at that time when they were last moved.
Example,
Let's say you bought BTC in the year 2018 for 4500 USD per coin. And since then you have not moved the asset. Today the price of the asset is 48000 USD per coin. Until you move(or sell) the asset, the realized price/tangible price of the asset will be considered as 4500 USD regardless of the actual price of the asset today or tomorrow.
Put simply, the realized cap takes into account the price of an asset on that particular day when UTXO was last moved.
The moment you sell it, (which means the UTXO will move into a new UTXO), the realized price will become 48000 USD(if you sell it or move it today). Just try to relate it with the floating profit or loss in a trade, unless you close a position, you can not realize a profit or loss.
So Marketcap is a contemporary approach whereas the Realized cap weighs on the actual trade that happened during a particular day and the actual price that was paid for the asset on that particular day.
Market cap ignores the time and space relative to coin/UTXO. If you calculate the Marketcap of Bitcoin, regardless of when the UTXO was last moved, regardless of what price you paid for BTC on that particular day during the last 10 years, it will simply project the size/valuation of the asset at the current price.
Realized cap takes into account the time and space relative to the coin/UTXO.

Source: Glassnode
Let's take the example of BTC, Let's assume BTC has 10 UTXO in total with a circulating supply of 10 BTC. Let's say 5 UTXOs have not moved since 2014(with the price as $200 on the day it was last moved), 2 UTXOs have not moved since 2017(with the price as $19,000 on the day it was last moved), 3 UTXOs have not moved since 2021(with the price as $60,000 on the day it was last moved)
Then the Realized cap= (5 * 200)+(2 * 19000)+(3*60000)= 2,76,000 USD.
If today the price of BTC is 48000 USD per coin, then the Market cap= 48000*10= 4,80,000 USD.
Every time a UTXO is moved, the Realized cap will go for a re-valuation and will reflect an increase or decrease with respect to the current price of the asset.
The lower the Realized cap wrt market cap, the better is the prospect of profitability, in other words, a user stands to make more from the store of value.
Now, both Market cap & Realized cap are applied to generate a metric called MVRV ratio to determine the fair value of the asset or network.
MVRV Ratio= Market Cap/Realized Cap
MVRV ratio tells about the average profit/loss in the market. And it is a suitable indicator to identify the top & bottom. If the MVRV is higher means the average profit in the market is more and that may signal an upcoming sell-off. Simillarly, a lower MVRV means either an accumulation zone or bottom. So the ideal practice is to buy the asset with a lower MVRV ratio and sell it at a higher MVRV ratio.
If the MVRV is equal to 1(or 100%), then you are at break-even.
If the MVRV is 2( or 200%), then the average profit in the market is 2X, which means if the holders will sell their coin at the current price, they will get 2X profit. Simillarly, MVRV= 3(or 300%) means average profit is 3X.
If the MVRV reading is between 0 and 1(or below 100%), then you will be at a loss if you sell at the current price.
Note- Here it tells about the average profit of the Hodlers, not the individual profit, individual profit may be much more than it.
How to read Market Cap, Realized Profit & MVRV Ratio?
Market cap higher than the Realized cap signifies profit, the more the MVRV ratio, more is the chances that the hodlers will realize their profit, and as a result, market may be likely to correct.
Market cap lower than realized cap only occurs during the bearish cycle and the MVRV ratio will signify either a bottom or accumulation zone for a certain period.
In a bullish market continuation, a higher MVRV ratio might trigger a sell-off, but once the latent sell pressure subsides, it resumes the uptrend again. So if MVRV corrects and bottoms out, then it is a buy signal again. (Most of the time, lower MVRV reading(less than 100%, in a bull market) hints at an upcoming support zone).
How to read Realized cap wrt to price action?
- If it is a strong bull market(cyclic trend), then there will be a steep gradient of the Realized cap.
- If the market trade sideways, and/or consolidates, then realized cap will follow a flat contour.
- If the market trades bearish(even in a bearish cycle with a strong downtrend), there won't be a steep decline in the realized cap. The reason being you can not undo the adoption rate in an ever-growing crypto market, and those who even have taken a position at the top hardly sell at the bottom, rather prefer to HODL, for that reason the contour of the realized cap in a bearish market follow a shallow downtrend, or remains flat.
How do I identify trends/patterns in a Market using MVRV?
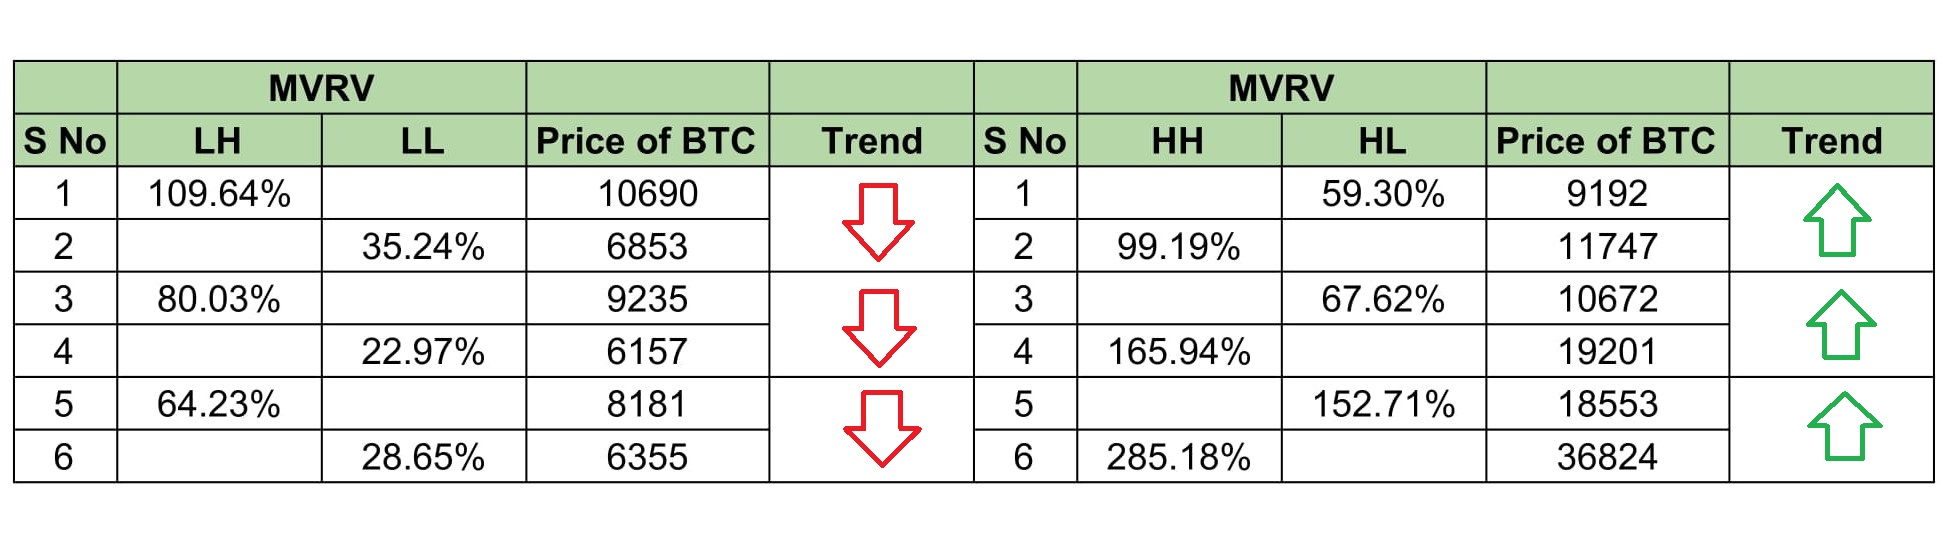
- If the MVRV ratio reads above 1(or more than 100%) and forms higher bottoms, then it signals a strong bullish market.
- If the MVRV ratio reads below 1(or less than 100%) and forms lower tops, then it signals a bearish or extended bearish market.
.png)
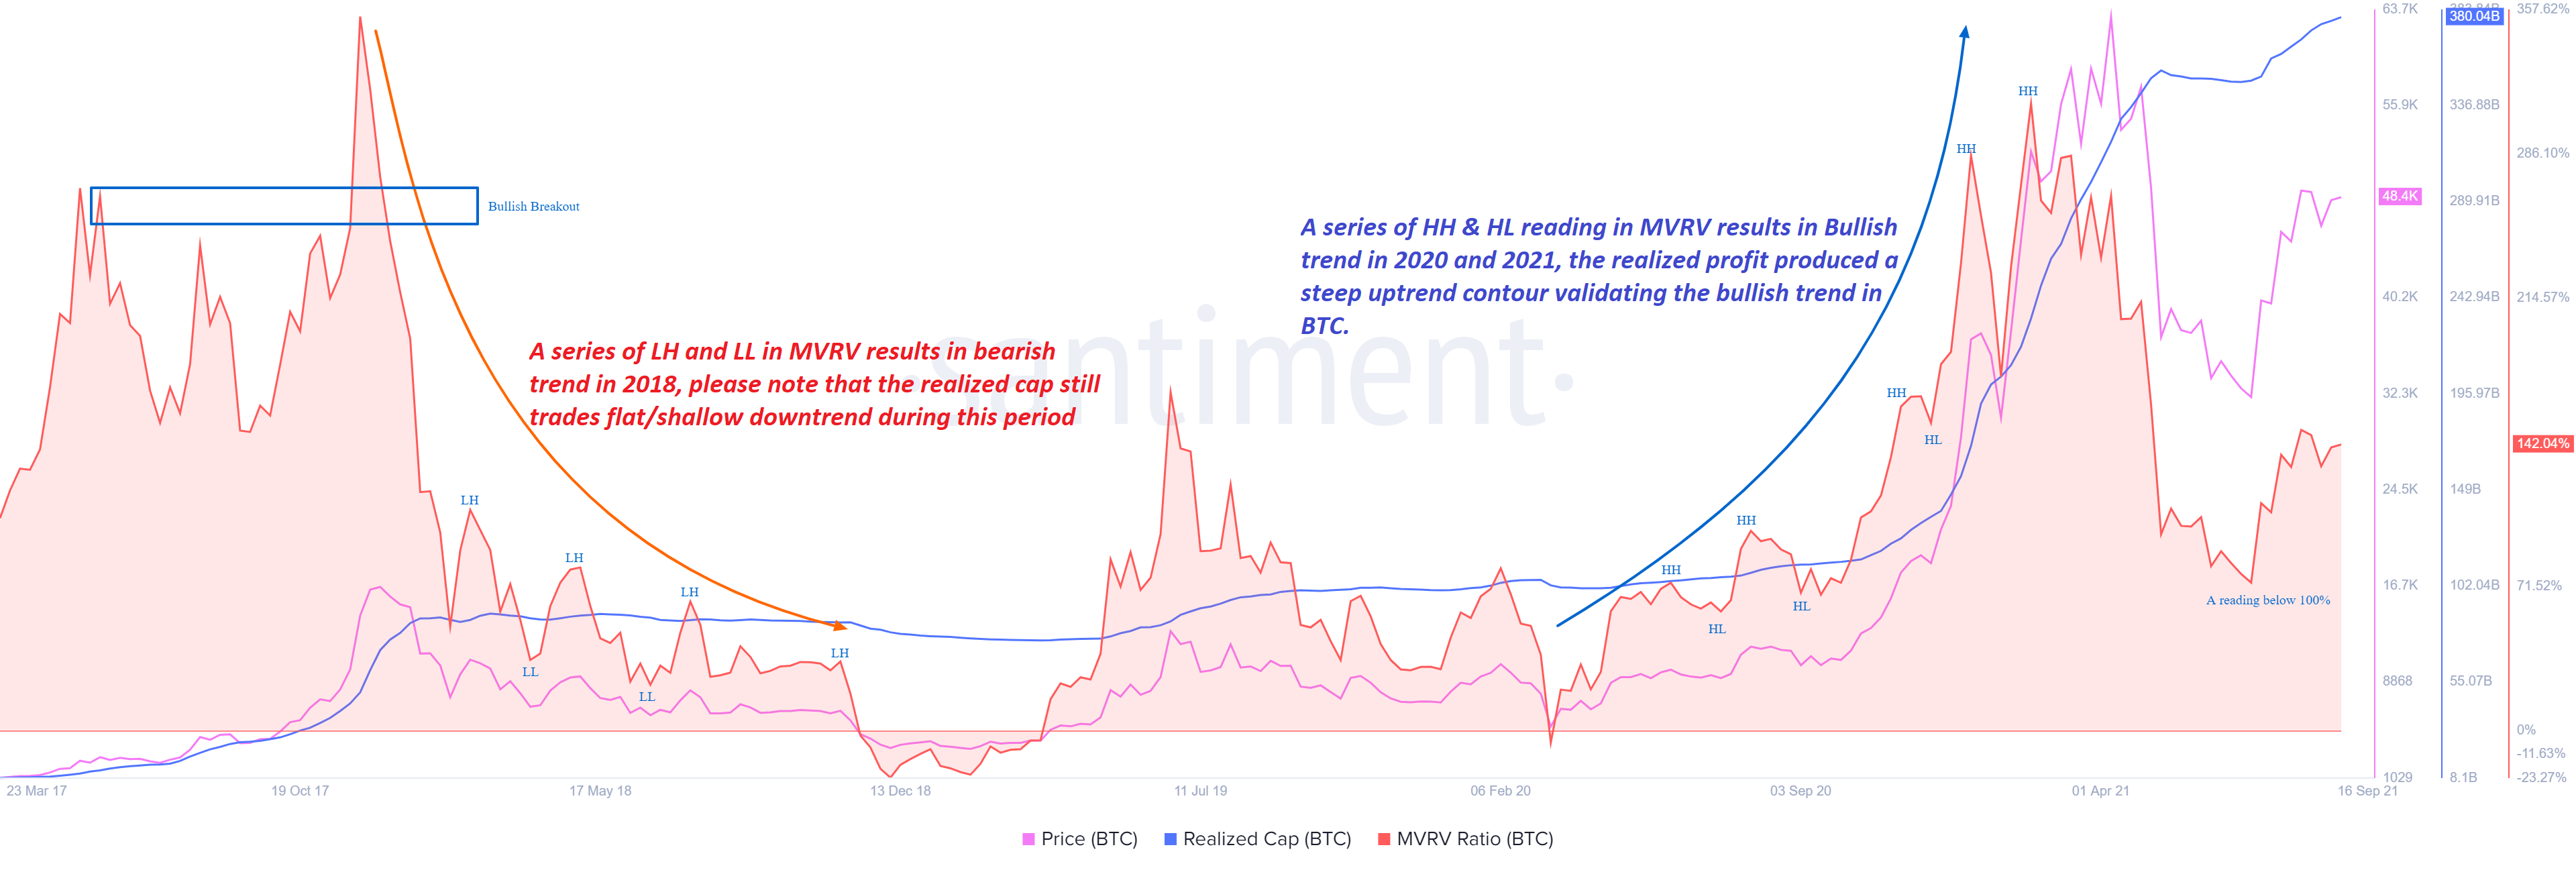
Source: Santiment
On the left, it tells about the bear trend that started in 2018 and lasts until early 2020. A series of LL reading below 100% produced bearish price action in BTC. On the right, it tells about the bull trend started in 2020 and how a series of HH with a reading above 100% produced bullish price action in BTC.
LH- Lower High, LL- Lower Low, HH- Higher High, HL- Higher Low
Observation:-
- After BTC peaked at the 19500 levels back in Dec 2017, the MVRV produced a series of LH and LL and subsequently falls below 1(or below 100%), and remains bearish.
- In 2020, the MVRV ratio started producing a series of HH, HL, throughout 2020 and early 2021 to push BTC to an all-time high of 64K.
- In the recent correction from 64K to 29K, MVRV falls below 100%, and any reading below 100% in the Bullish market hints at the bottom, and evidently BTC bounced again from 29K to print a high of 52K recently. MVRV ratio printing a reading above 100% signals Bullish continuation in this case.
- In this bull cycle, the highest MVRV ratio was 310%, if the MVRV ratio will cross that in this bull cycle, then it will signal a bullish breakout, and BTC might refresh the all-time-high and might go for price discovery mode in 2021 again.
- From here on, if MVRV keeps producing HH and HL and sustains a reading above 100%, then it will support strong Bullish price action for BTC.
.png)
Source: Santiment
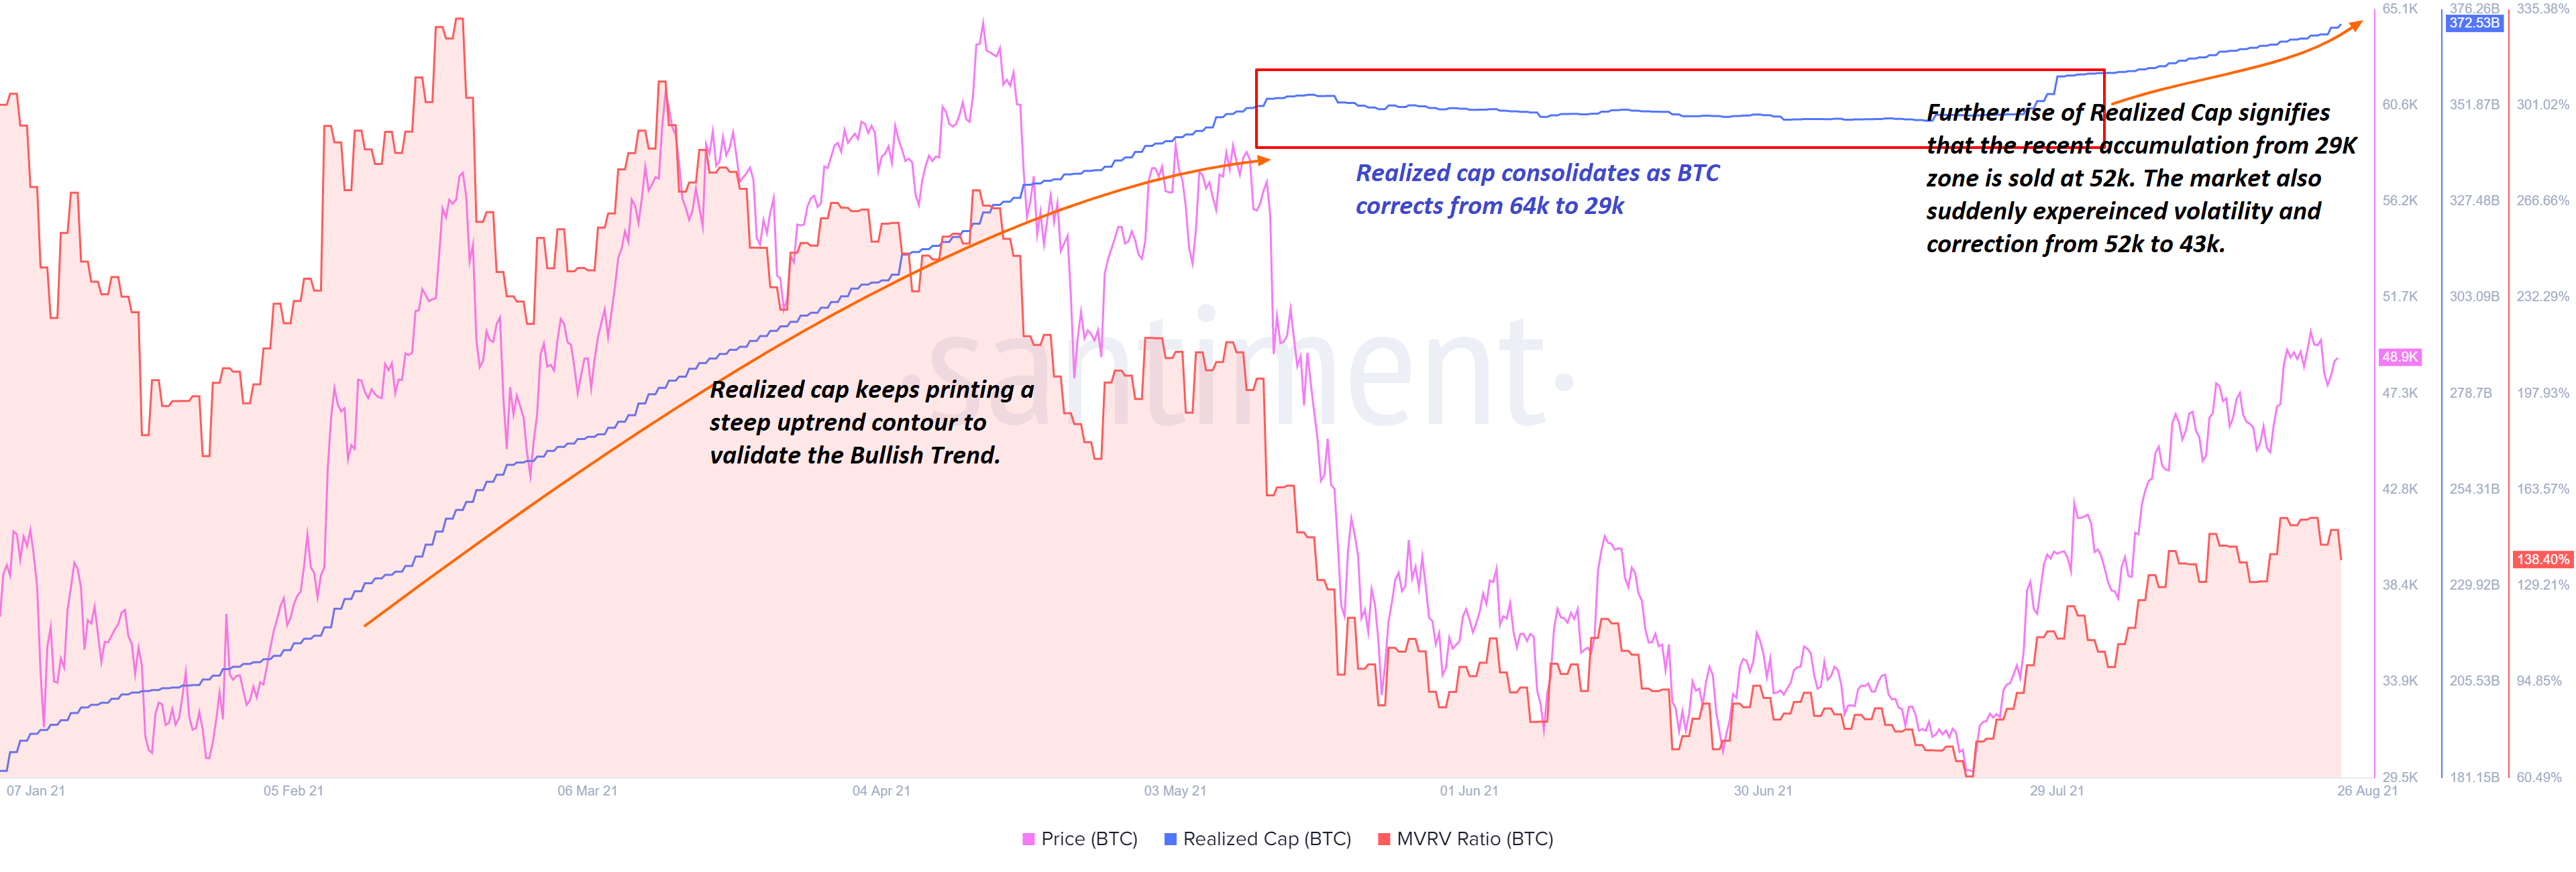
In the current Bull cycle of BTC, the realized cap plots a steep uptrend contour to reach a realized cap of 354Billion and then it plots a shallow downtrend contour as BTC corrects from 64k to 29K. With the recent bounce from 29K to 52K, the realized cap further prints a high of 371.6 Billion, which means the recent accumulation at 29K level further booked their profit at 52K level, that is why the realized cap was re-evaluated again and gone up again.
How do I add the on-chain Metric into the chart?
I used Santiment for this Course. You can also use Glassnode or any other suitable service provider.
- Go to https://app.santiment.net/ and create an account( You can choose for 14 days Pro Trial, free of cost)
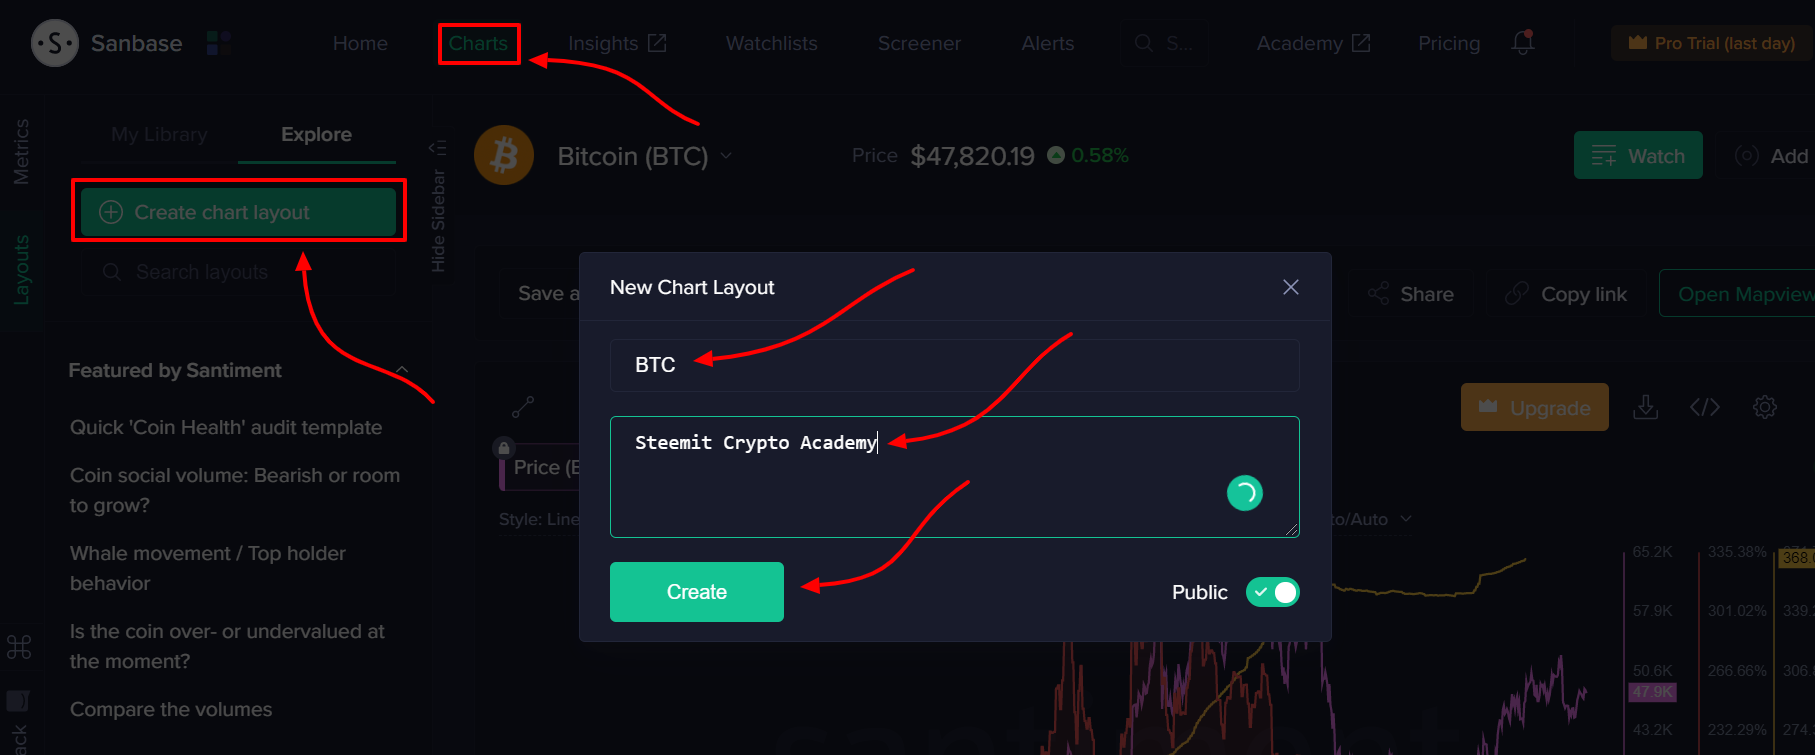
- Click on Chart, then create a New Layout. Name the Layout, then hit the Create Button.
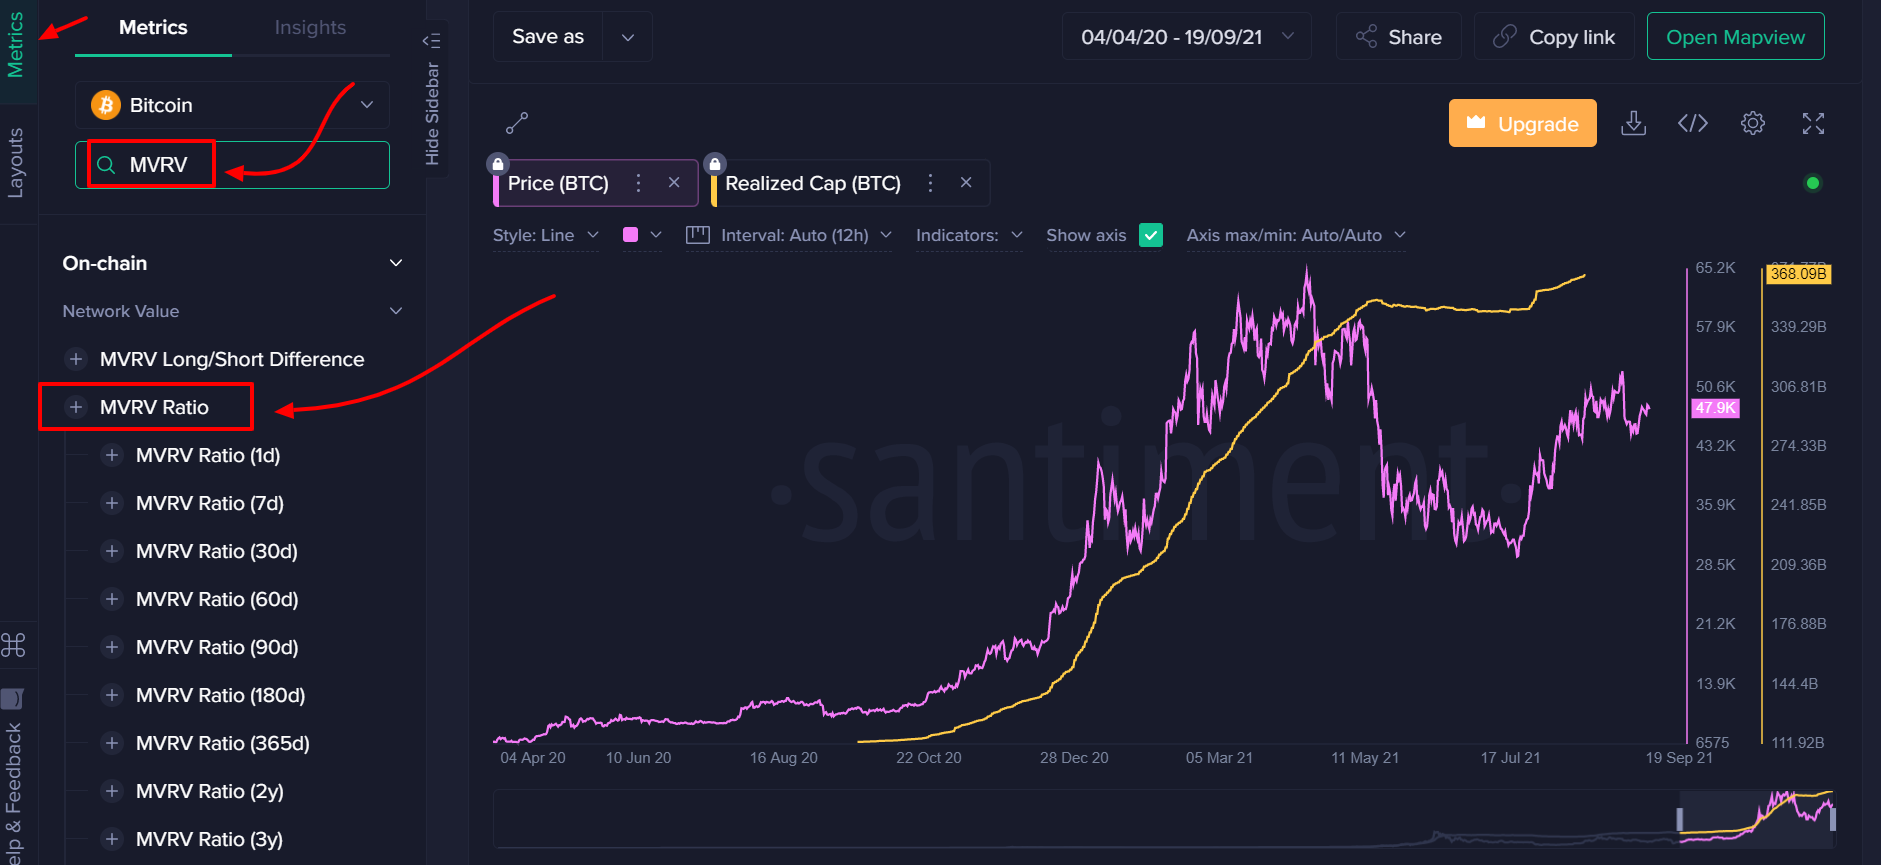
- Now click on Metrics and in the search field, just type the on-chain metrics that you want to use for this chart.
.png)
.png)
Source: Santiment
Usefulness & Limitations of MVRV
- MVRV works the best in the long-term price analysis. It can be used as a momentum oscillator in combination with other fundamental and technical indicators.
- The upper threshold of MVRV is not a guarantee to sell(Even if it is a historic level).
- The lower threshold has always been proven to be a reliable way to identify either a bottom or an accumulation zone.
Homework Task (Season 4/ Week-3)
(1) What is the difference between Realized Cap & Market Cap, How do you calculate Realized Cap in UTXO accounting structures? Explain with examples?
(2) Consider the on-chain metrics-- Realized Cap, Market Cap, MVRV Ratio, etc, from any reliable source(Santiment, Glassnode, etc), and create a fundamental analysis model for any UTXO based crypto, e.g. BTC, LTC [create a model for both short-term(up to 3 months) & long-term(more than a year) & compare] and determine the price trend/predict the market (or correlate the data with the price trend)w.r.t. the on-chain metrics? Examples/Analysis/Screenshot?
(3) Is MVRV ratio useful in predict a trend and take a position? How reliable are the upper threshold and lower threshold of the MVRV ratio and what does it signify? Under what condition the Realized cap will produce a steep downtrend? Explain with Examples/Screenshot?
Guidelines
- Your article should be at least 500 words.
- It is always better to gain sufficient user experience before submitting your article.
- Refrain from spam/plagiarism. This task requires screenshot(s) of your own experience. Use images from copyright-free sources and showcase the source, if any.
- This homework task will run until 25th Sept'2021, Time- 11:59 PM UTC.
- Users having a reputation of 65 or above, and having a minimum SP of 600(excluding any delegated-in SP, delegating to vote-buying services is viewed negatively) are eligible to partake in this Task. (Must not be powering it down).
- Add tag #sapwood-s4week3 #cryptoacademy in your post and should be among the first five tags. You can also use other relevant tags like #blockchain #onchainmetrics #fa or any other relevant tag. And also make sure you post in the Steemit Crypto Academy community.
- Do not reproduce the information that I have provided in my course article. Expand your knowledge by extensive research & analysis with proper reasoning to chainlink your understanding.
- Your homework title should be On-chain Metrics(Part-2)- Steemit Crypto Academy- S4W3- Homework Post for @sapwood
(Please feel free to join the comment section if you have any doubt on Homework-Task)
Thank you.
Disclaimer
This article & analyses are for education purposes only and should not be viewed as investment advice. This does not guarantee or promise in regards to any result that may be obtained from using the above content. The information provided here is for educational purposes in Steemit Crypto Academy. No person should make any kind of financial decision without first consulting their own financial adviser and/or conducting their own research and due diligence.
Cc:-
@steemitblog
@steemcurator01
@steemcurator02
Nice topic
The assets held in the wallet remain the value same for the holder when he is brought until he moves in the market and sells.
On-chain Metric gives inside information of assets.
#india #affable
Yes, that's correct.
Thank you.
Greetings prof. I hope you will be well and enjoying good health.
Sir I want to know that I have delegated my steem power and I am getting upvotes. Can I participate in the cryptoacademy tasks. Or I have to undelegate my SP.
I am waiting for your kind reply and sorry for the inconvenience.
If you have delegated to vote-buying services and/or proxy to vote-buying services, where the votes are given synthetically without caring for the content, then your reputation won't be recognized.
Thank you.
Sir I have delegated to @justyy. Is it ok or cannot participate. Please sir tell me as the above statement is not making sense for me.
Sorry for the inconvenience.
You have also delegated to whalestrail.
No, you are not eligible.
Thank you.
Thank you sir for guidance and if next time I undelegate from @justyy and @whalestrail then I hope I will be eligible.
Thank you so much means a lot. And sorry for the inconvenience.
Hi @mohammadfaisal. The sad kitty has made this undelegate link or you:
steemconnect undelegate link..
Great information but unfortunately will not be able to do it sorry for the things which happened yesterday.
Nice one sir, thank u for this post
Dear @sapwood we have almost 6 days old posts in #SteemitCryptoacademy and yet to be curated especially the homework task by @reminiscence
Link please?
Dear @sapwood ,link to my post is below ,may be you find other posts around.
Techinical Indicators :Crypto Academy / S4W2- Homework Post for @reminiscence01".by @jahangeerkhanday
Hello professor @sapwood, I'm sorry for the inconveniences,but my task 8 post given by @reminiscence01 that is meant to be graded by @dilchamo is already 5 days old,and it has neither been graded nor curated,pls if you can do anything about it I would really appreciate it.
Task 8
https://steemit.com/hive-108451/@giftye/decentralized-applications-crypto-academy-season-4-beginners-course-homework-post-for-task-8-by-giftye
Task 10
https://steemit.com/hive-108451/@giftye/candlestick-patterns-steemit-crypto-academy-season-4-homework-post-for-task-10-by-giftye
Thank you.
Alright, let me follow up with the professor.
Thank you.
Ok, thank you. Pls sir can I get your telegram or discord handles
My homework post....https://steemit.com/hive-108451/@gboye1/steemit-crypto-academy-season-4-week-3-or-advanced-course-or-homework-post-for-sapwood-onchain-metrics-part-2
Saludos profesor, @sapwood aquí le dejo mi tarea para que me la evalúe, gracias.
https://steemit.com/hive-108451/@elio9604802/metricas-en-cadena-parte-2-steemit-crypto-academy-s4w3-publicacion-de-tareas-para-el-profesor-sapwood
Good work welldone @sapwwood
Hello Professor. Please check my beginners task
https://steemit.com/hive-108451/@sherazsultan/crypto-academy-season-3-beginners-course-task-6-blockchain-wallet-types-and-uses
https://steemit.com/hive-108451/@sherazsultan/crypto-academy-season-3-beginner-course-i-task-2-blockchain-decentralization-block-explorer-i-by-sherazsultan