Steemit Crypto Academy Season 6 Week 3 : Crypto Trading by Identifying Support and Resistance
 Image designed in Canva | by @shemul21
 Hello dear steemians,
Welcome to this trading season of Steemit Crypto Academy. Today I’m going to share my knowledge and experience in crypto trading. This is my 2nd lecture as a crypto professor. Hope you'll enjoy and learn through this lesson. Let's start.

Support and resistance are areas where prices usually pause and take a decision. Support is a horizontal area of the chart where buyers are most active in making the market price higher. On the other hand, resistance is a horizontal area of the chart where sellers are most active in making the market price lower. The market always respects support and resistance zones. The below screenshot is an example of horizontal support and resistance.
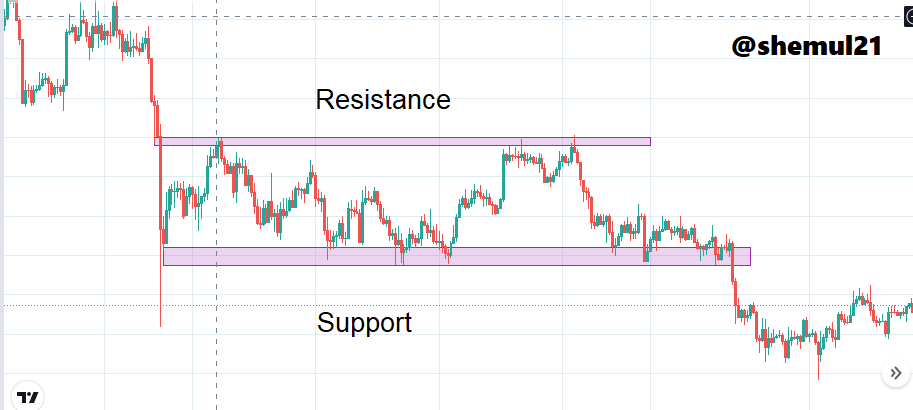 Image Source Tradingview
How does it work:
Mainly support and resistance work in an area/zone. It's not an exact area of a market. For example, prices 50-60 are support and resistance. Nothing is 100% perfect in the market. Some people draw an S&R line as a line. After that, they have drawn an area over it as supply and demand. But if you can draw the support or resistance as an area, it will automatically work as a supply or demand zone. So, we will design it as a zone.
Now, you can see I have drawn the support and resistance areas with the candles' bodies and wicks. It makes a good touch in the same area every time. But not an exact level. So, we have to be patient with the market's movement.
Technical analysis is built on the foundations of support and resistance. Here we'll learn the different types of support and resistance and how to draw them. The four main rules that we should follow to properly draw support and resistance are listed below.
- Make sure your chart is clear (without an indicator).
- Zoom out the market chart (for a better view).
- Draw the most obvious levels where the candle hits multiple times.
- It can be either the body or the wicks, or both.
There are three types of Support & Resistance that are listed below:
- Horizontal Support and Resistance
- Sloping levels of Support and Resistance
- Dynamic Support and Resistance
Horizontal Support and Resistance:
Most beginners make mistakes in finding the proper horizontal S&R level. Because after the breakout of a support area, it also acts as a horizontal resistance. And after the breakout of a resistance area, it works as a horizontal support. Sometimes it's hard to find out. But I'm going to give you some perfect examples to find out the exact levels easily. Stop and see the past price level where the market faced a hard time continuing the movement. The market may break through that level or take a reversal decision. That was the most critical level for the market. When the market hits a level more and more, the level becomes weaker. The horizontal S&R level gives us a trade opportunity. The higher timeframe's zone is more stronger than the smaller time frame.
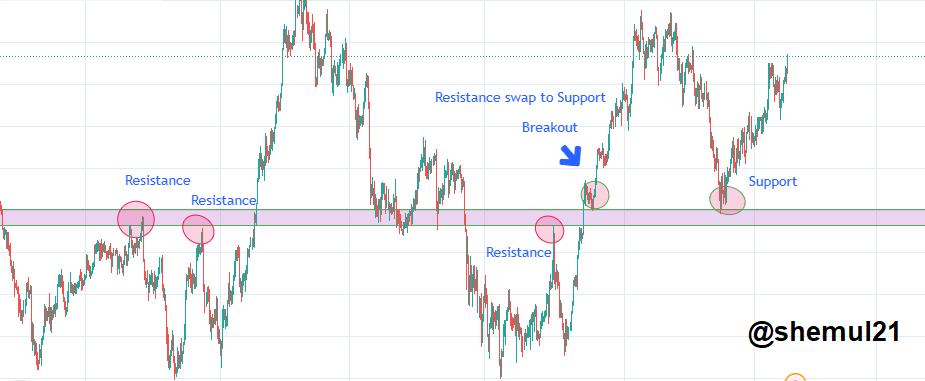 Image Source Tradingview
Look at the above screenshot, the market hit multiple times in the same area. From the downside, the market hits the level and respects its resistance. After breaking that level, the market again comes for a retest but fails to continue its uptrend. Next time the market has broken again that level & retest it successfully. So, resistance swaps to support.
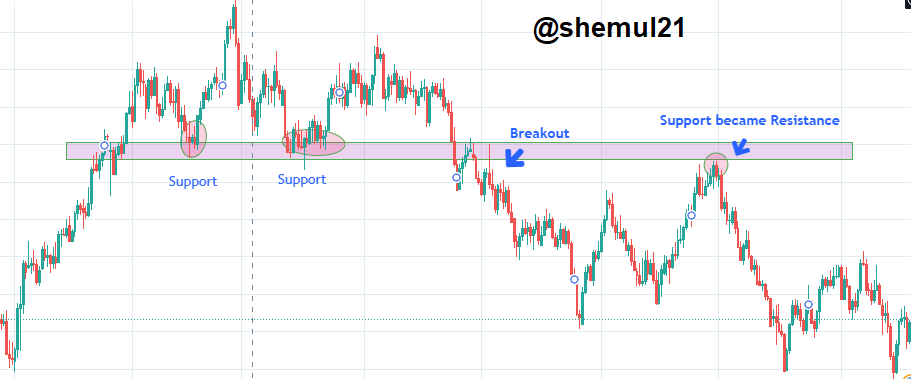 Image Source Tradingview
Look at the above screenshot, the market goes from the downside and breaks the resistance level. The resistance level turned into the support level. But for the third time, the market has broken that support level and it is now working as resistance. That is how a horizontal support and resistance zone can swap their places.
Note: Make an effort to practice every day. It will help you become a good analyst.
Sloping levels:
A sloping level is another kind of support and resistance zone, which is called "trendlines." There are two kinds of trends that are:
- Uptrend
- Downtrend
The market is going up and take a break. When it takes a break, it may hit the previous higher high. But it has not broken the previous level. The market respects the previous level and made a new higher high. In this situation, we can draw a trendline. We can call it the uptrend support level.
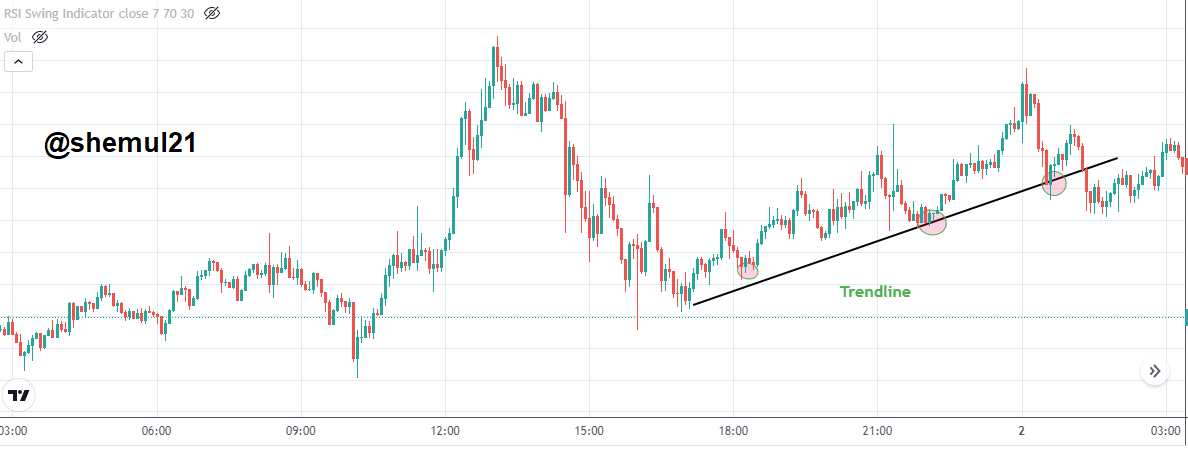 Image Source Tradingview
 On the other hand, the market is going down and taking a break. When it takes a break, it may hit the previous lower low. But it has not broken the previous level. The market respects the previous level and made a new lower low. In this situation, we can draw a trendline. We can call it the downtrend resistance level.
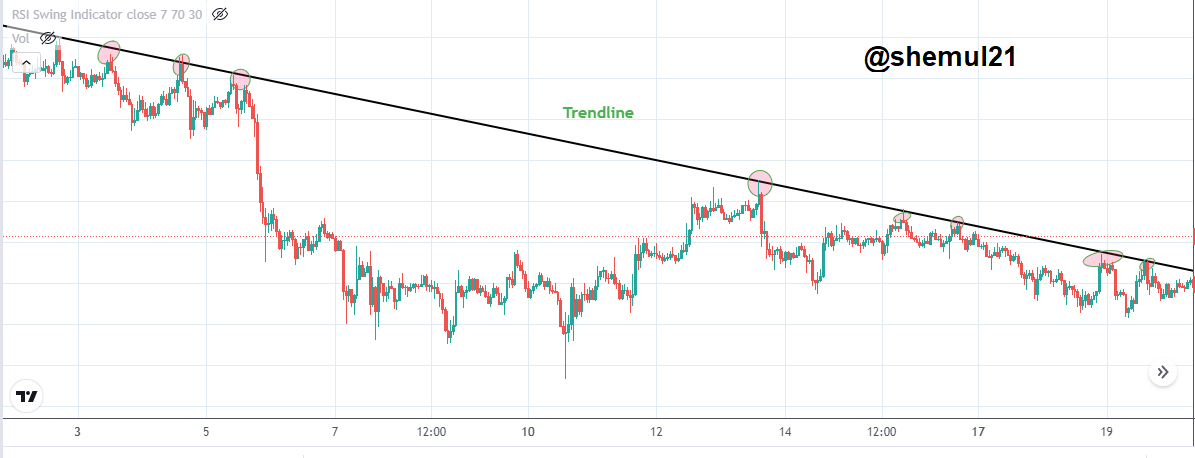 Image Source Tradingview
These two trend lines also represent the strength of that market. The higher timeframe gives us a stronger zone than the lower timeframe.
Dynamic Support and Resistance:
The Dynamic Support and Resistance Zones are those zones where the market can make a new pullback situation. We can also call it a retracement. It works almost the same as Trendline. We can find a dynamic zone via a moving average. It can be simple, exponential, or smooth. It depends on your trading style. Most of the traders use a 20,50,200 moving average. If the market touches the moving average (20), it means the market is now in a healthy trend. If the market touches the moving average (50), it may take a break for another long run. If the market touches the moving average (200), it means the market may make a trend reversal or test its most critical level. It can be on both sides in an uptrend market or a downtrend market. These three moving averages give us another kind of support and resistance zone.
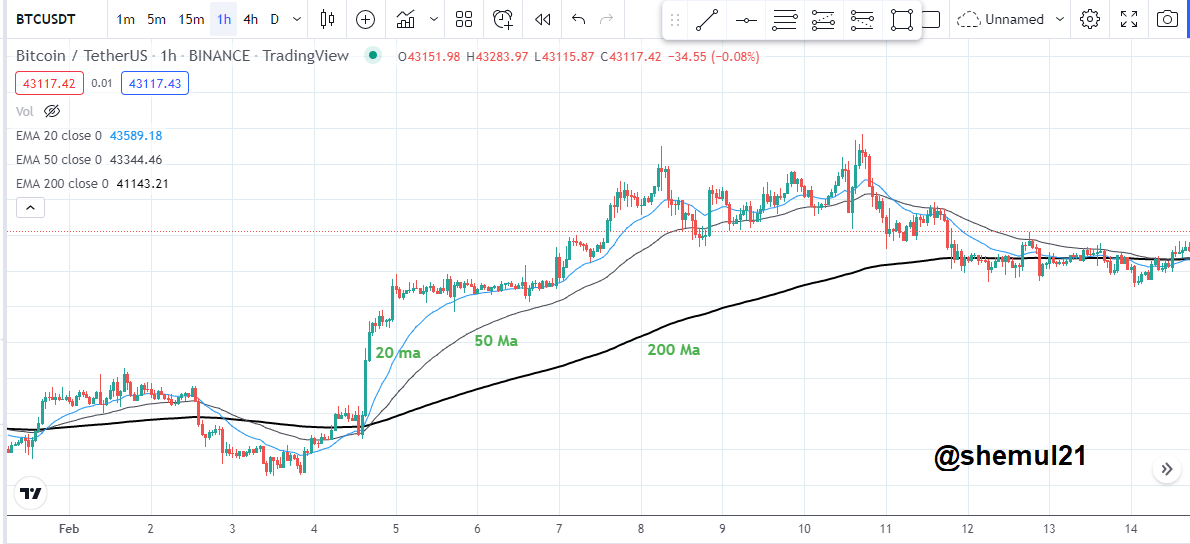 Image Source Tradingview
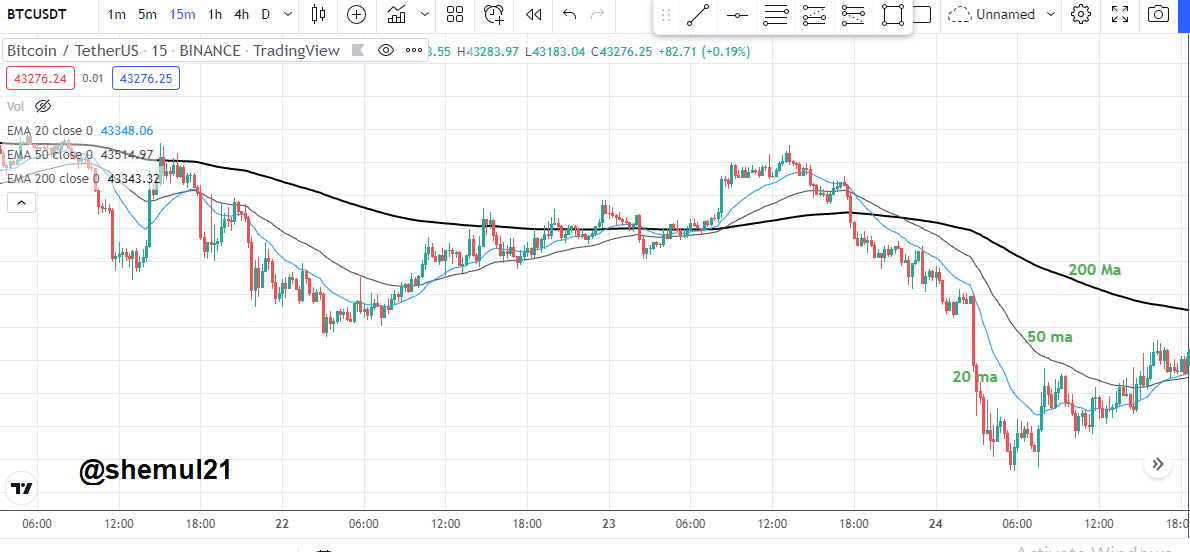 Image Source Tradingview
Multi-timeframe support & resistance level:
The breakdown of the market price on different time frames is referred to as multi-timeframe analysis. We have to analyze the condition of the market at D1, h4, or h1 timeframes. It is very important before taking a trade. Because we must first ensure that we correctly identify the market's trend. So that our trading is going to be less risky. We have to start from a higher timeframe.
There are 3 types of time frames:
- Long-Term Time Frame
- Medium-Term Time Frame
- Short-Term Time Frame
There are 3 types of Support and Resistance zone:
- Primary Zone/Major Zone
- Secondary Zone
- Minor Zone
When we are intraday traders, we can draw a primary zone on a daily candle or a 1-hour candle. The secondary zone might be on the 15-minute candle. And the minor zone is on the 5-minute candle. It will help you understand the market structure and breakout. A primary/major zone gives us a strong critical level that is hard for a market to break. Secondary gives you the market conditions and structure. The final minor support/resistance zone gives us a confirmation for trade.
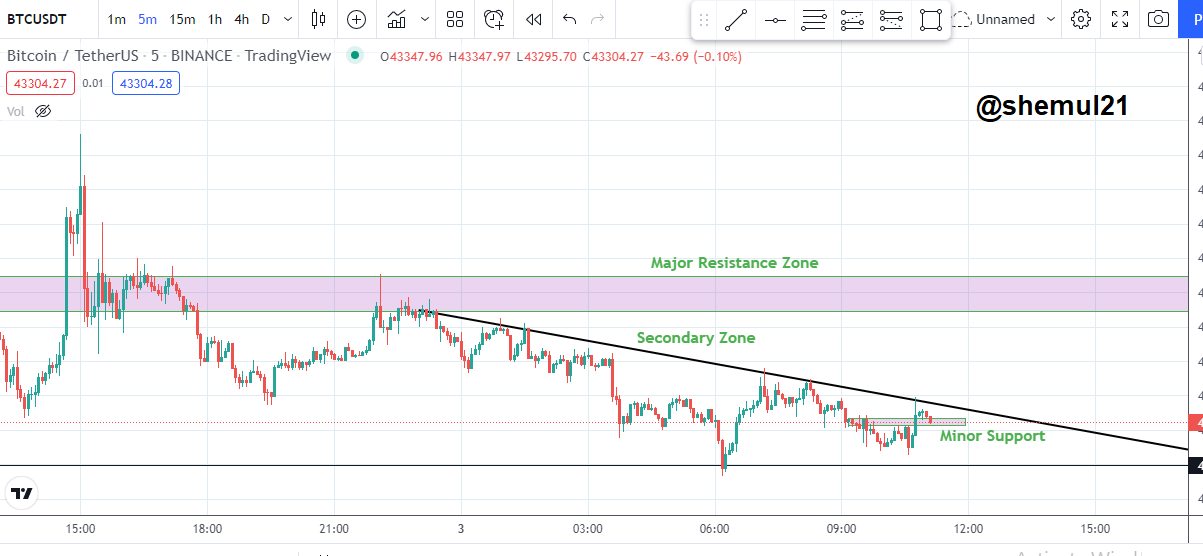 Image Source Tradingview
Note: The zone/area can be horizontal, sloping, or dynamic. It will be determined by your trading strategy.

If the market suddenly makes a huge movement and goes far from established support and resistance, it is called a breakout. There are different kinds of breakouts happening in the market. We have to identify the good breakouts and filter out the bad ones. It will give us a nice trading edge.
- Successful Breakout
- False Breakout
Successful breakout has two phases:
- Continuation Breakout
- Reversal Breakout
Continuation Breakout:
Suddenly, the price makes an aggressive move to its trend and breaks the critical level or breaks the zone. After the break, the market tested the same area and continued to trend, which is called a continuation breakout. Sometimes it doesn't test the level if there is a huge volume.
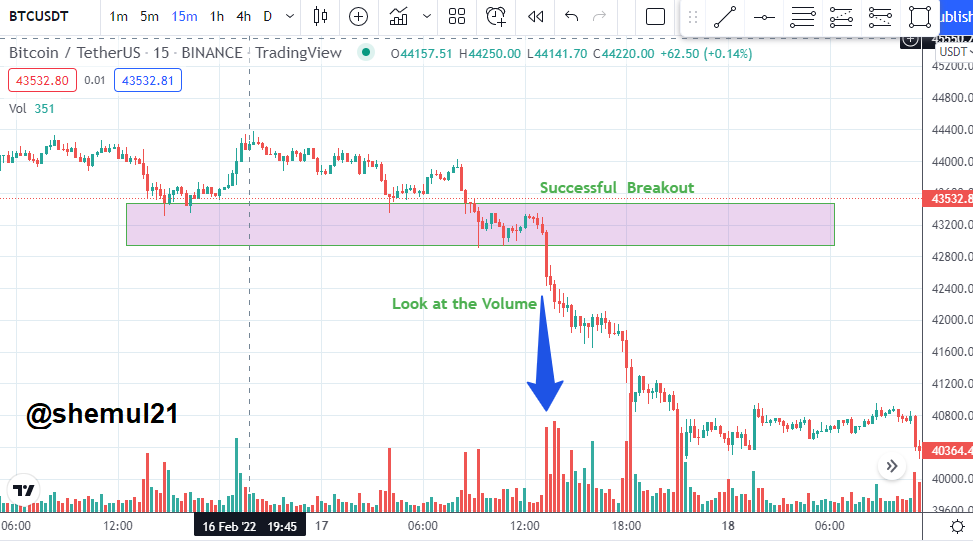 Image Source Tradingview
Reversal Breakout:
After a trend, the market is going into consolidation mode. If the opposite side pressure is very high, the market will make a reversal decision. After breaking that level, the market retests that level and makes a reversal continuation move.
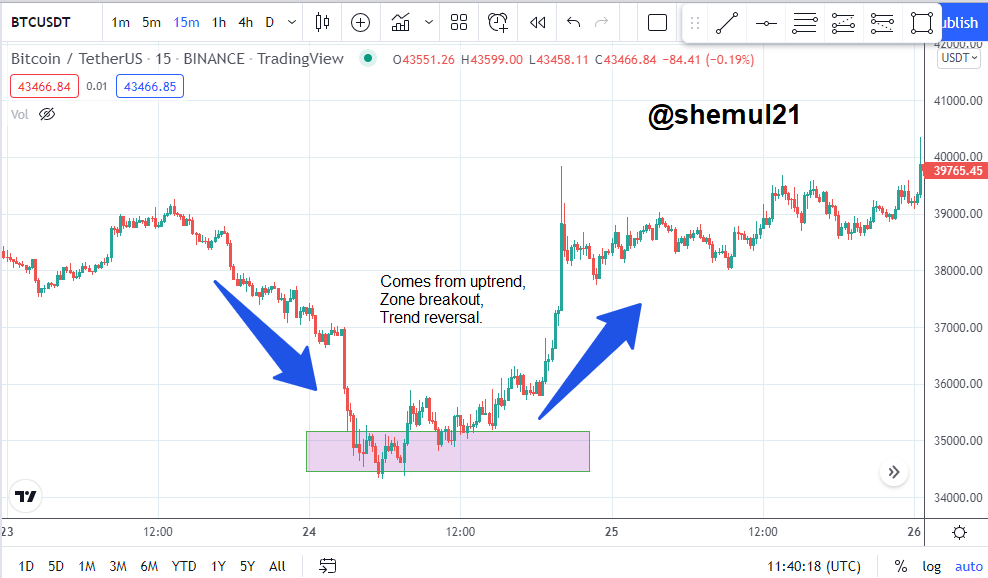 Image Source Tradingview
We can face two types of breakouts in the market that are:
Phase 1: The market may have broken strongly, retested that level, and possibly made a continuation move.
Phase 2: The market could be broken very strongly, but aggressive buyers or sellers were waiting for the breakout and would create huge opposite direction pressure. That's why the market could not continue in its direction and made a reversal.
There are another two types of breakout:
- Strong
- Weak
Strong: Suppose you want to run 20 miles. After running 10 miles, you take a break, then finish another 10 miles. It will definitely give you strength.
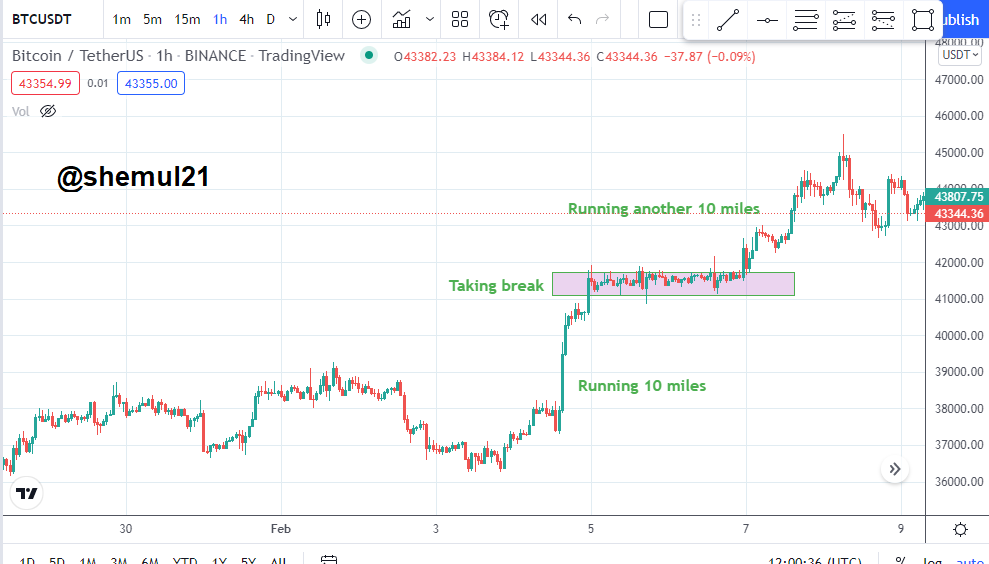 Image Source Tradingview
Now look at the above screenshot, the market is going up, taking a break, and continuing its move.
Weak: Suppose you want to run 20 miles. You have not taken any breaks. After 18 miles, you can not run like before. That's why you have lost your competition. The same situation happens on the market chart.
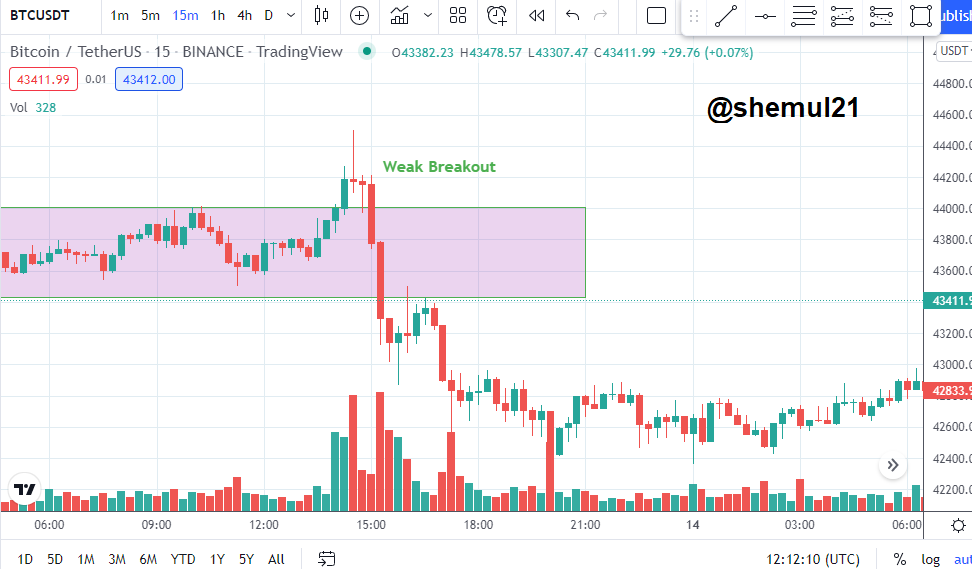 Image Source Tradingview
See the volume. The commitment level of the buyer is going to end, and the seller pushes it in the opposite direction. Because buyers have already lost their strength.

The Relative Strength Index (RSI) is an indicator of momentum. It shows the change in prices in a market. It has two phases. Generally, when the RSI goes higher than 70, it is considered an overbought position, and when the RSI goes below 30, it is considered oversold. It means that when it's in an oversold position, the market will probably make a bullish movement. On the other hand, when the market is overbought, it may move in a bearish direction. But we are going to break these rules. I am showing you a different system. Just make invisible both the RSI upper band and lower band. Then take an RSI middle band value must be 50.
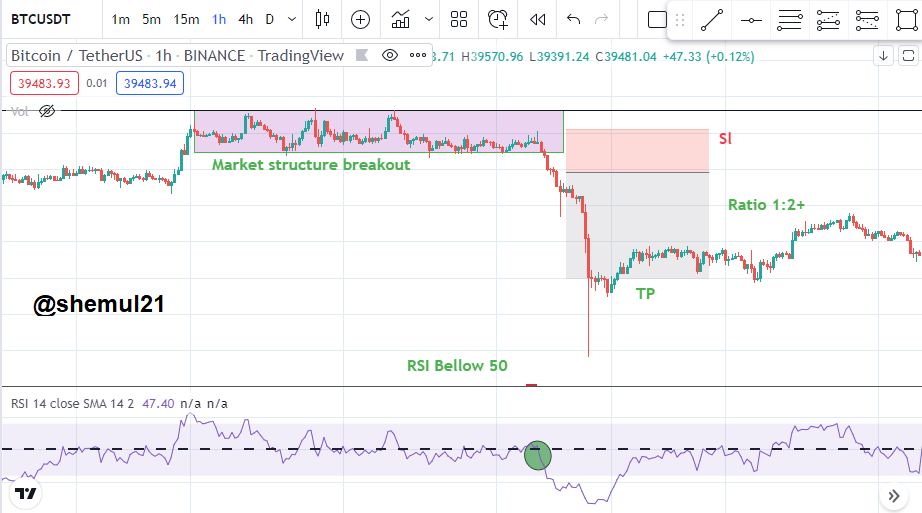 Image Source Tradingview
Look at the RSI. When the RSI crosses 50, it almost touches the oversold/overbought position. You can see the level of 50 RSi also works as a support and resistance zone. If we see the market is on a downtrend, it also broke a structure and our RSI is below 50%, we can possibly take a short position.
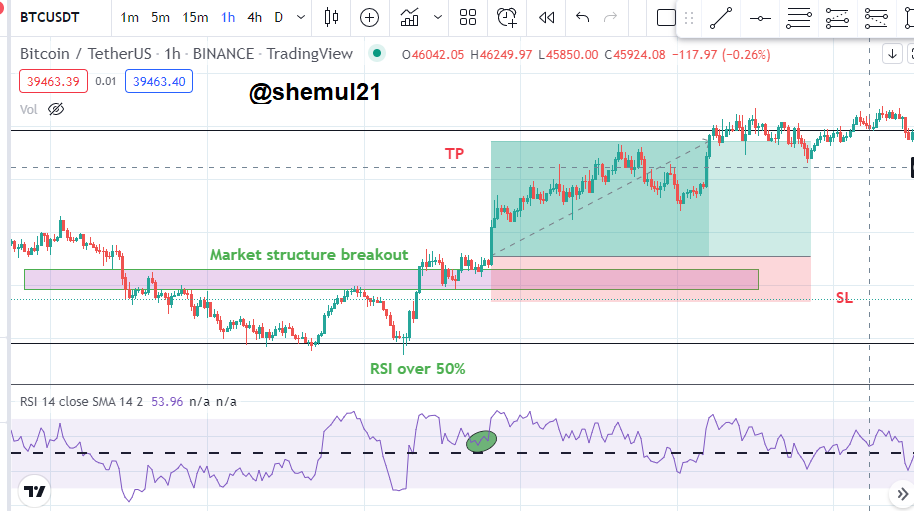 Image Source Tradingview
You can see the level of 50 RSi also works as a support and resistance zone. If we see the market is in an uptrend, it also broke a structure, and our RSI is up to 50%, we can possibly take a long position. After the RSI 50% breakout, the level of 50 works as a strong retracement zone.

I've discussed all the details of the support and resistance. Breakout trading is one of the best trading styles in the world. It gives a huge edge in trading. Below is the process of entering a trade.
- Zoom out the chart
- Draw some support & resistance zone
- Draw Trendline or Dynamic S&R zone
- See the volume for the commitment level
- Make sure it is a strong breakout
- After breakout it had retested the previous level.
- Then take an Entry.
- Use stop loss.
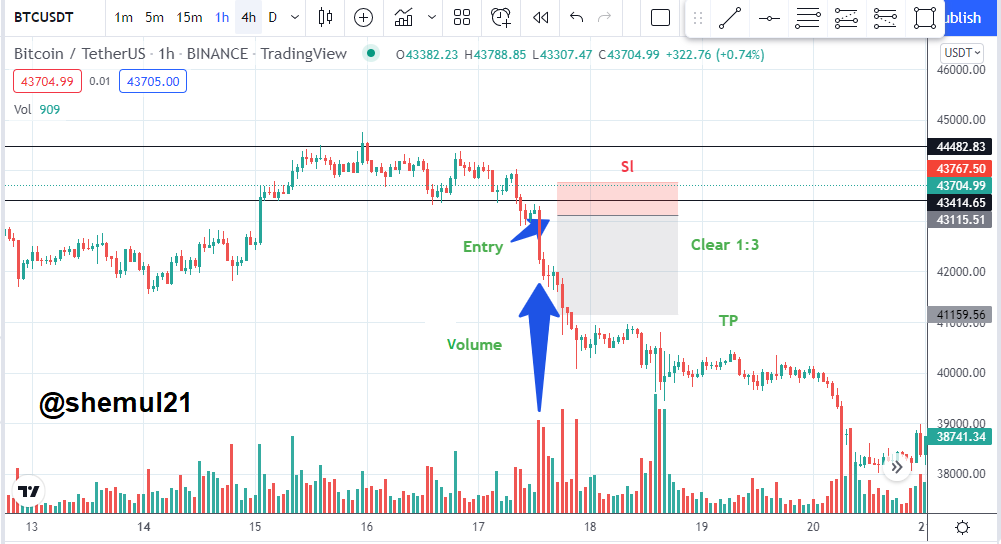 Image Source Tradingview
See, the BTC/USDT market is going down and being rejected by its resistance area. We can draw a resistance zone. I had taken two lines and defined a zone that showed us the market was in a consolidation mode. After breaking that level, it goes for a retest. See the volume of sellers (very strong). As a result, we make a trade on that position. Our stop loss is just above the retested area. Our take profit is just before the next retracement.
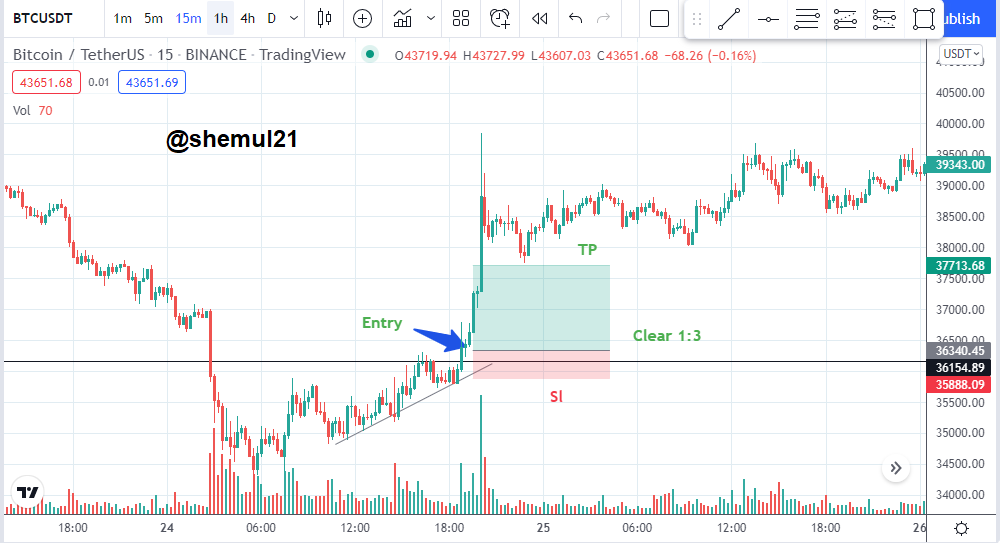 Image Source Tradingview
Now see that the market is going up. We have drawn our trendline on the 15-minute chart. Our horizontal resistance line (you can draw it as a line when you become good at it) is drawn in a 1-hour chart. After breaking that level, the market came back for a retest. It successfully retests that area with volume. As a result, we entered a long position. Our SL is just below the retested area and our TP is just before the next retracement.
.png)
Sometimes the market has made us confused. The market gives us some false movement. It is very important for us to identify a false breakout. Suppose the market has made a resistance breakout, but after breaking it, the candle lost its strength and closed below the resistance. At this point, the market may give us a false breakout. The same thing can happen vice-versa.
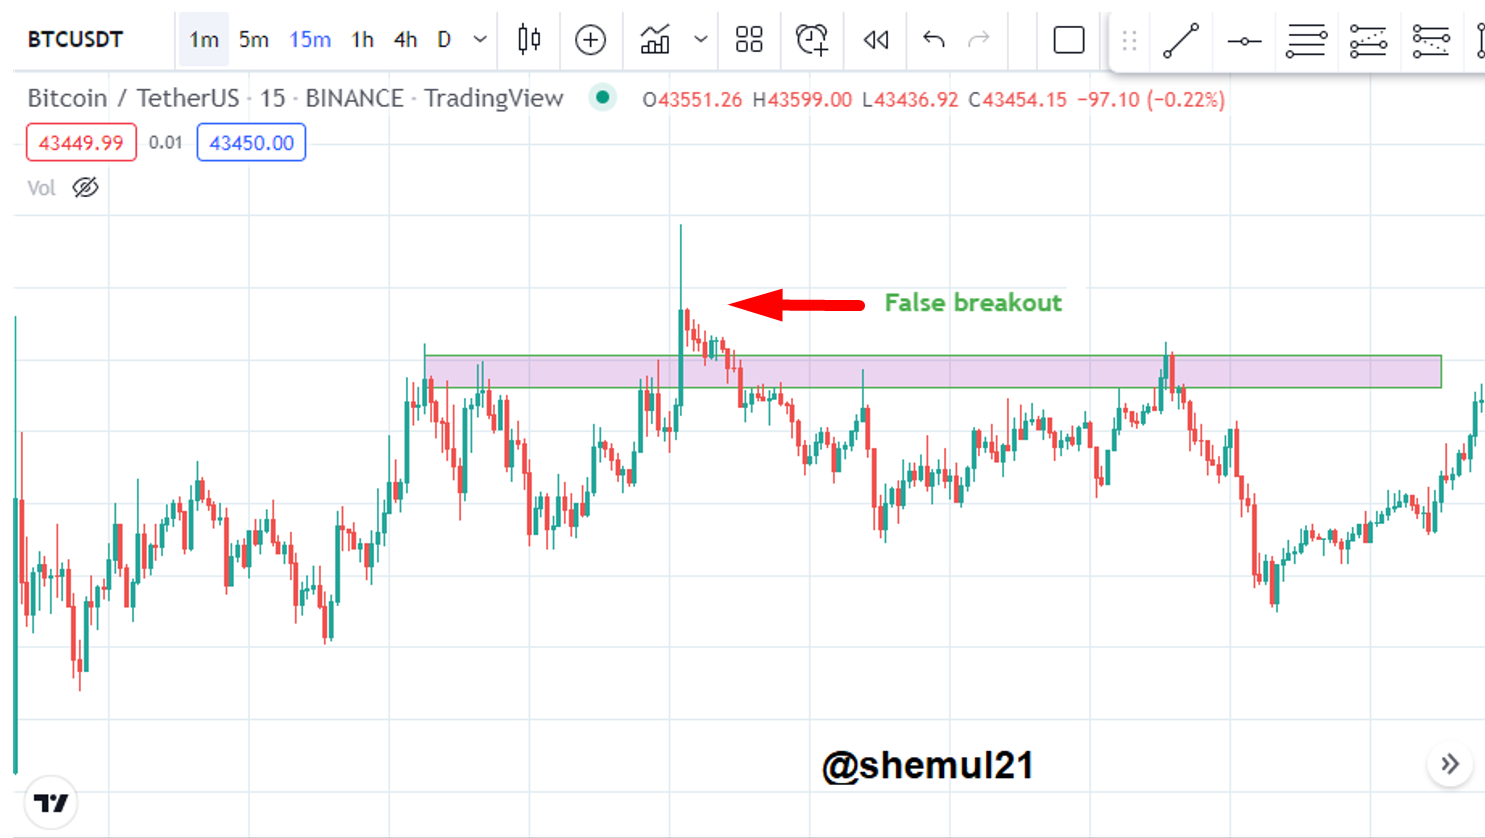 Image Source Tradingview
Note: We have to wait for breakout confirmation. If the candle tested that area and made a continuation move only on that point, we could make a trade. Otherwise, we should ignore that move.

Drawing support and resistance lines is a very simple process. A trader should identify recent market highs and lows and draw a line connecting the swings. Traders should look for an entry in the direction of the breakout if the market breaks the support and resistance levels.
I've tried to describe all the details about Support and Resistance. You may choose different indicators combined with this strategy to identify better signals for your real trade. I hope you enjoyed the lesson and learned how to identify Support and Resistance.

What is the Support & Resistance zone?
Explain different types of Support & resistance with proper demonstration.
Identify The False & Successful Breakouts. (demonstrate with screenshots)
Use Volume and RSI Indicator Combined with Breakouts & Identify the Entry Point. (demonstrate with screenshots).
Take a Real Trade(crypto pair) on Your Account After a Successful Breakout. (transaction screenshot required).
Explain the Limitations of Support & Resistance (false breakout).
Conclusion.

Your Homework Posts must be submitted to the Steemit Crypto Academy community.
You must include all of the details in your own words, without using someone else's words. Your content should be unique, even if the concept is similar.
Your homework posts must contain at least 600 words.
Plagiarism is strictly prohibited throughout the Steemit platform, and you will not be granted any benefits if you do so.
All screenshots and images should be fully referenced, and the images that are referenced should not be copylefted. Also, every screenshot should have your user name as a watermark.
Among the first five tags, include #shemul21-s6week3 #cryptoacademy and your country tag. You can also use relevant hashtags.
Only people who actively and successfully participate in #club5050 or above ( #club775, #club100 ) will be eligible to receive rewards for the Steemit Crypto Academy homework tasks, according to new rules changes.
Your homework Title should be [ Crypto Trading by Identifying Support and Resistance ]-Steemit Crypto Academy | S6W3 | Homework Post for @shemul21
The homework task will run until 12th March'2022, Time- 11:59 PM UTC.
You can participate in this Task if you have a reputation of 60 or higher and a minimum SP of 400. (You should not have experienced any power-downs in the previous 30 days, and your effective SP should not be delegated-in SP.) You will also be ineligible to participate in this Task if you have used any vote-buying services to improve your reputation.
If you haven't received your homework score within 48 hours, you can leave a link in the comments section. Otherwise, don't leave a link to your post here.
If you have any questions about my lesson, feel free to ask me in the comments section.

CC:
Hello Prof @shemul21, it's 48 hours already and my post haven't been graded, please help me out.
https://steemit.com/hive-108451/@jueco/crypto-trading-by-identifying-support-and-resistance-steemit-crypto-academy-or-s6w3-or-homework-post-for-professor-shemul21
@shemul21, greetings sir, I had some network interruptions while I was submitting my Google forms for the trading competition. I asked @abdu.navi03 whether my submission was received but he gave no response.
I'd be grateful if you could help me out. I really need the confirmation. Thank you.
Hi @danielo109,
We received your submission. Thanks.
Thank you very much @shemul21. I resent another submission though just in case it wasn't received. Thanks a lot for the confirmation.
Hello, professor @shemul21 is more than 48 hours and my post os yet to be graded
https://steemit.com/hive-108451/@benson6/crypto-trading-by-identifying-support-and-resistance-steemit-crypto-academy-or-s6w3-or-homework-post-for-shemul21
Hi Professor, you haven't graded my assignment and it's been 3 days.
https://steemit.com/hive-108451/@robbee/crypto-trading-by-identifying-support-and-resistance-steemit-crypto-academy-or-s6w3-or-homework-post-for-shemul21
Please check Sir @shemul21 @abdu.navi03 my Post expired without curation. I have reposted it.
https://steemit.com/hive-108451/@omsingh11/5g2hu-filusd-buy-sell-or-s6t2-team-trading-post-for-team-frontline
Helo prof. Shemul21, pls help me confirm if
I am eligible for a reward if I participate in the home work. This is because I have been
away from the academy for some time now.
Thank you as I expect your response.
Hi @culzee,
You are not eligible to participate because you are not following any of the clubs. To be eligible, you may increase your SP by powering up at least half of your earnings and more than the transferred amount. Thanks.
I powered up more than half of my last earning and since them I have no other earning.
Hello @shemul21, kindly help me grade my post as you mistakenly skipped it earlier
https://steemit.com/hive-108451/@jueco/link-usd-sell-or-s6t2-team-trading-post-for-team-frontline
Hi @jueco,
Don't worry, we'll check. Thanks.
Ok thanks, @shemul21, I await your grades
Excellent lesson from you. Soon i give my entry.Thank you.
You are welcome.
Congratulations @shemul21
This is the most positive post amongst

top 100hot posts on steemit at this moment.An interesting lesson as always this week prof. Working on my entry.
Thanks.