Crypto Trading with Moving Average -Steemit Crypto Academy | S6W2 | Homework Post for @shemul21


Question (1)
Explain Your Understanding of Moving Average.
Technical indicators are tools that are used by traders when carrying out an analysis in the market. There are two types of indicators which are Lagging and Leading indicators. Lagging indicators are indicators that are less responsive to price action and therefore make use of historical price data points, This means that they are following an occurring trend while leading indicators are used to predict the future price action or the behaviour of the market even before it occurs.
For this task, my focus will be based on a Lagging indicator called the Moving Average. The Moving Average is a lagging indicator that tries to calculate the average data points of prices within a period, the essence of this is to smooth out fluctuations caused by the price data.
The Moving average is used for the identification of market trends, Breakouts, Trend reversals and identification of potential entry or exit signals. The Moving average can be used to identify a trend when the price action is moving above or below the Moving average line. For the identification of breakouts, the price action needs to move above or below the moving average after a market consolidation or during a distribution phase. These signals are what traders when making an entry into the market.
Question (2)
What Are The Different Types of Moving Average? Differentiate Between Them.
There are three types of Moving Average which include;
- Simple Moving Average
- Exponential Moving Average
- Weighted Moving Average
Simple Moving Average(SMA)
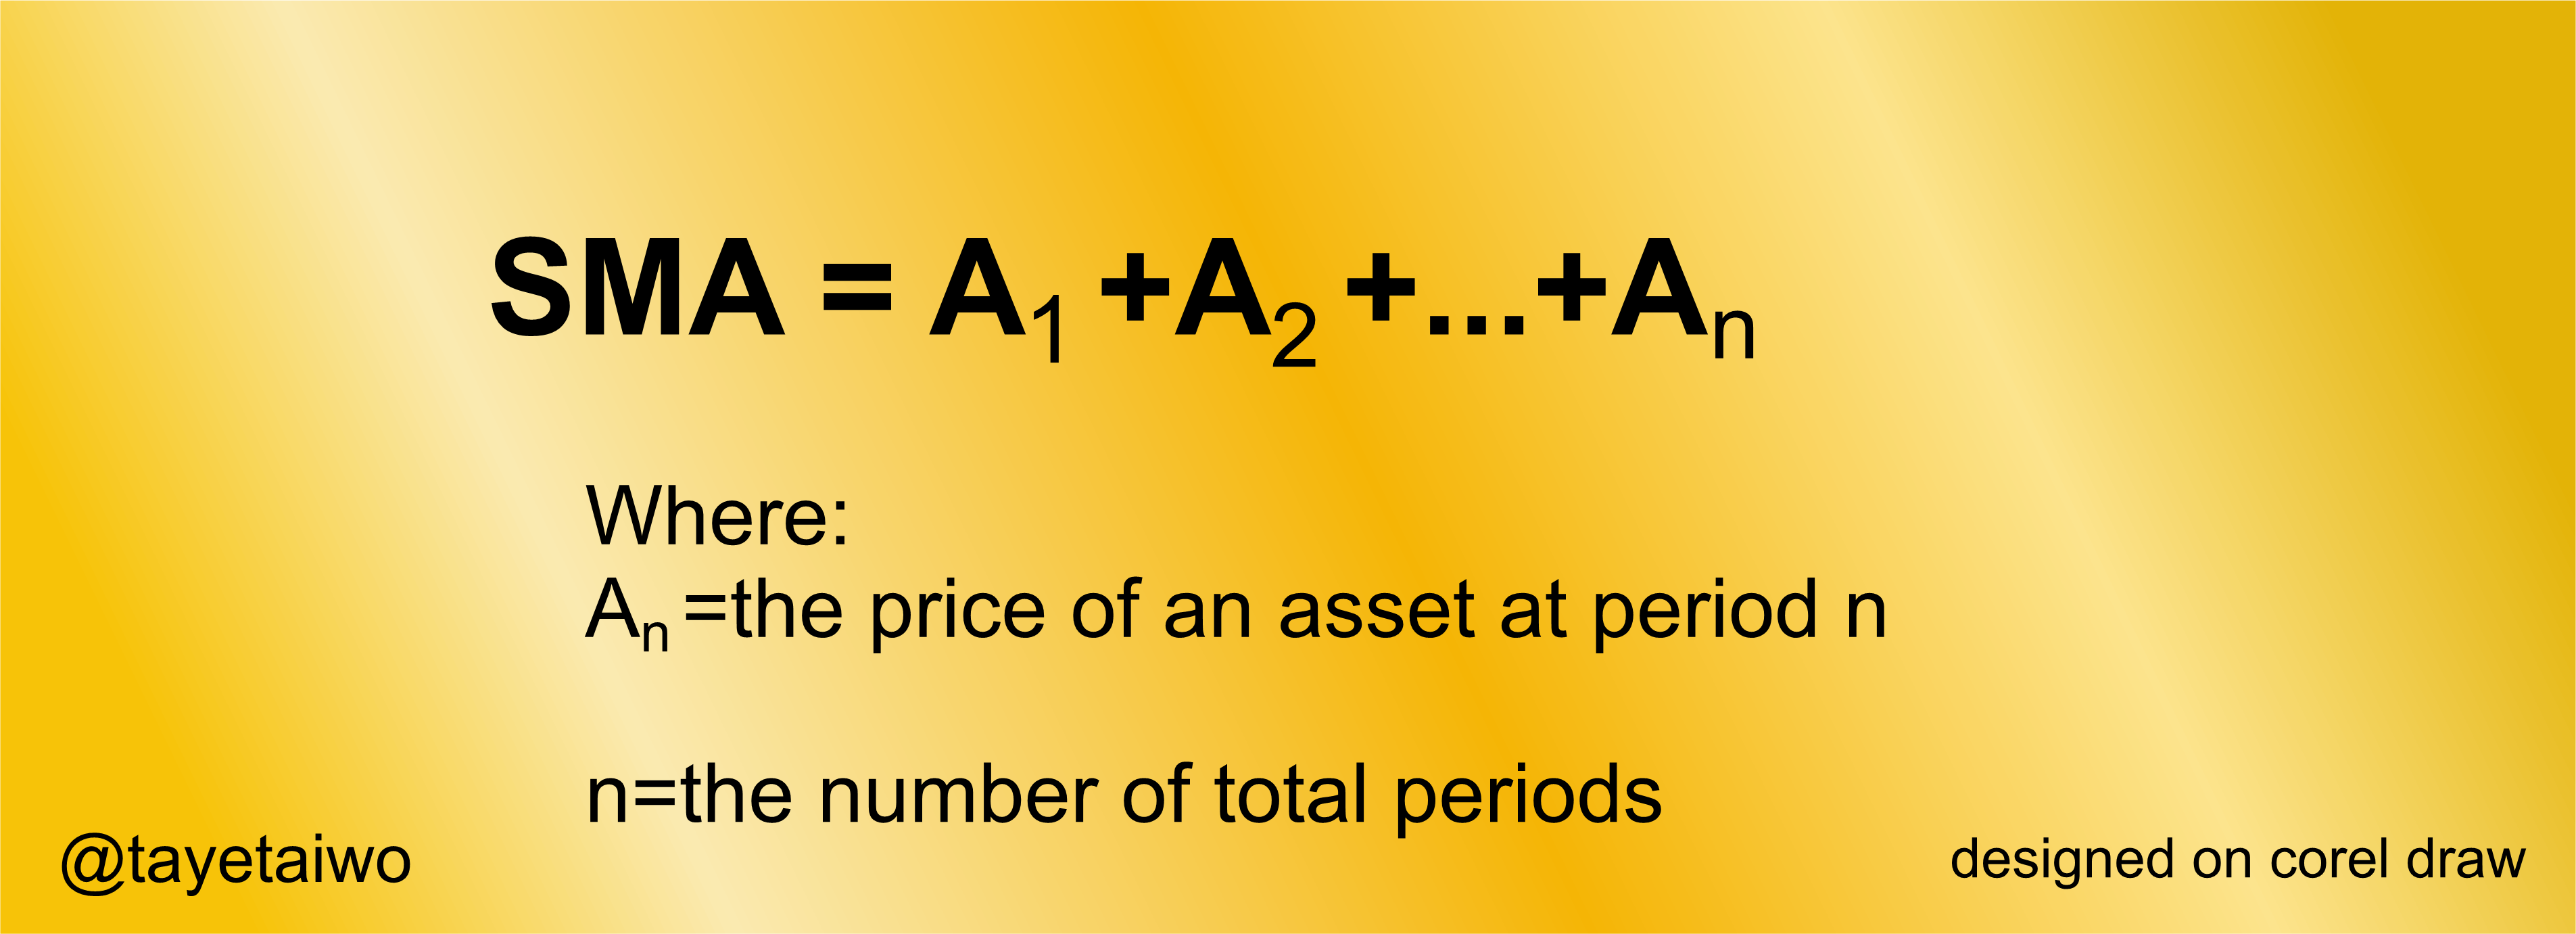
This is the basic form of a Moving average. It is calculated by adding historical closing price data within a period or number of periods and then it is divided by that same number of periods. All the data considered are interpreted into the SMA line. The SMA is majorly used to identify trends. The SMA is an indicator that can be modified so that traders can be able to use it to smooth out the fluctuation of price action. Below is the formula used in the calculation of the SMA.
Exponential Moving Average(EMA)
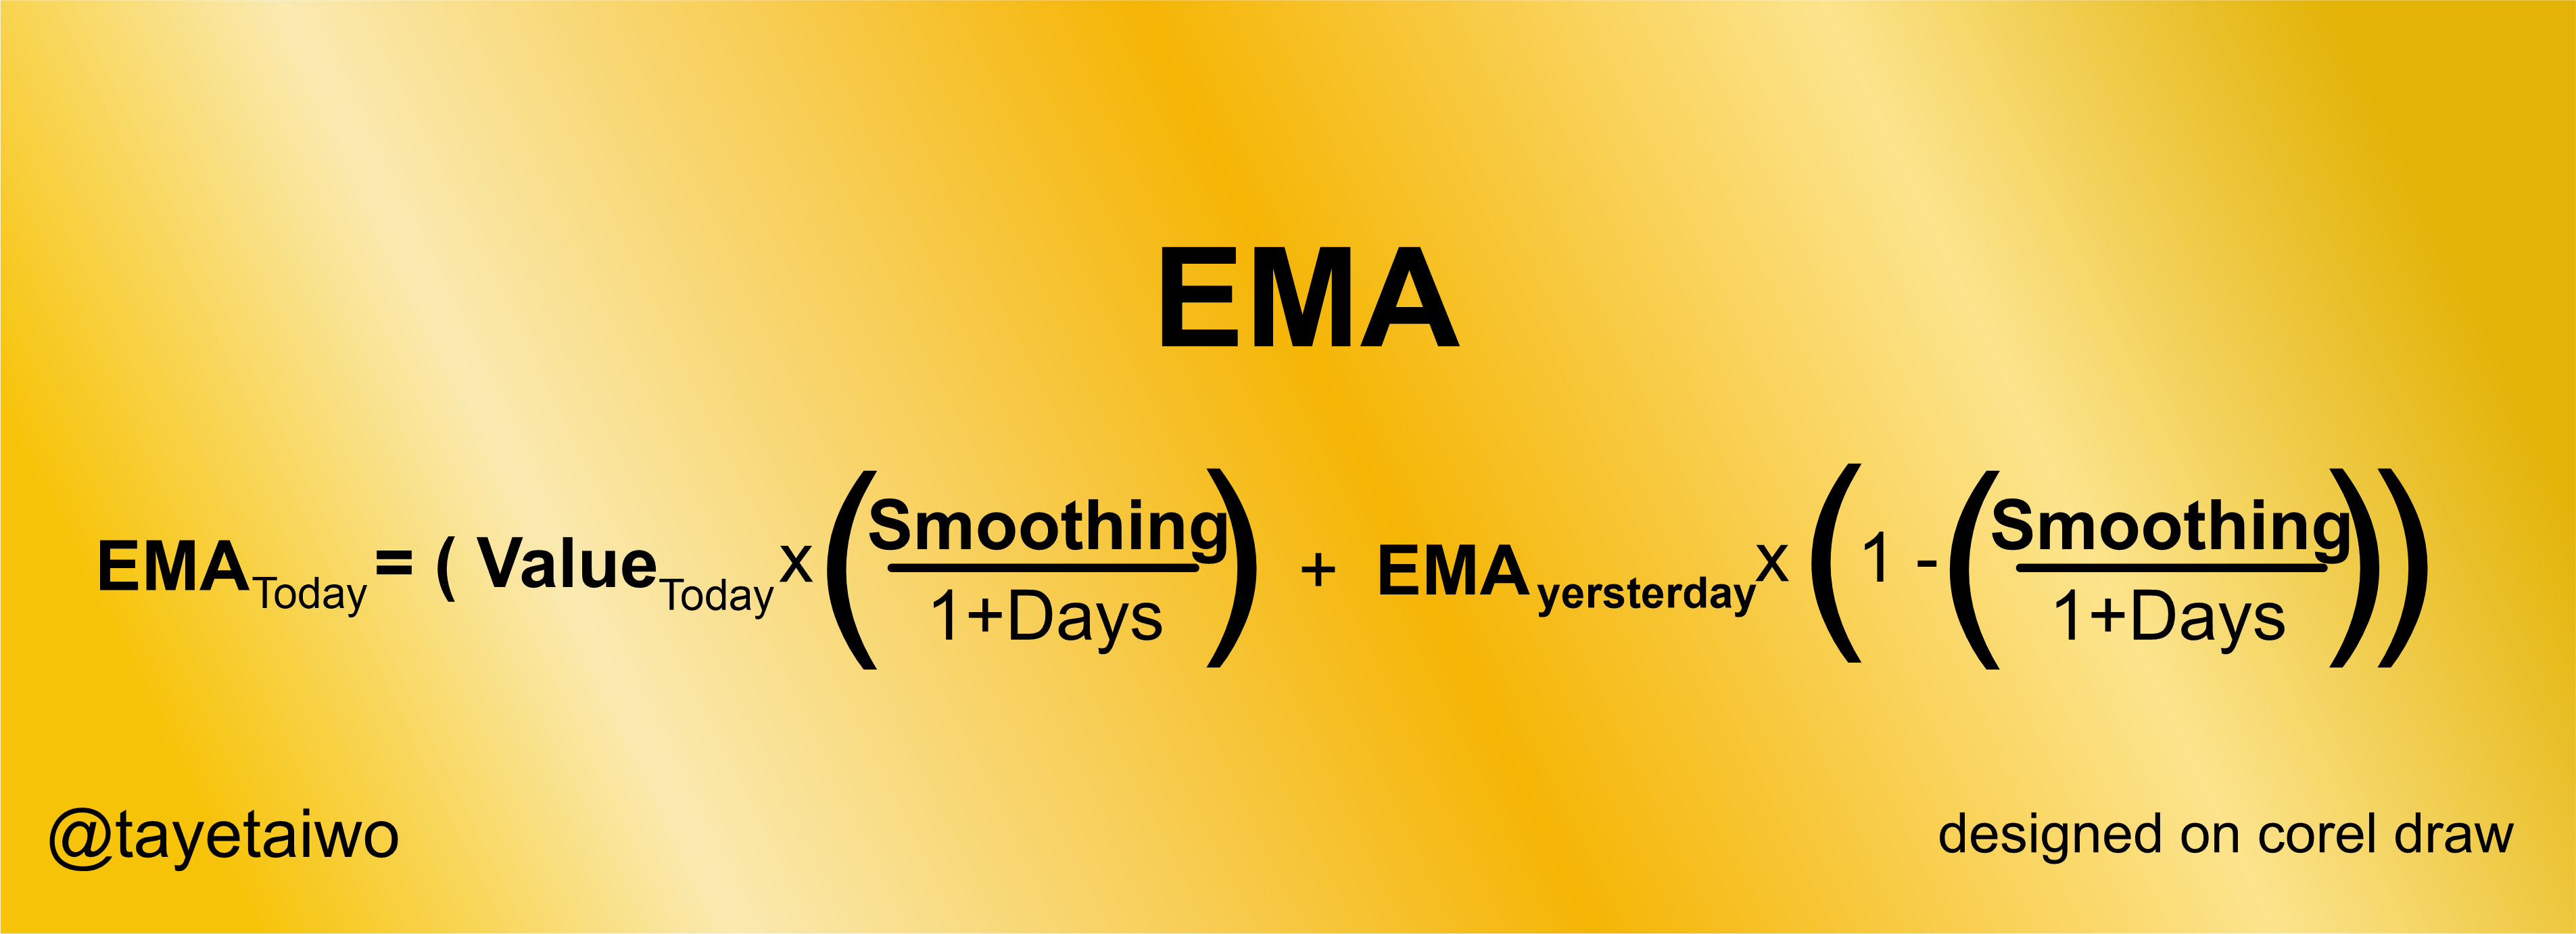
The EMA is a more complicated version of the SMA. The EMA pays more attention to the recent change in price data values, this means that the EMA will react better to the changes in the price action of the asset. This makes the EMA a more preferable indicator for traders who trade in a shorter term because it can be used to identify breakouts and reversal more accurately than the SMA. Below is the formula used for calculating the EMA.
Weighted Moving Average(WMA)
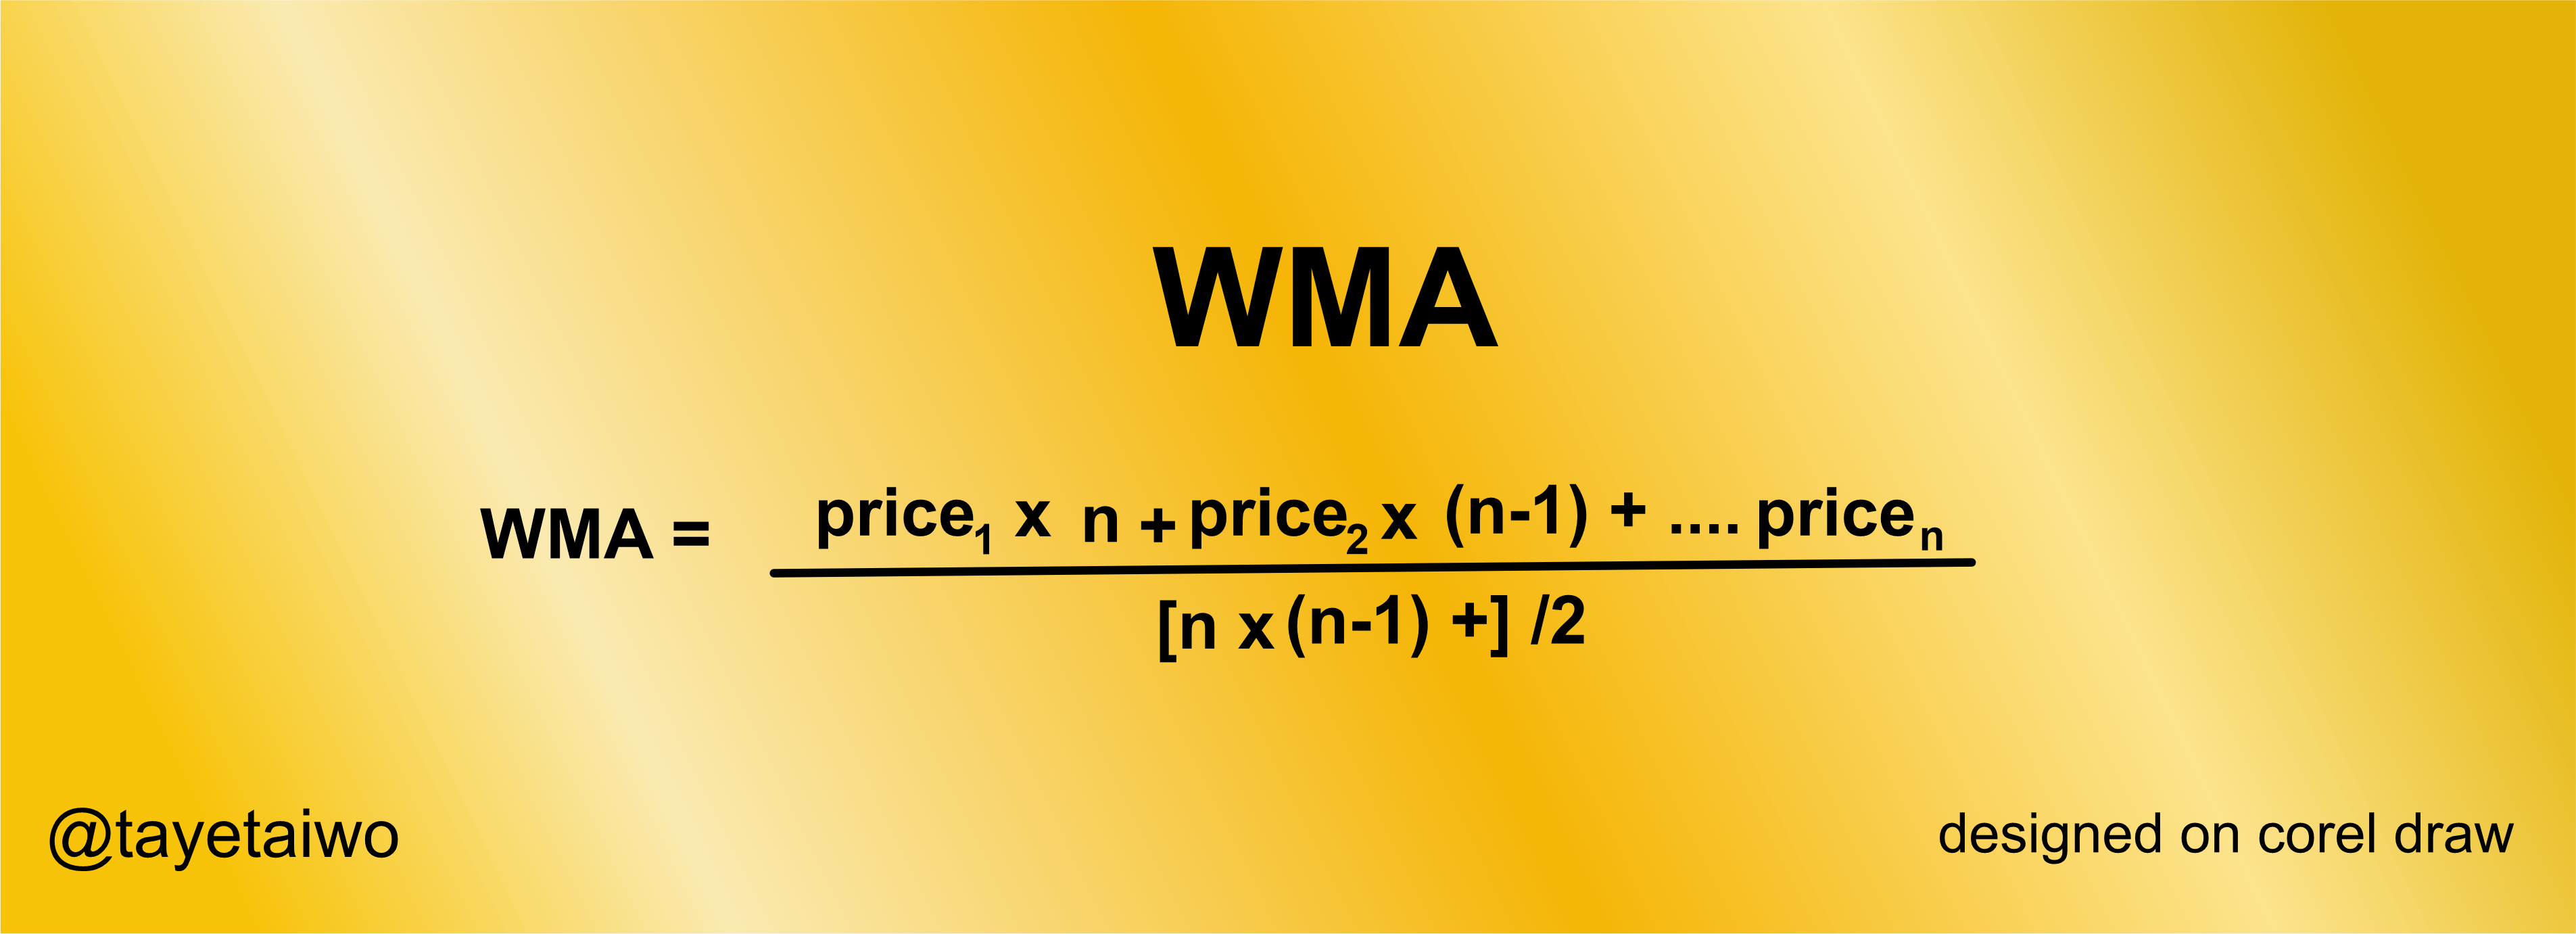
The WMA indicator is a moving average that gives more attention to a specific data point. The SMA, when calculated gives equal weight to all the historical price data, but with the WMA more weight is placed on the most recent price data, by doing so the WMA will relay more accurate data than the SMA because it can relay a %100 data about the recent price action of an asset. Below is the WMA formula.
Difference Between The Types of Moving Averages
| Simple Moving Average(SMA) | Exponential Moving Average(EMA) | Weighted Moving Average(WMA) |
|---|---|---|
| Weighs all price data equally | Weighs recent price data higher than the previous | Weighs recent data and completely ignores previous data. |
| Suitable for identifying trends | Suitable for identifying Breakouts and Price reversals | Suitable for identifying quick changes in price fluctuation and also for scalping. |
| Using longer periods for trend identification is ideal | Using lower periods is ideal for identification of reversals | Because it pays attention to a specific data point, therefore if used for both longer and shorter periods, it is still ideal. |
| It calculates the average price based on the period used | It calculates the average price based on the periods and smoothing value | It calculates average data based on the most recent period. |
Question (3)
Identify Entry and Exit Points Using Moving Average. (Demonstrate with Screenshots)
Identifying entry and exit points are ideal for any trader because with that data they can make an entry into the market. To identify an entry or exit position the trader has to first identify a dominant trend in the market, and this can be done with the help of the 100 MA or 200 MA because the MA takes into consideration all the price data within a period. For the identification of entry points, the EMA will be considered because it is more sensitive to price action than the MA and also it relays data based on recent price action. Consider the illustration below for an entry strategy using the MA and EMA.
Entry Points
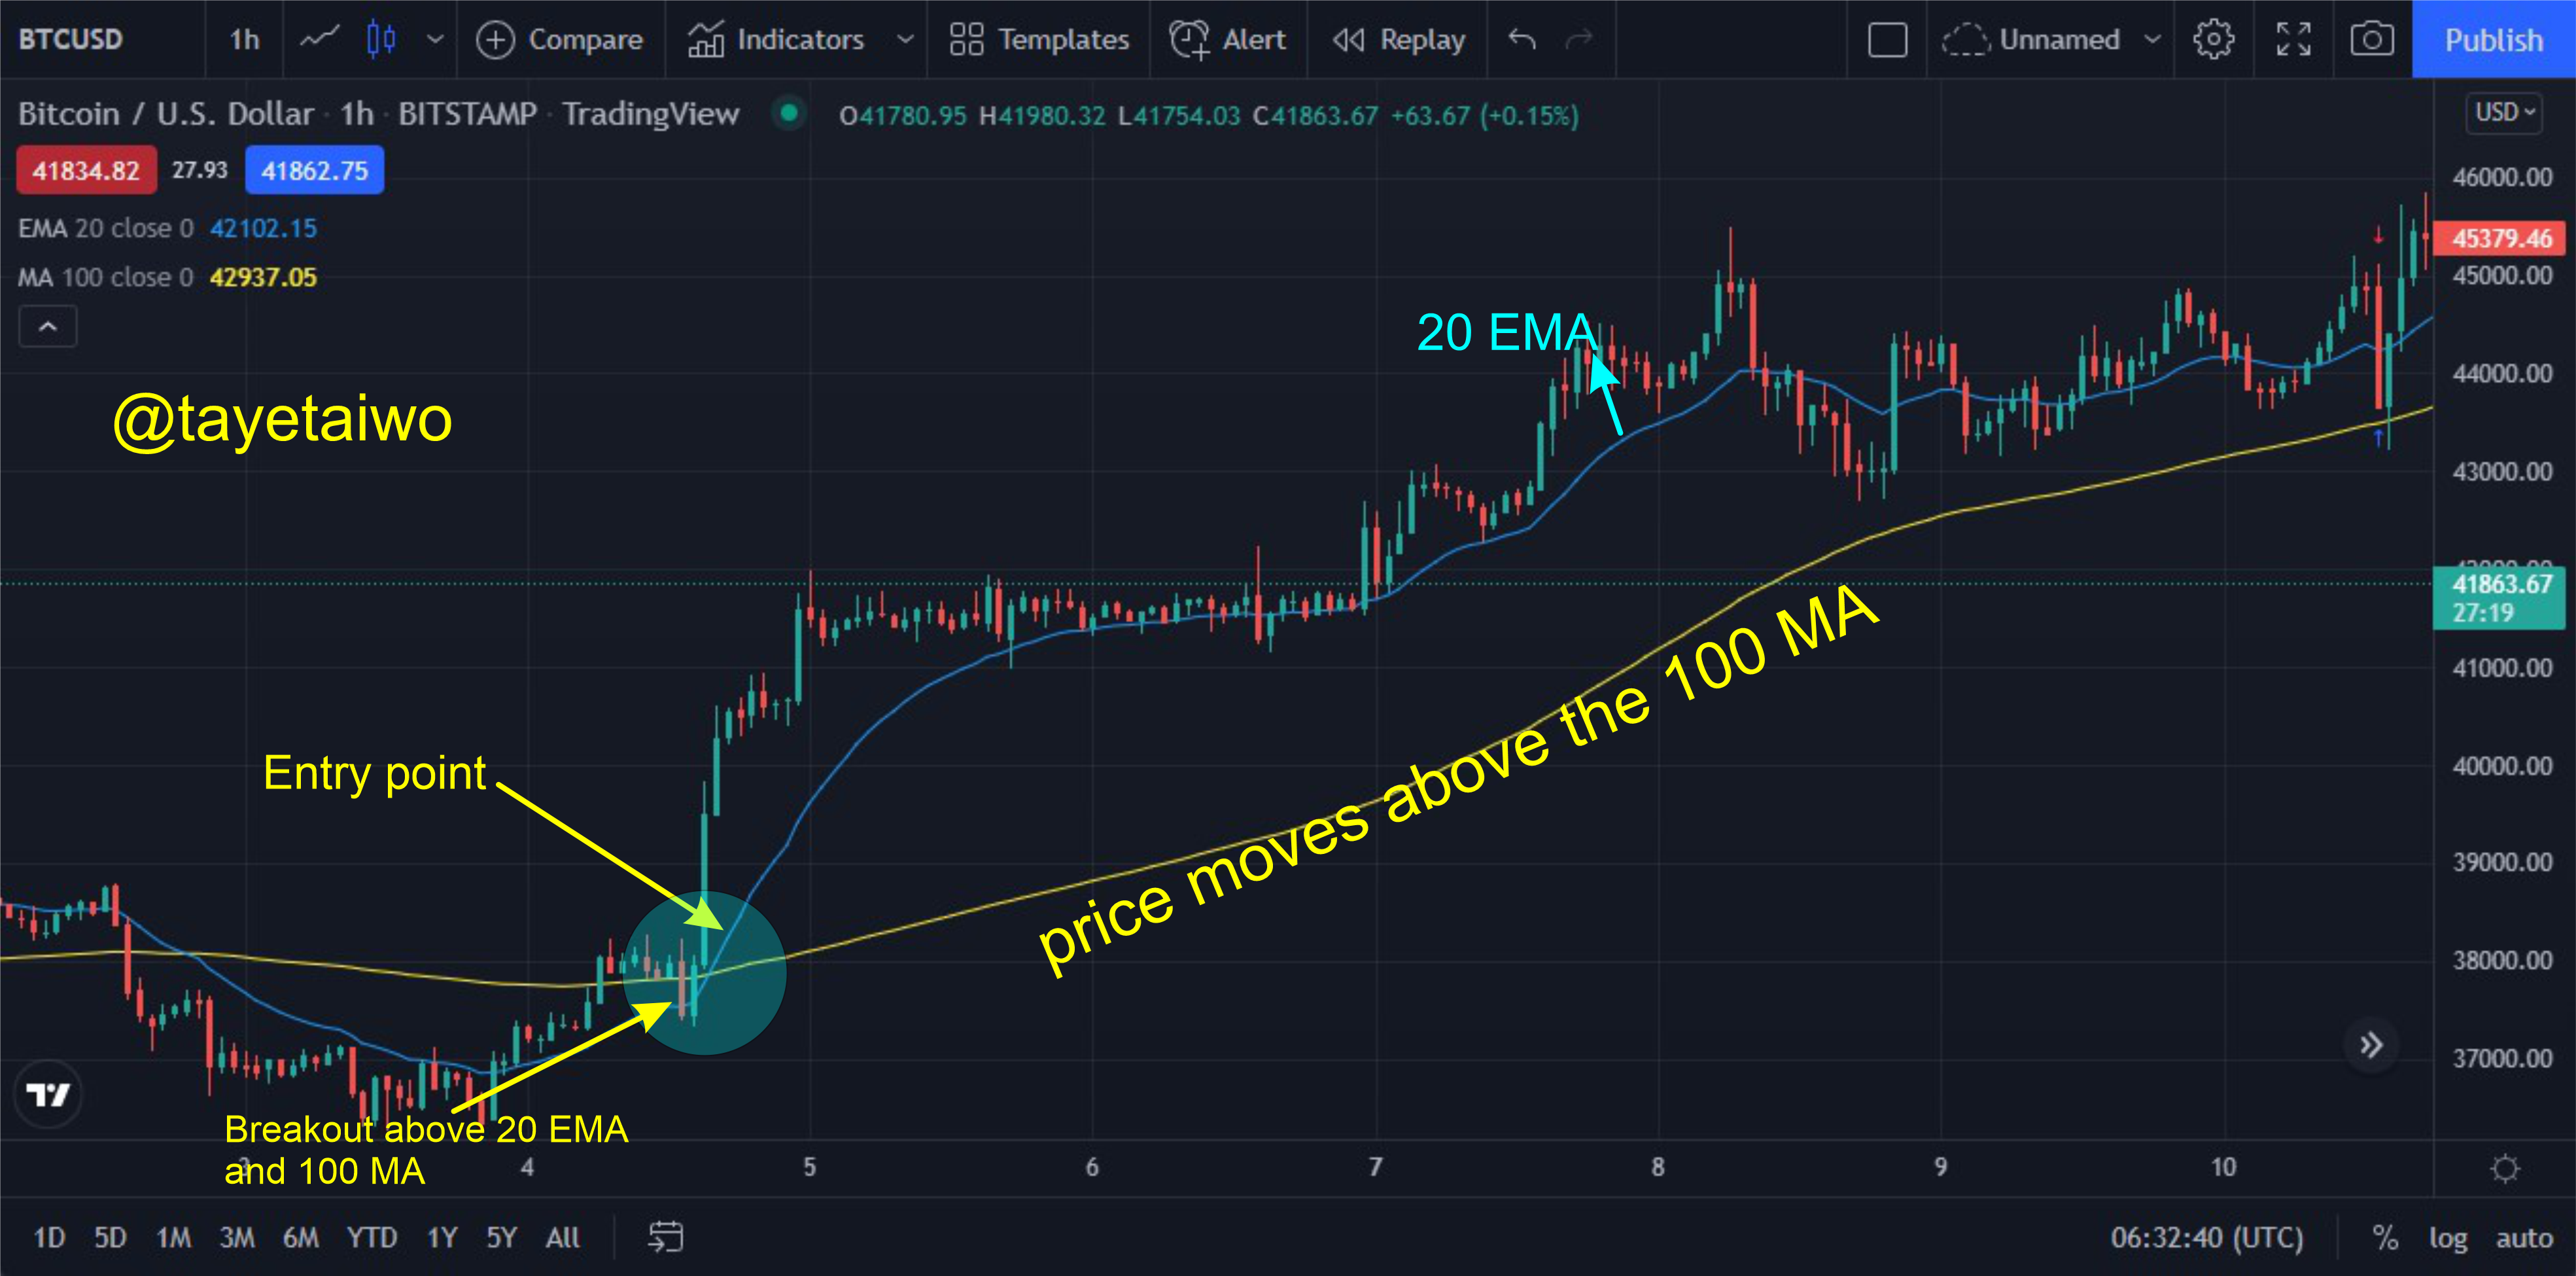
The image above shows the BTC/USD chart. For the identification of an entry point, I will be using the 100 MA and the 20 EMA indicators. The first step is to identify a dominant trend, and with the 100 MA, it is clear that the current dominant trend in the market is the Uptrend, because the price action of the asset is moving above the 100 MA which also serves as support to the price action. For an entry point to be identified the price action of the underlying asset has to breakout above the 20 EMA and the 100 MA. The 20 EMA will try to serve as more direct support for the price action and as long as the price action keeps moving above the 20 EMA it verifies the continuation of that trend.
Exit Points
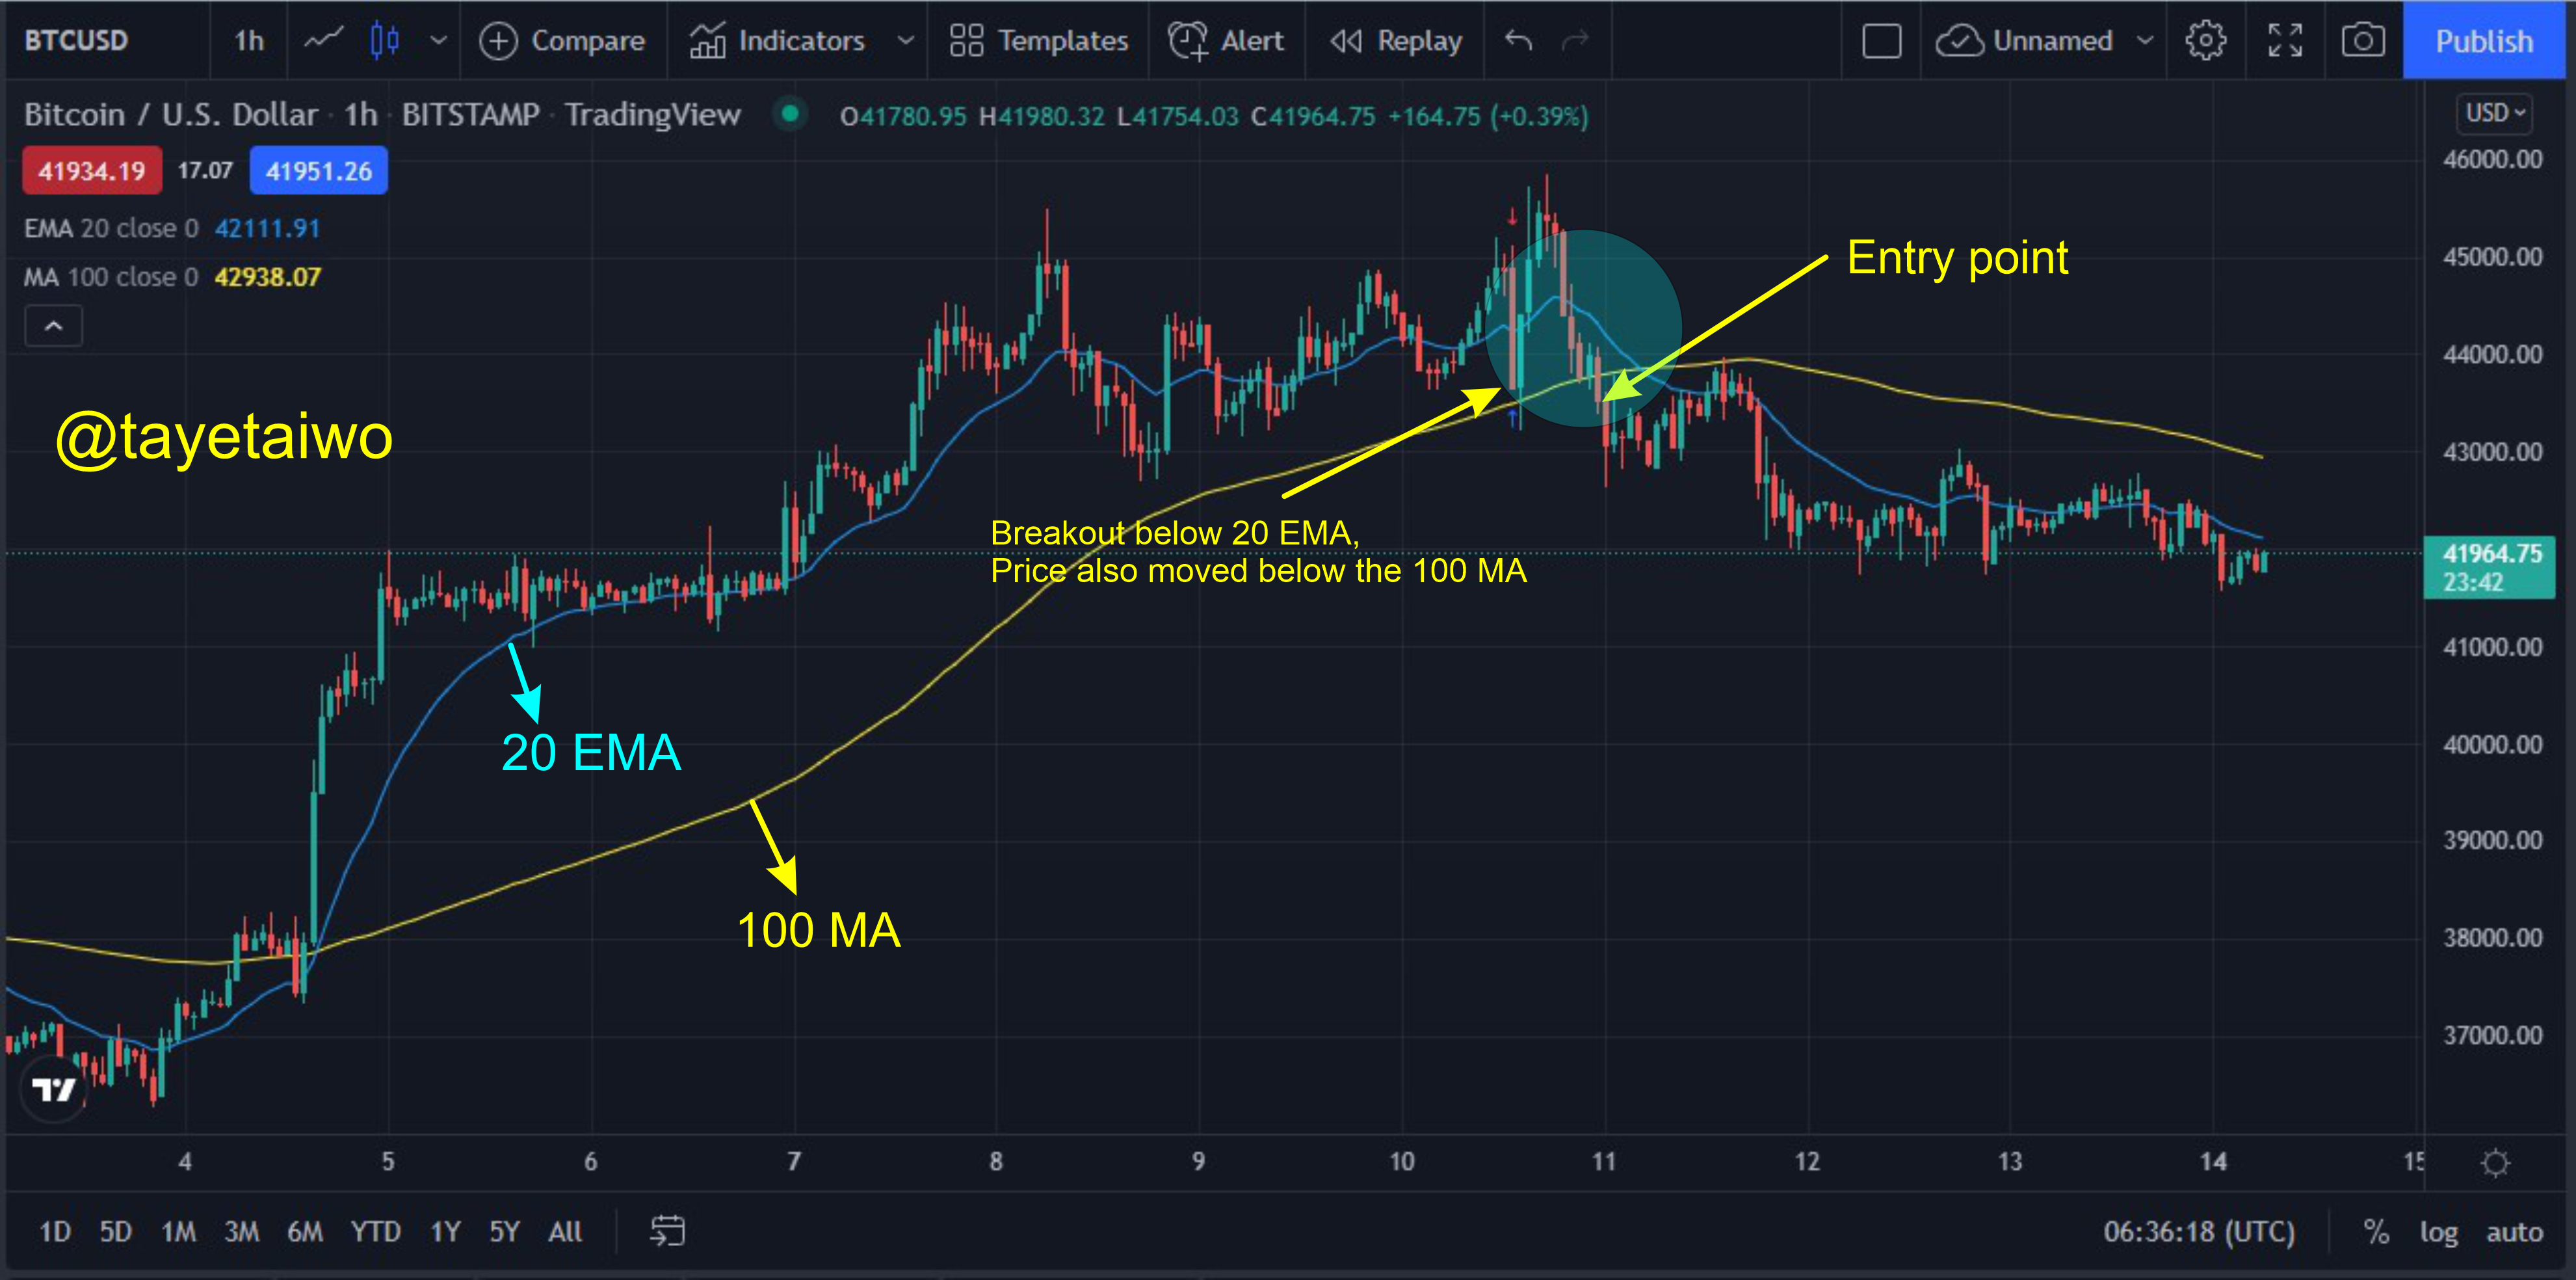
An exit point can be identified with the aid of the 100 MA and 20 EMA when there is a reversal in the price movement. Looking at the image above the price action of the BTC/USD broke below both the 20 EMA and 100 MA signalling a reversal in price movement due to the exhaustion of buyers in the market. As soon as the price was able to move below the 100 MA, it began to serve as a support to the price action.
Question (4)
What do you understand by Crossover? Explain in Your Own Words.
Crossover is a trading term that is used to identify when two corresponding indicators cross or overlap each order. This signal is used to predict the potential movement of an asset. Crossover patterns are used to identify breakouts of price action or potential price reversals in the market.
The Crossover strategy is mostly applied with the SMA and EMA, the strategy behind its use is that for a crossover to occur the lower value of an EMA has to cross above or below the larger value of the EMA thereby signalling a potential breakout or reversal.
Different periods can be used with the Crossover strategy but this will be based on the time frame the trader is using, for a scalper who uses a 9 to 21 minutes chart it is advisable to use the 5 and 15 EMA period while for a day trader it is advisable to use the 25 and 50 EMA period, but for a long term trader, it is advisable to use the 50 and 200 EMA.
There are two types of Crossovers which are the Golden Cross and the Death Cross.
Golden Cross
The golden cross is a bullish breakout that can be identified when a lower period of a Moving Average crosses above a higher period. For instance, if a 25 EMA period crosses above a 50 EMA period it indicates a potential bullish breakout and that a potential Bullrun is expected.
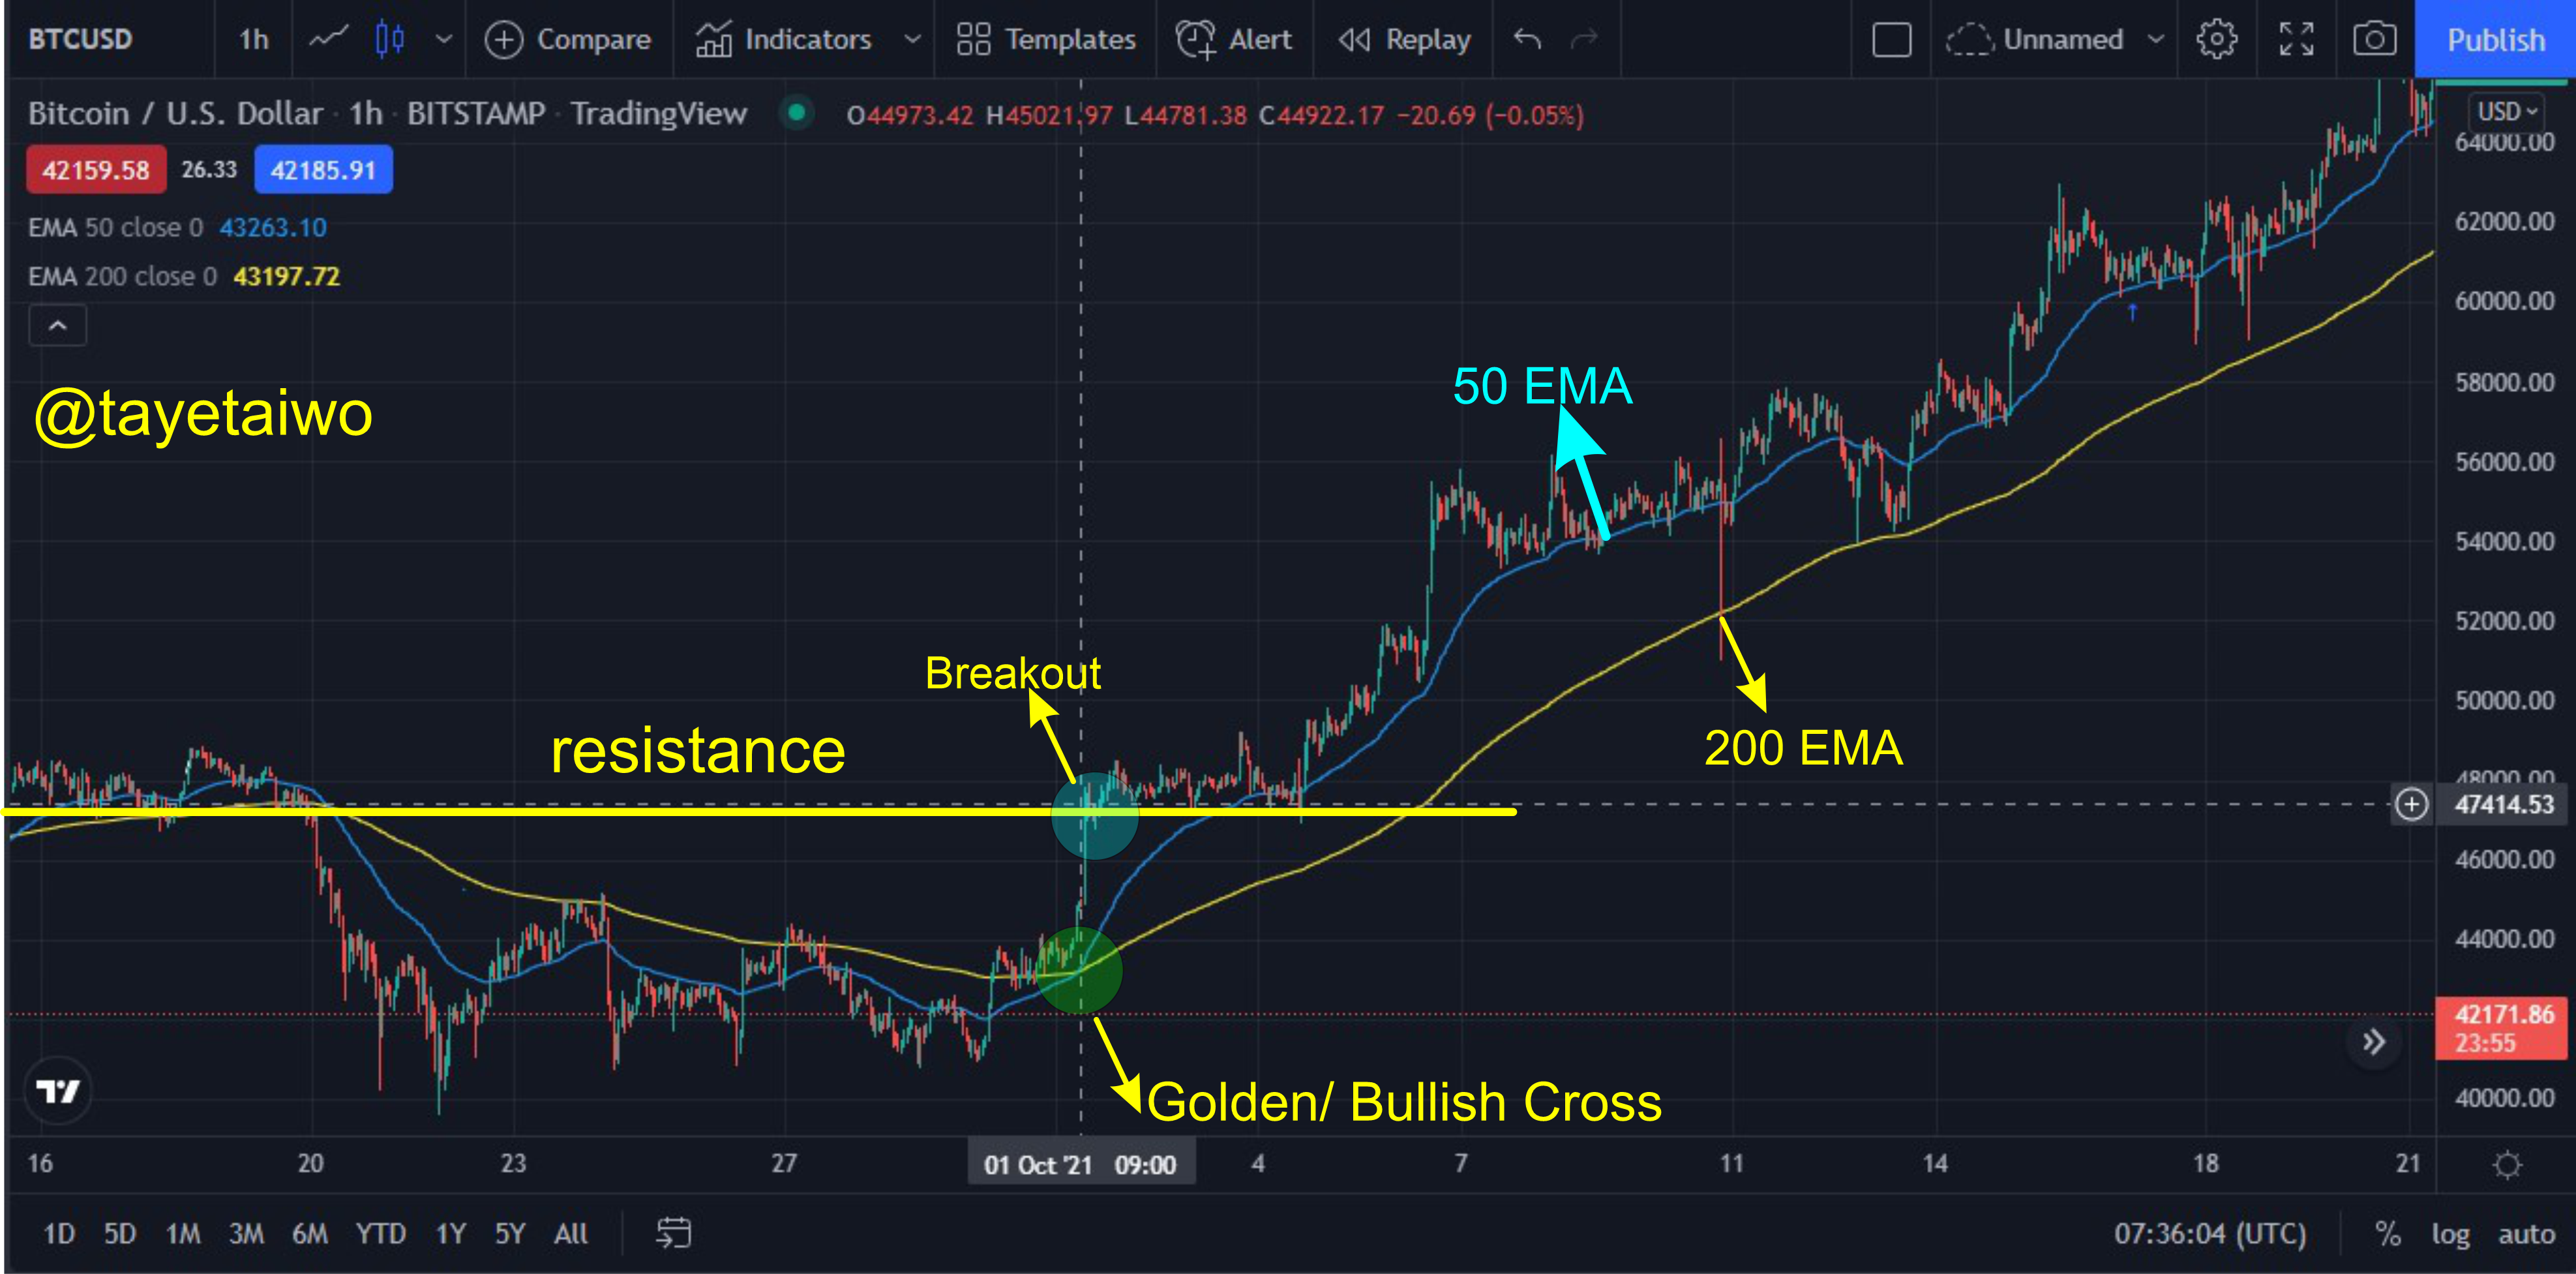
Looking at the image above, there is a clear occurrence of a Golden cross or Bullish cross because the 50 EMA was able to cross above the 200 EMA, therefore signalling a potential Bullish run. As seen above, during this crossover the price action of the asset was able to break out over the resistance level, this then initiated a Bullrun.
Death Cross
The Death cross is a technical strategy that occurs when the shorter period of a moving average crosses below the longer period of a moving average. This signifies that a potential Bear-run is eminent.
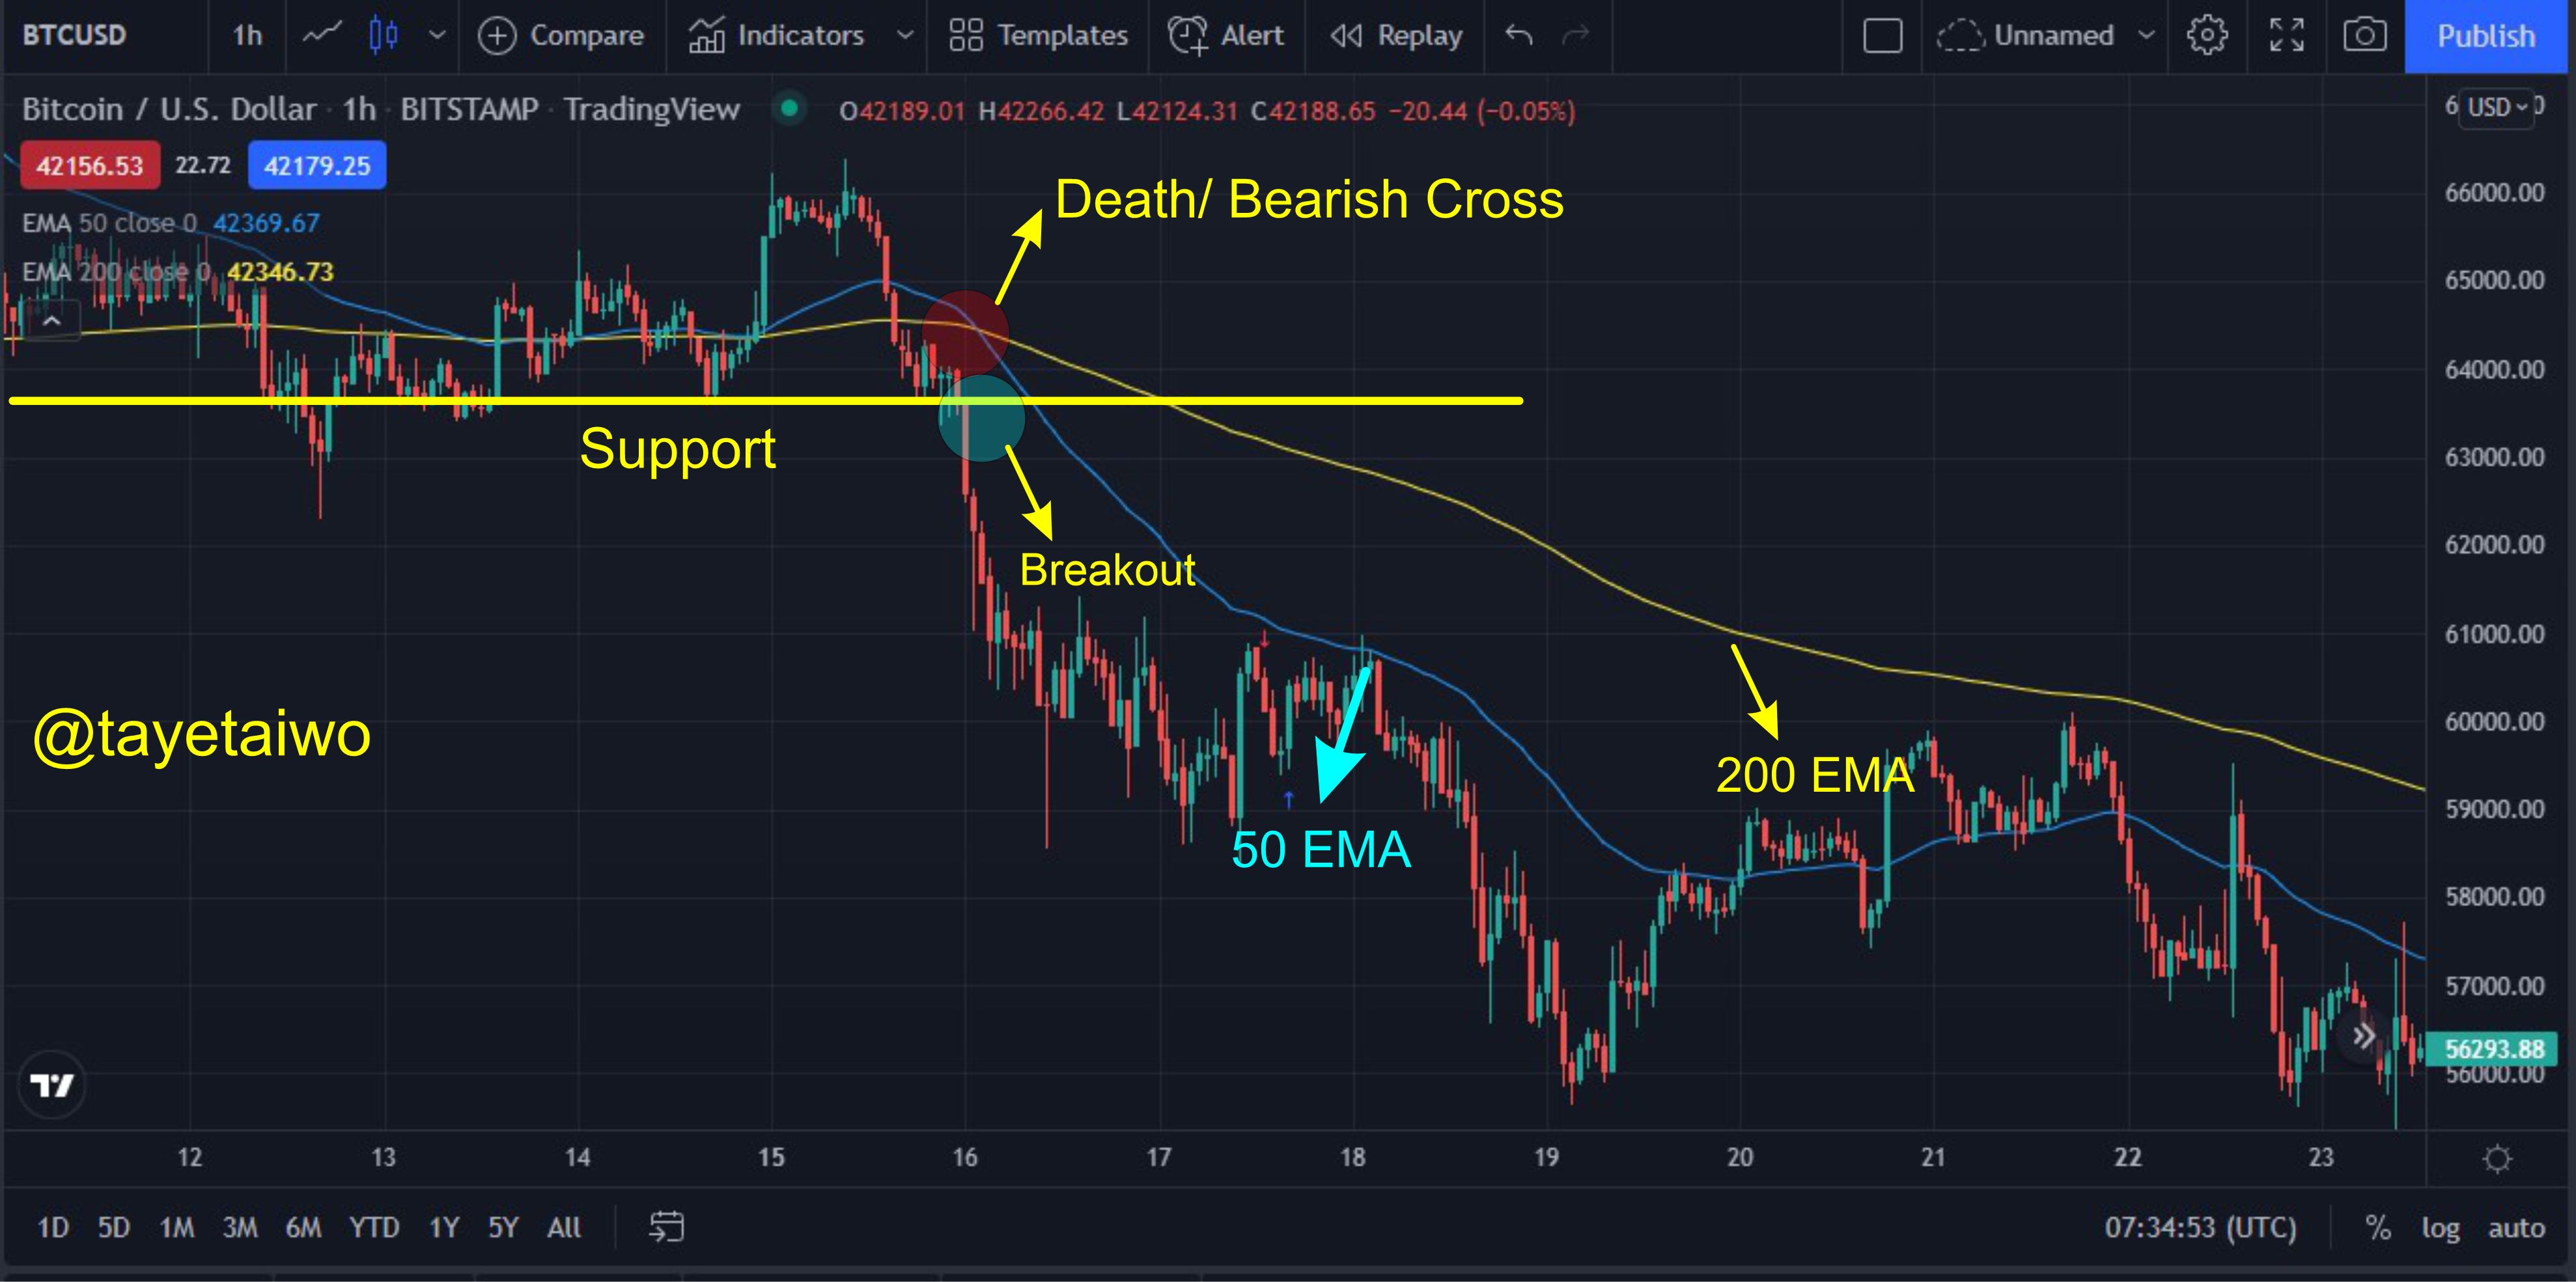
Taking a look at the image above it is clear that the 50 EMA was able to cross below the 200 EMA thereby signifying a potential breakdown below the support. During the occurrence of this cross, the price action was able to break down below the support level, thereby initiating a Bear-run.
Crossover strategy is ideally used for a trending market, this means that in a ranging market the crossover pattern is of no use because of the constant crossover that occurs within a short period.
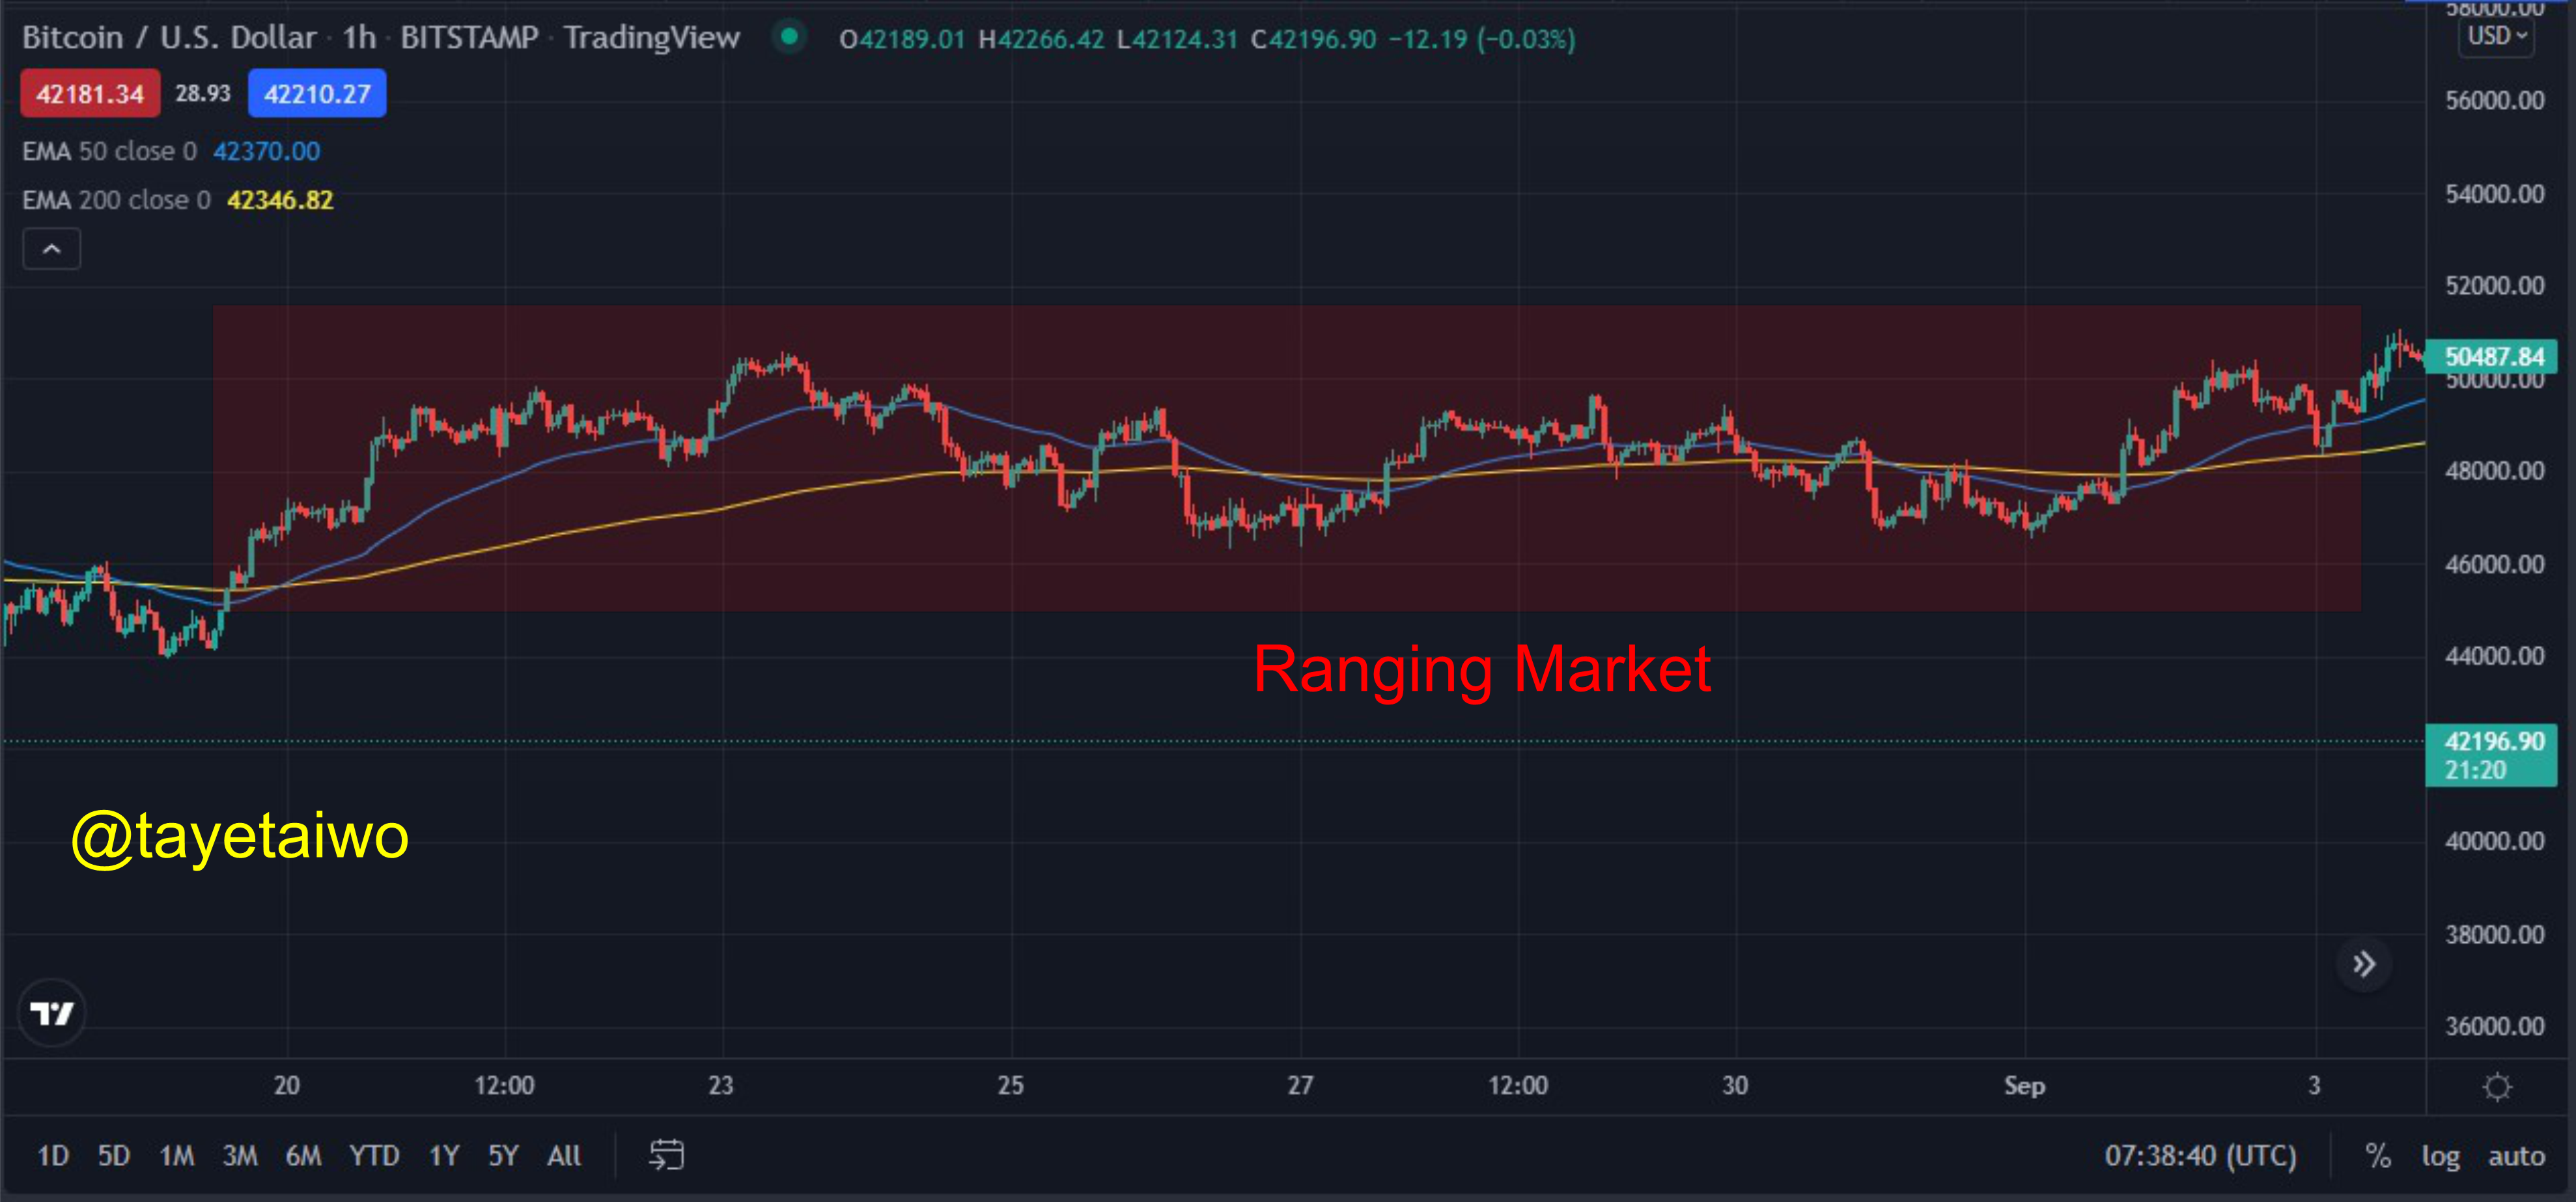
The image above shows that the cross over pattern was not able to identify a potential dominant trend as a result of the price action constantly fluctuating.
Question (5)
Explain The Limitations of Moving Average.
Every indicator has its Pros and COns and for this task, I will lay focus on the COns or shortcomings of the Moving Average indicator.
The Moving average is a lagging indicator, this means it is a trend following indicator and cannot predict the potential price movement or trend in the market when used alone.
The data that a Moving average relay is based on historical price data which collectively is irrelevant for a trader who wants credible data on the most recent price points.
The Moving average relays data that are subjective and not decisive, this means that there is no conclusive data that can be acquired when using the Moving average because it relays inconclusive price data that is solely based on Historical data that places the same weight on both old and recent periods.
An Unmodified Moving Average might be detrimental to a trader because the time frame used by each trader might differ.
Conclusion.
The Moving average is a good technical analysis tool that can be used to identify breakouts, reversals and market trends. Traders always want to trade according to the dominant trend and with the MA it is possible to identify one.
The different types of Moving averages each have an important role they play when identifying a trend or a Breakout. The EMA is used to verify the continuation of an occurring trend and also it is used for the Crossover strategy because of its quick response to price action. The Moving average when used alone is not ideal because it is a lagging indicator therefore it is advisable to merge it with a leading indicator to achieve a good analysis.