Crypto Academy Season 3 Week 7 Homework Post for (@kouba01) Trading Crypto With Average Directional Index (ADX) Indicator
This week, the professor detailed the ADX (Average Directional Index') indicator, which allows us to gain insights into the strength of the trend.
1. Discuss your understanding of the ADX indicator and how it is calculated? Give an example of a calculation. (Screenshot required)
The Average Directional Index (ADX) is an indicator used to understand the strength of a down or up trend. It was developed by J. Welles Wilder, who also developed the RSI indicator about 40 years ago. This indicator, like other indicators, produces important signals about the strength of the market if set correctly.
The main purpose of the ADX indicator is to show whether the cryptocurrency is in an uptrend or downtrend or in a horizontal position where short-term buying and selling.
The ADX indicator takes values between 0 and 100. These values show the strength of the asset in the market. ADX does not give you a clear idea that the trend is up and down. For example, if the ADX value is above 50, it means that the price change in the cryptocurrency is very strong. However, it does not give any idea whether the trend is bearish or bullish.
It will be more useful if we explain the ADX indicator between values such as 0-25, 25-50, 50-75, 75-100. I will try to find these values on the chart.
0-25: When the ADX indicator is between these values, we can understand that the trend is very weak or that the traders are buying or selling for a short time.
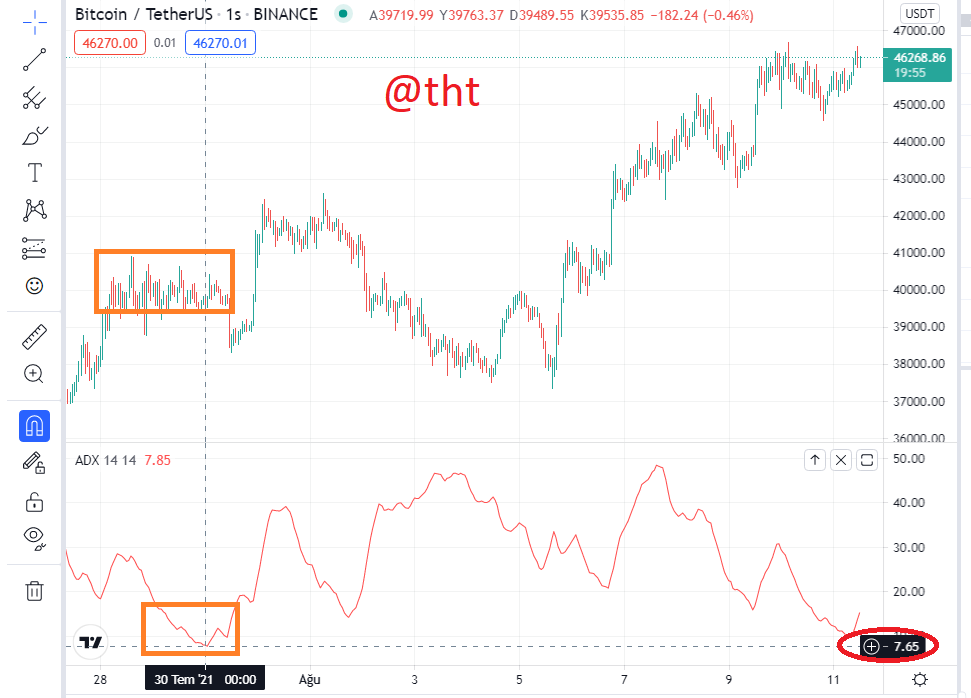
(tradingview BTC/USDT 1H Chart)
As you can see in the screenshot, the ADX value is 7.65. Short-term buying and selling transactions took place between traders. There was no drastic change in Bitcoin price.
25-50: We can talk about the existence of a strong trend.
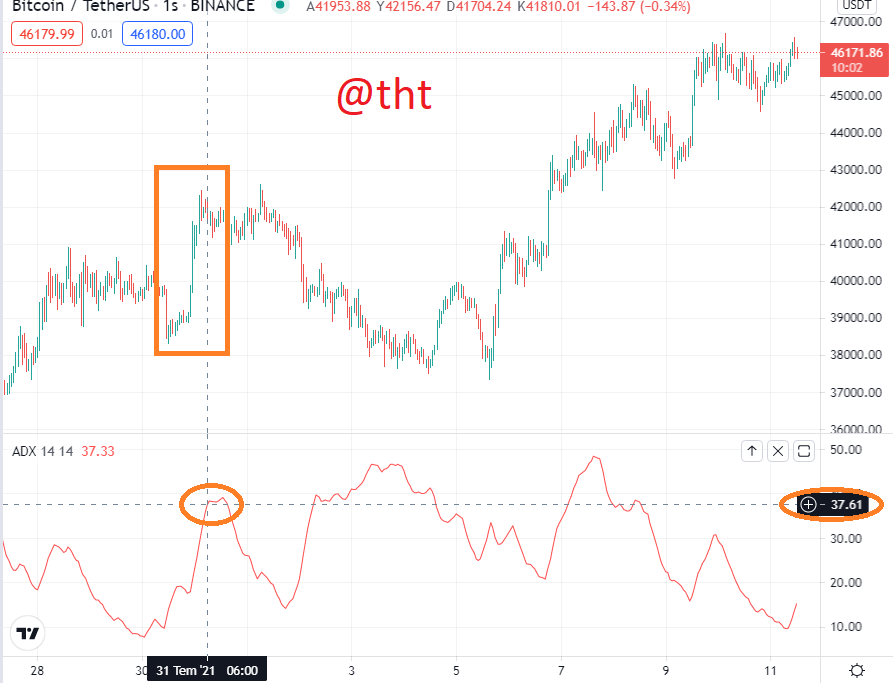
(tradingview BTC/USDT 1H chart)
The ADX value is 37.61. Where I marked in the screenshot, we see that the trend is strong and there is a sharp price movement. Bitcoin price soars from 39K to 42K.
50-75: It turns out that the trend is very strong.
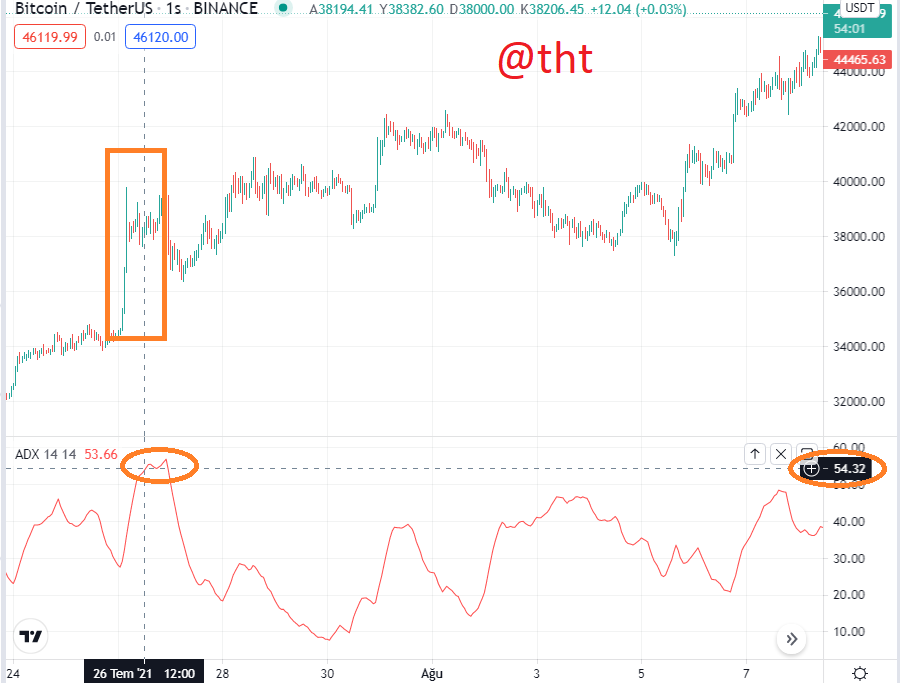
(tradingview BTC/USDT 1H chart)
The ADX value in the screenshot is 54.32. This means that the trend is very strong. BTC rose strongly from 34K to 39K. Therefore, the direction of the trend is quite strong.
75-90: Values in this range mean that the trend is extremely strong.
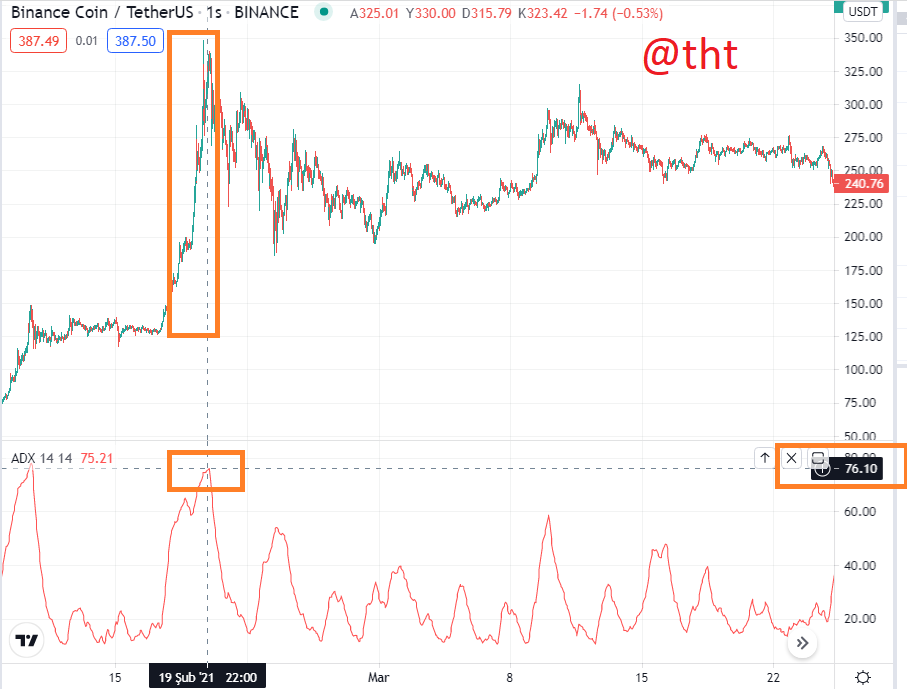
(tradingview BNB/USDT 1H chart)
On February 19, when BNB was on a steady rise, the ADX value is 76.10. During this period, BNB rose from $128 to $348. Therefore, there is a very strong trend in the market.
The ADX indicator can be used alone on the chart. But that will only tell us about the strength of the trend.
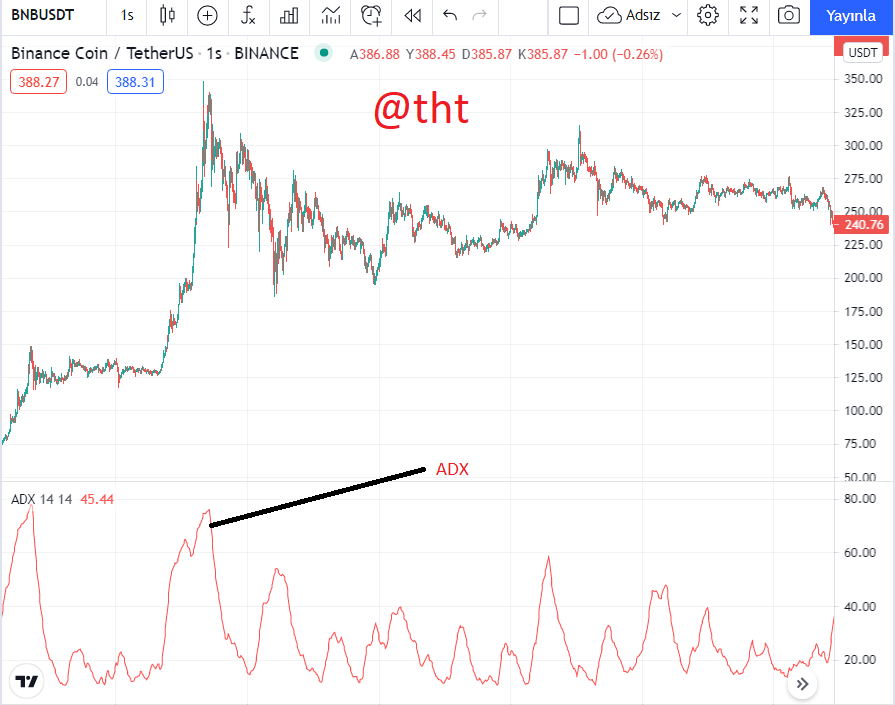
(tradingview BNB/USDT 1H chart)
ADX also informs traders that the trend has started and the trend has ended. For example, if the ADX value starts below 20 and goes above 20, it gives an idea that the trend can start. In cases where the ADX value is above 40, if the ADX value starts to fall below 40, it may mean that the trend is over.
It will be more effective when used together with the DMI (Direction movement indicator) indicator, also developed by J. Welles Wilder, to measure the direction of the trend along with the strength of the trend. DMI consists of +DI and -DI.
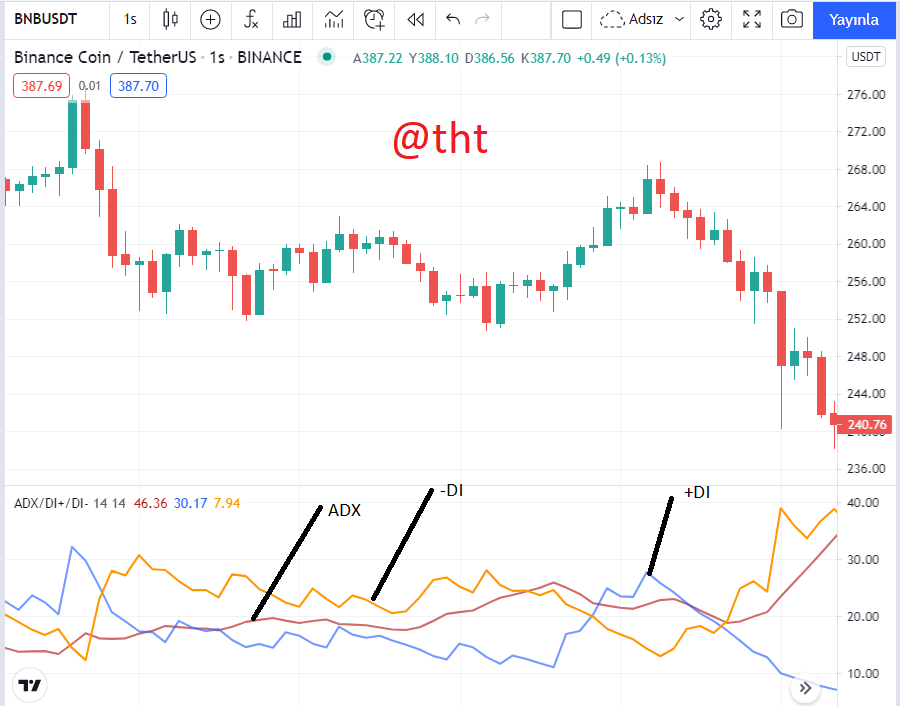
(tradingview BNB/USDT 1H chart)
The intersection of +DI and -DI lines on the chart produces a buy-sell signal. When +DI rises above -DI in the chart, a buy signal occurs. If -DI goes above +DI, it creates a sell signal. The widening of the difference between -DI and +DI, the divergence of the lines is proof that the movement is getting stronger. A decrease in the difference between the +DI and -DI lines means that the trend is weakening. It means that short-term bottoms and sells are realized.
Calculating the ADX Indicator
Calculating the ADX indicator seems a bit complicated. But I would like to explain this in the simplest terms.
DMI + and DMI- calculation
To find the +DI and -DI values, we need to learn +DMI and -DMI.
+DMI = Current High - Previous High = CH - PH
-DMI = Previous Low - Current Low = PL - CL
True range calculation
I will do 3 different operations when calculating the true range. I'll take the absolute value.
Current High (CH) - Current Low (CL)
Current High (CH) - Previous Close (PC)
Current Low (CL)- Previous Close (PC)
True Range (TR) = MAX (|CH - CL|; |CH - PC|; |CL - PC|)
DI + and DI– calculation
Now that we have learned to calculate DMI and true range, we can also do DI+ and DI- calculations. Because we need DMI and true range values to calculate them.
DI+ = DMI+/TR
DI- = DMI-/TR
DX calculation
DX =[(|+DI−|DI-|)/[(|+DI+|DI-|)×100
ADX calculation
Now that we have found +DI and +DI, we can easily calculate ADX.
ADX blends +DI and -DI, then smoothes the data with the moving average to determine the strength of the trend.
ADX = 100 times the Exponential Moving Average of the Absolute Value of (+DI - -DI) / (+DI + -DI)
or
ADX = Sum of n [((DI +) - (DI-)) / ((DI +) + (DI-))] / n
or
ADX = MA[((+ DI) - (-DI)) / ((+ DI) + (-DI))] x 100
ADX Calculation Example
Now that we know how all the steps will take place, we can make a real calculation. Let our example be related to EOS.
Current High = 4.2
Current Low = 3.9
Previous High = 3.7
Previous Low = 4.0
Previous Close = 3.5
Period = 14
a)DMI + and DMI- calculation
+DMI = Current High - Previous High = CH - PH = 4.2-3.7 = 0.5
-DMI = Previous Low - Current Low = PL - CL = 4.0 -3.9 = 0.1
b) True range calculation
Current High (CH) - Current Low (CL)
Current High (CH) - Previous Close (PC)
Current Low (CL)- Previous Close (PC)
True Range (TR) = MAX (|CH - CL|; |CH - PC|; |CL - PC|)
TR = MAX (|4.2 - 3.9|; |4.2 - 3.5|; |3.9 - 3.5|)
TR = 0.3 ; 0.7; 0.4
TR: 0.7 . The absolute value of the highest result.
c) DI + and DI– calculation
DI+ = DMI+/TR = 0.5/0.7 = 0.714
DI- = DMI-/TR = 0.1/0.7 = 0.142
d) DX calculation
DX =[(|+DI−|DI-|)/[(|+DI+|DI-|)×100
DX= (0.714-0.142)/( 0.714+0.142)x100
DX= 0.572/0.856x100
DX= 66.82
e) ADX Calculation
ADX = Sum of n [((DI +) - (DI-)) / ((DI +) + (DI-))] / n
ADX = 14 [((0.714) - (0.142-)) / ((0.714 +) + (0.142-))] / 14
ADX= 1.49
The direction of the trend is weak as the ADX value is between 0-25. It means that traders are making short-term trades.

2. How to add ADX, DI+ and DI- indicators to the chart, what are its best settings? And why? (Screenshot required)
To add ADX, DI+ and DI- indicators to the chart, it is necessary to visit the Tradingview site.
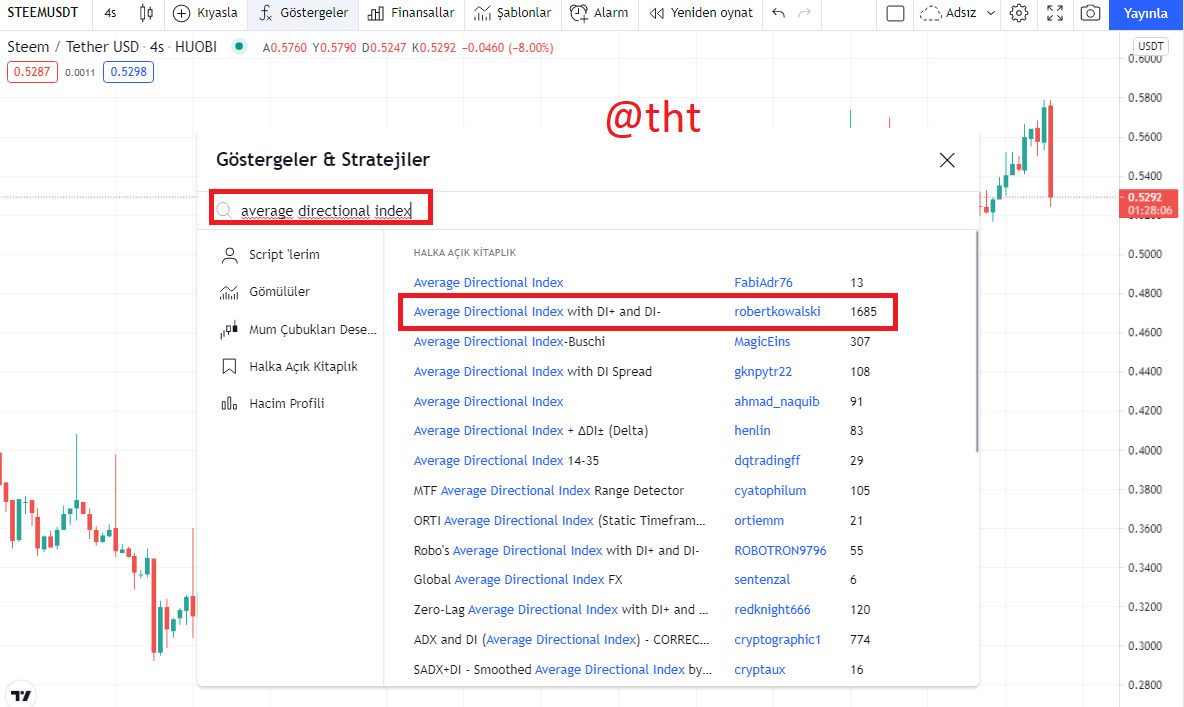
I clicked on "fx" at the top. Then I wrote ''average directional index'' in the blank. Then I clicked on the indicator that appeared in the search result.
To configure, it is necessary to hover over the indicator and click on settings.
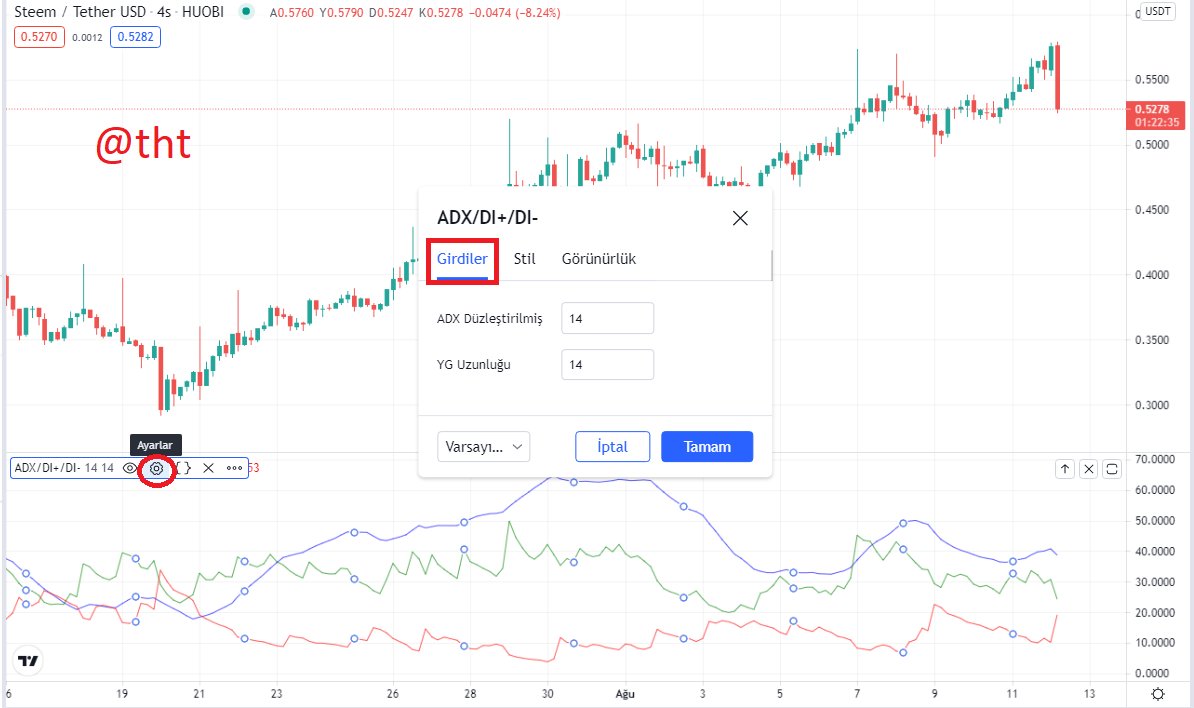
Length: Usually with the gauges set to length 14. This length will vary according to the trading strategy of the traders.
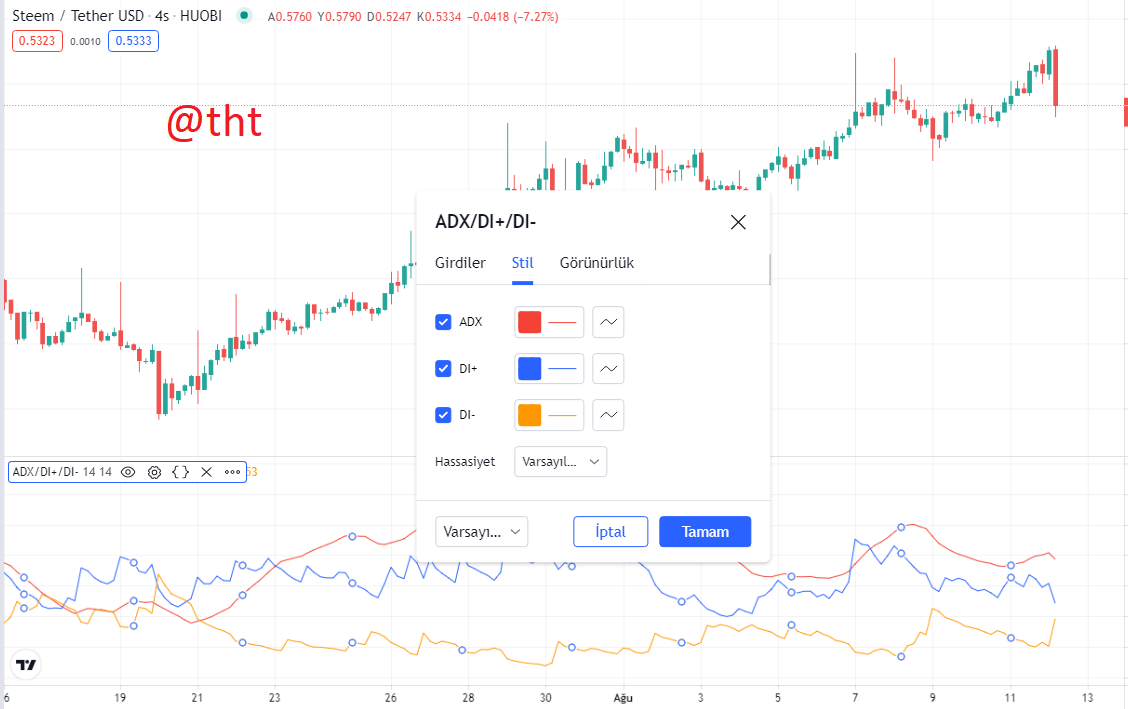
Style: Selecting ADX, DI+ and DI- indicators in different colors will help us analyze the graph better. In general, red color is chosen for ADX, blue color for DI+ and orange color for DI-.
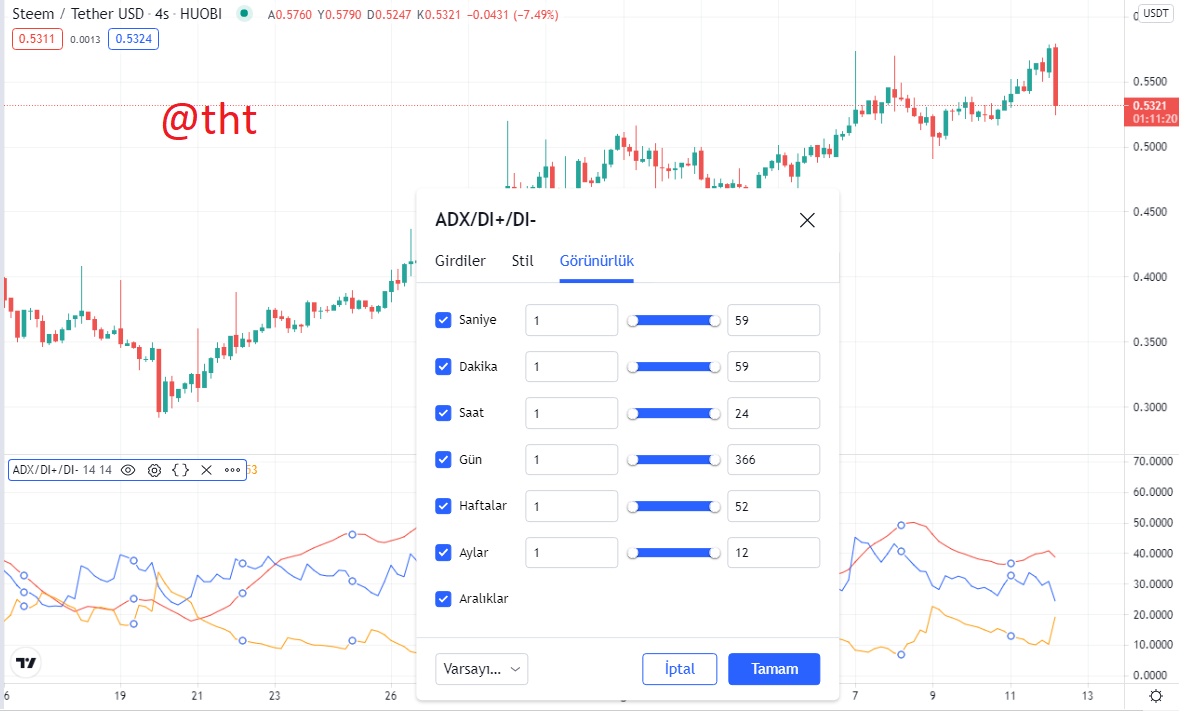
Visibility: Here are the settings for time zones such as seconds, hours, minutes, days. I checked the settings are correct.
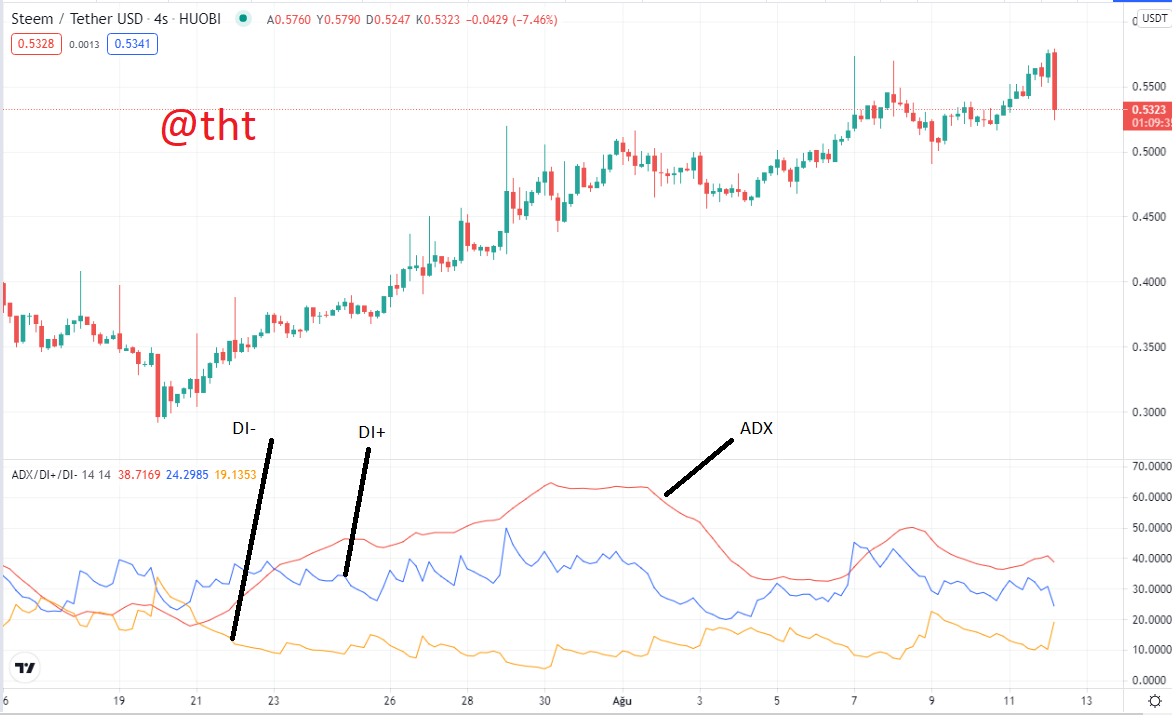
I made all the adjustments and this is how the dashboard looks like. I have shown the ADX, DI+ and DI- indicators in the graph.
Best Settings For The ADX Indicator (Why It Is Best Best)
The default setting in the ADX indicator is 14. Other settings are also available. It depends on the trader's trading strategy. But you have to practice whether it will be profitable for you. When we choose shorter periods in the ADX indicator, we get too many signals. At lower settings, the indicator will be more sensitive to price movements. In this case, the generation of false signals will increase.
When choosing a longer period, false signals are reduced. However, in this case, receiving the signals will be delayed.
Now I will show the shorter term and longer term settings on the chart.
ADX Periyod 7: I set the period to be shorter. Let's see if there is really too much signal generation in short time adjustments.
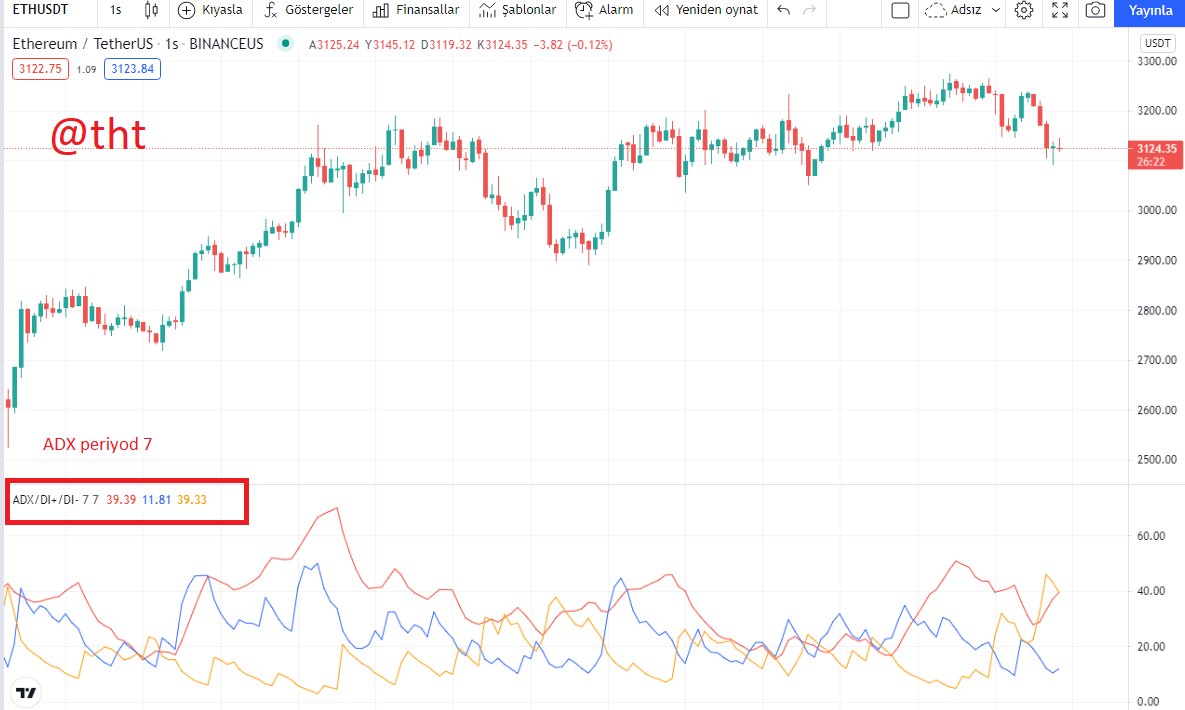
As you can see in the screenshot, the indicator price reacts quickly. As a result of the rapid response, too much signal generation has occurred. Excessive signal generation is also false signal generation.
ADX Periyod 30: I chose a longer time interval. In such cases, the signal generation will be reduced.
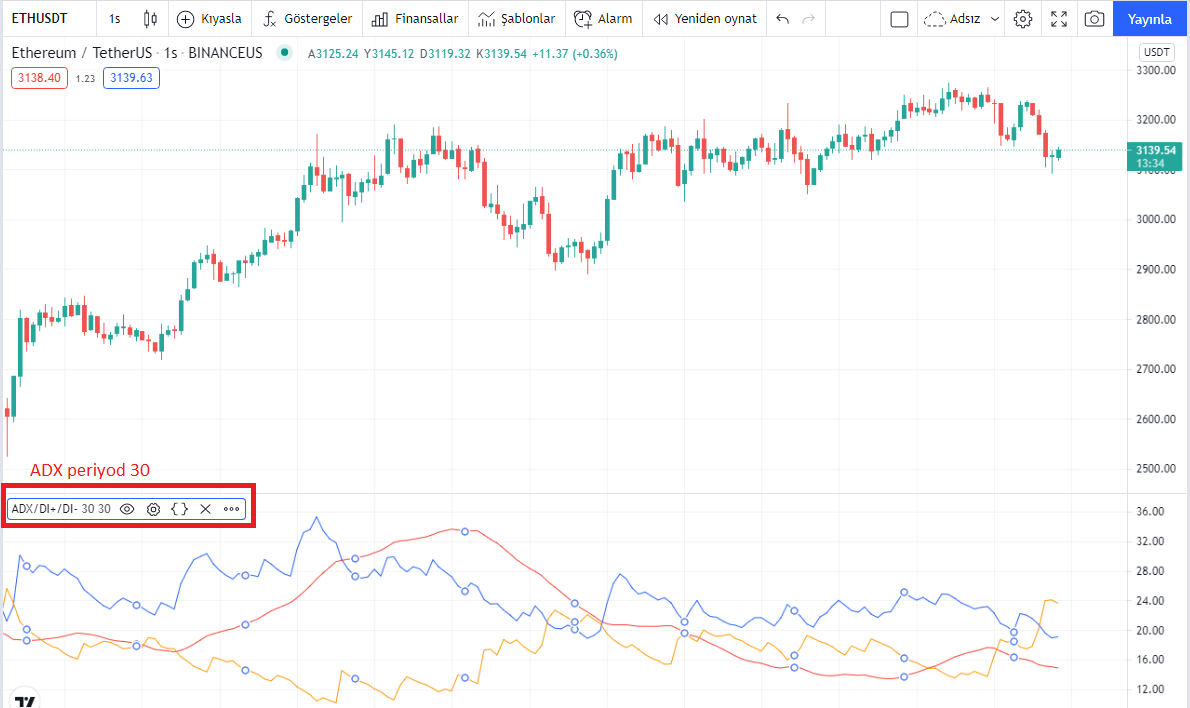
When we make a longer time adjustment, the signal generation will decrease compared to a shorter time adjustment. When signal generation is reduced, false signals will also decrease. However, long time adjustments will cause delays in signal generation.
ADX Periyod 14: The default setting is 14. Signals are considered to be received more efficiently.
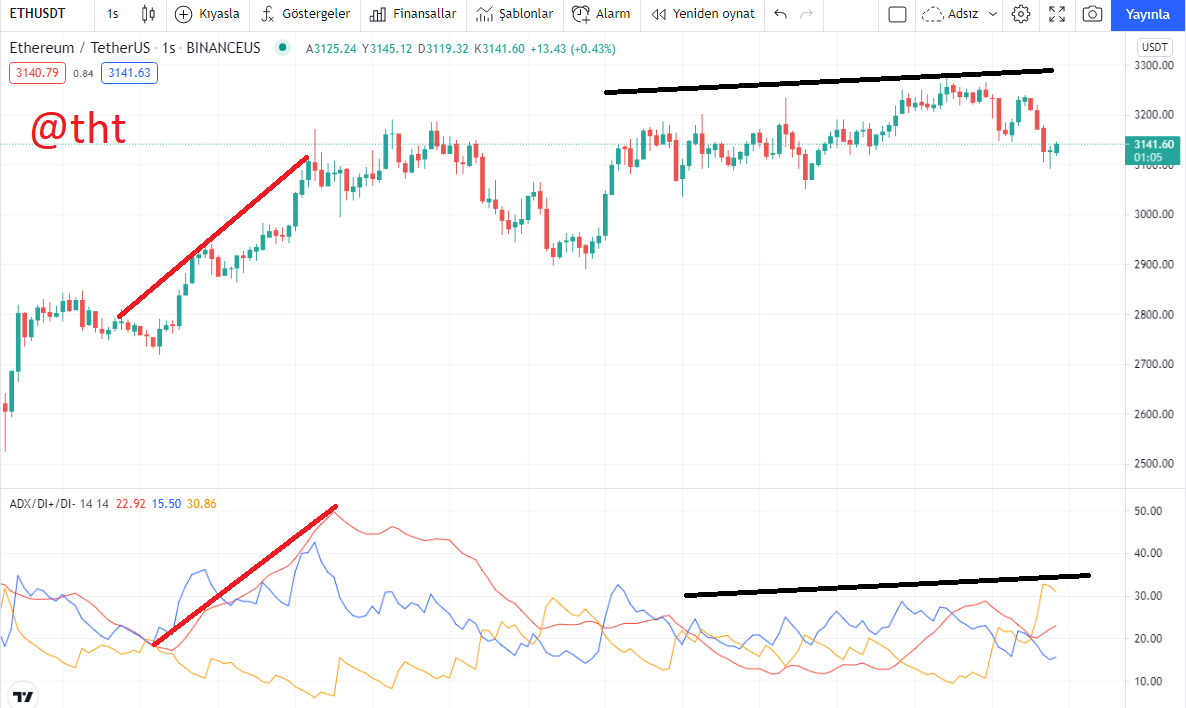
As you can see in the screenshot, when we set the period to 14, there is a harmony between the indicator and the price movement. During the price increase, the ADX value increases with the strength of the trend. In short-term trades, the ADX value remains constant.
The settings of the ADX indicator vary according to the strategies of the traders, their use case along with other indicators. therefore, the most appropriate adjustment is the one that traders make the most of.
If you are a trader who trades on short timeframes, setting the period to 7 may be beneficial for you. Conversely, if you are a trader who trades on long timeframes, you can set the period to 30. Of course, there is one thing you should not forget. Both short-term periods and long-term periods have their disadvantages. False signal generation is high in short time periods. In long time periods, the indicator will become a lagging indicator. You will have a hard time getting a signal. It would be wrong to use the ADX indicator outside of time periods 7-30.
There is no best setting in the ADX indicator. It will vary according to the working style of the traders. The main purpose of the indicator is to measure the strength of the trend.
When using the ADX indicator, it will be more appropriate to combine it with indicators such as RSI, MACD, Vortex, Bollinger Bands. No indicator is 100% accurate. It provides us convenience when buying and selling.
3. Do you need to add DI+ and DI- indicators to be able to trade with ADX? How can we take advantage of this indicator? (Screenshot required)
The ADX indicator, when used alone, gives information about the strength of the trend. It gives an idea of how strong it is when there is a decrease or a rise. Therefore, the ADX indicator does not provide information about the direction of the trend. Therefore, it would not be right to trade with the signal it gives about the strength of the trend.
When we apply the DI+ and DI- indicators together with the ADX indicator to the chart, we can get signals about the direction of the trend along with the strength of the trend. So we will also need to use the DI+ and DI- indicators to get an idea of the direction of the trend.
When the DI+ indicator swings upwards, it means that there is an increase in the asset price, and when the DI- indicator swings upwards, there is a decrease in the asset price.
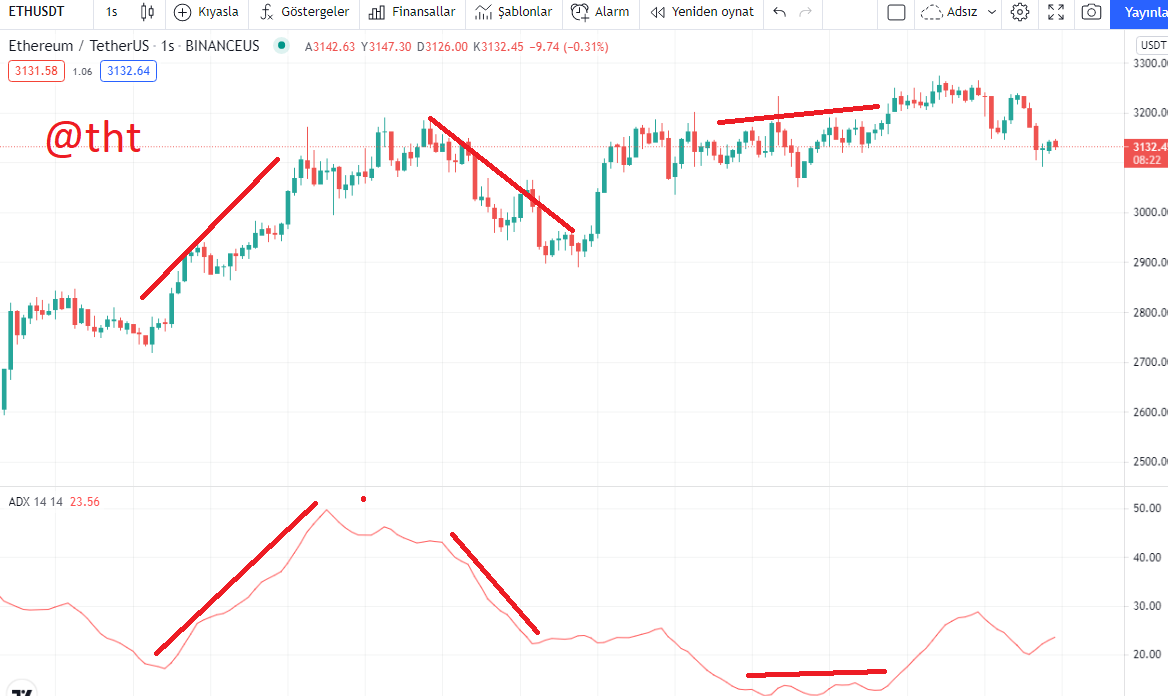
The ADX indicator is as shown in the screenshot when used alone. In sharp price movements, its value increases, in short-term trades, the value of the ADX indicator decreases. The ADX indicator has a value between 0 and 100. The higher the ADX value, the stronger the trend becomes. When the ADX value decreases, the strength of the trend decreases. According to some, it also means that the trend has changed its direction.
The ADX indicator, when used with other indicators, gives us a clearer idea of the direction of the trend.
It will be more efficient to use the ADX indicator together with the RSI in determining the direction of the trend. Because both indicators have been developed by J. Welles Wilder.
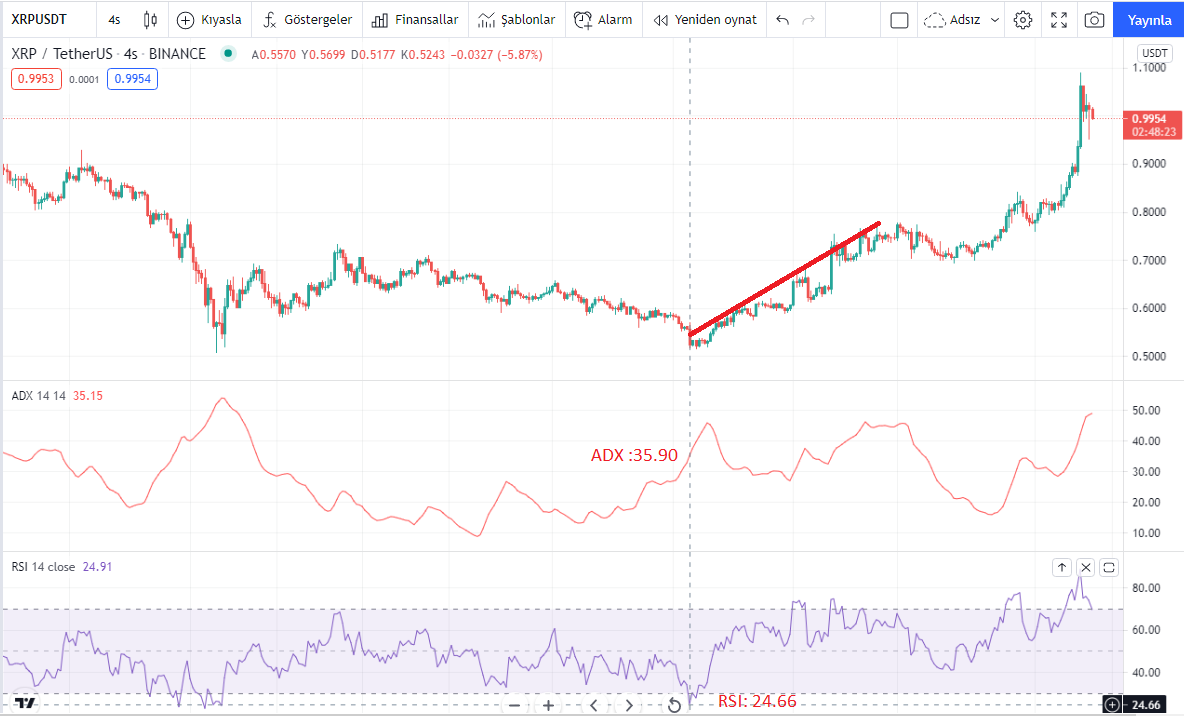
I applied both the ADX and the RSI indicator to the chart. I set the chart to 4 hours. Then I checked the signals.
As you can see in the screenshot, the RSI indicator is 24.66. This is a buy signal. The ADX indicator value is 35.90 which means the trend is strong. Therefore, this level is suitable for purchase. When we check the chart, we can see that the price increase has taken place after a while. Therefore, the signal given by both the RSI and the ADX indicator is correct.
Now I will also use the ADX indicator along with the MACD indicator.
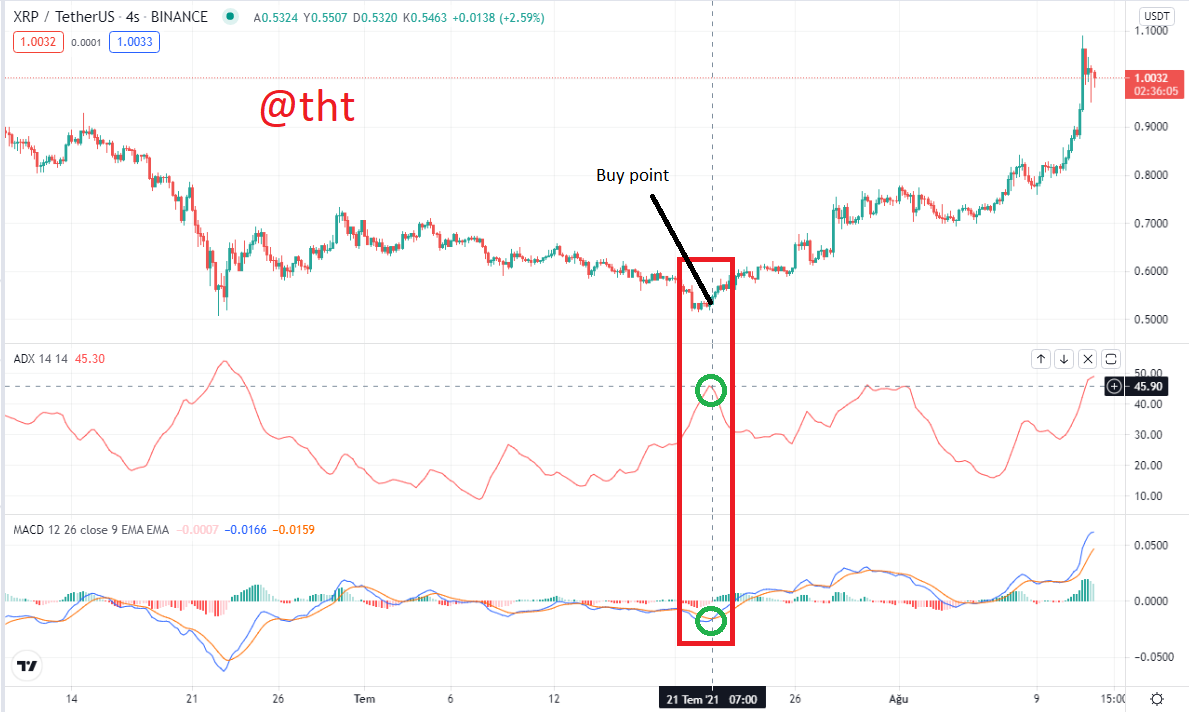
The ADX indicator value is 45.90. This means that the trend is strong. If the value goes a little higher, we will start to think that the trend is too strong.
On the lower side, we are looking at the MACD indicator. The MACD line has crossed the signal line upwards. This is a buying opportunity.
When we examined the chart, the XRP price started to increase after a while. Therefore, the ADX and MACD indicator worked harmoniously. We also applied the RSI indicator to the same chart, which gave the buy signal.
Therefore, we can use the ADX indicator separately from the DI+ and DI- indicators together with the RSI and MACD indicators.
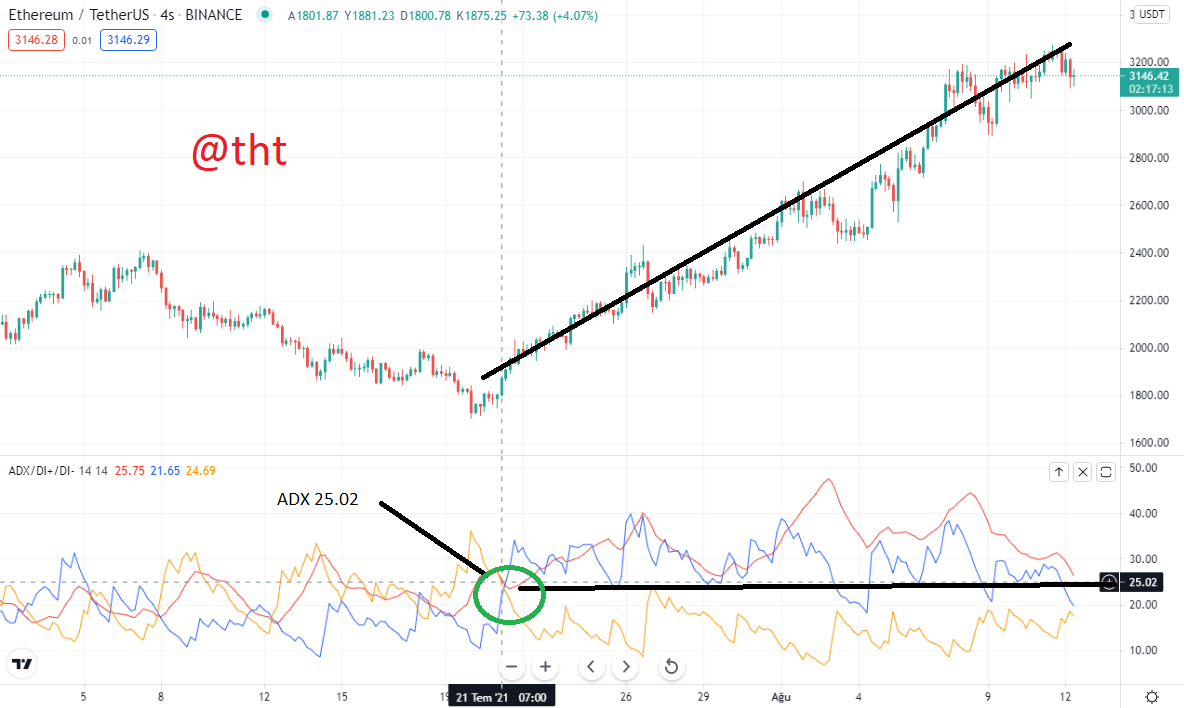
I found a very nice graphic. 4-hour chart of ETH/USDT. Along with the ADX indicator, I also applied the DI+ and DI- indicators to the chart.
Where I marked on the chart, the ADX value is 25.02. This means that the trend is strong. The DI+ line has crossed the DI- line from the bottom up. This means that the price will increase. For a very long time, the DI+ line is up and the DI- line is down. This gives us an idea of the direction of the trend. As the DI+ line crosses the DI- line from the bottom up and the DI+ line crosses upwards, the price increase has occurred. The fact that the ADX value is 25.02 also gives an idea about the strength of the trend.
As you can see on the chart, when the DI- line is up, the trend is bearish. Again, when the DI- line crossed the DI+ line from the bottom up, the price of ETH decreased.
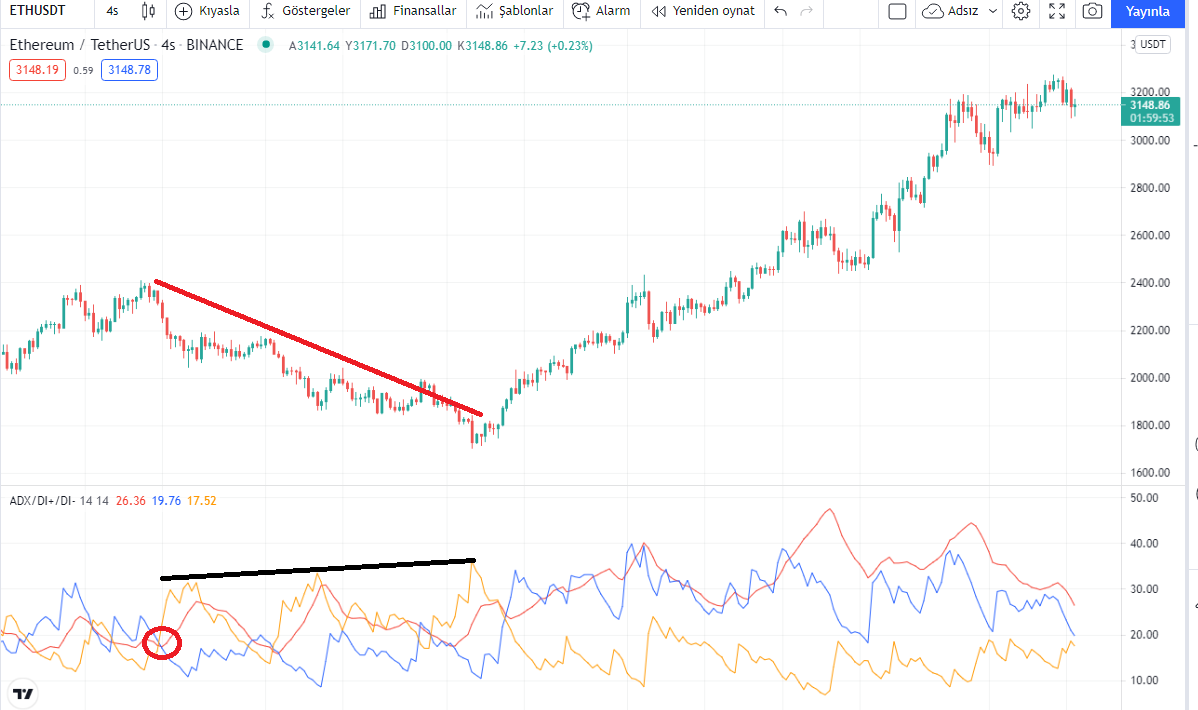
When we apply the ADX, DI+ and DI- indicators to the chart, we can get an idea of both the strength of the trend and the direction of the trend.
Also, as the difference between the DI+ and DI- lines increases, we get an idea of the strength of the trend. When the difference between the DI+ and DI- lines decreases, it means that the trend is weak and the ADX value is also low. When the difference between the DI+ and DI- lines out, the trend is strong and the ADX value is also high. You can see this clearly in the chart.
4. What are the different trends detected using the ADX? And how do you filter out the false signals? (Screenshot required)
We can detect different trends using the ADX indicator. In fact, in the first question, I briefly explained this on graphics. Now it's time to explain in more detail!
Trend Weak: We know that the trend is weak when the ADX value is between 0-25. During this period, the strength of the trend is weak. Price action does not occur sharply downwards or upwards.
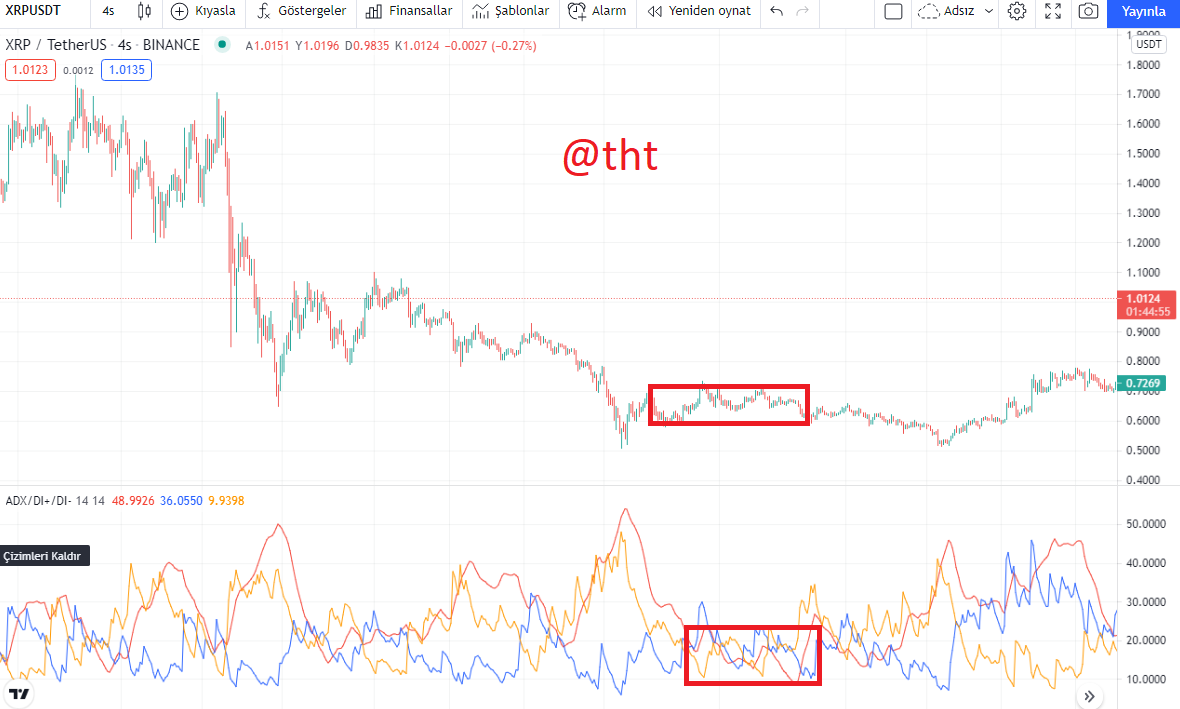
On June 28, the price of XRP was $0.63. When we look at the date of July 3, the price of XRP is about $0.66. In this process, there was a sharp price fluctuation in the price of XRP. Therefore, the ADX value remained between 0-25.
In periods when the trend is weak, buyers and sellers have difficulty in establishing superiority over each other and there is no price change. As such, the ADX price remains between 0 - 25. Thus, it is understood that the trend is weak. DI+ and DI- indicators are also very close to each other during this period. The price is consolidated here.
Strong Trend: When ADX is between 25-50 values, it means that the trend is strong. Price movements change drastically. It can also be in the form of a decrease or an increase.
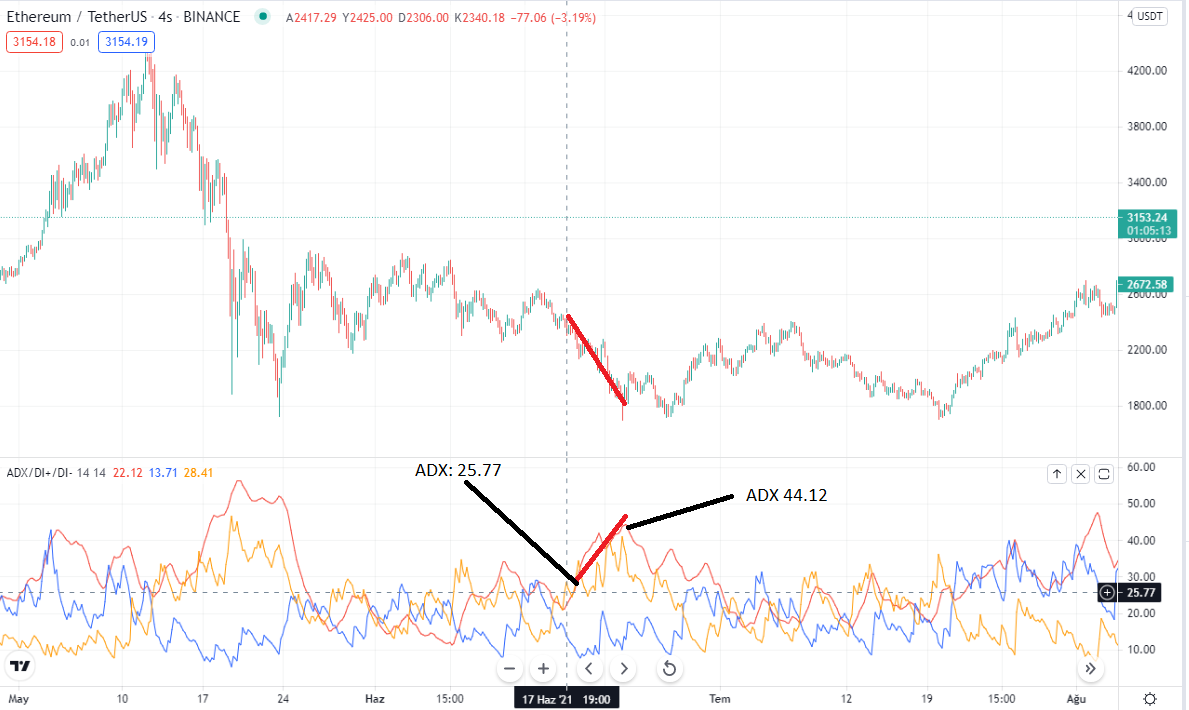
On June 28, 2021, the ETH price continues to fall. The ETH price at that time was $2625. The ADX value is 25.77 . So the trend is strong. Afterwards, the ETH price continues to decline. ETH price drops to $2200. Meanwhile, the ADX value is 44.12.
So when the ADX value is in the range of 25-50, the trend is strong. The direction of the trend can be up or down. Although the price changes are not very strong, there is a significant activity in the market. You can see that the distance between the DI+ and DI- lines increases. As there is a bearish trend in the price, the DI- line is at the top and the DI+ line is at the bottom.
Very Strong Trend: The ADX value will be in the range of 50-75. When it is between these price values, we can talk about the existence of a very strong trend in the market. Rapid price changes, high volumes occur.
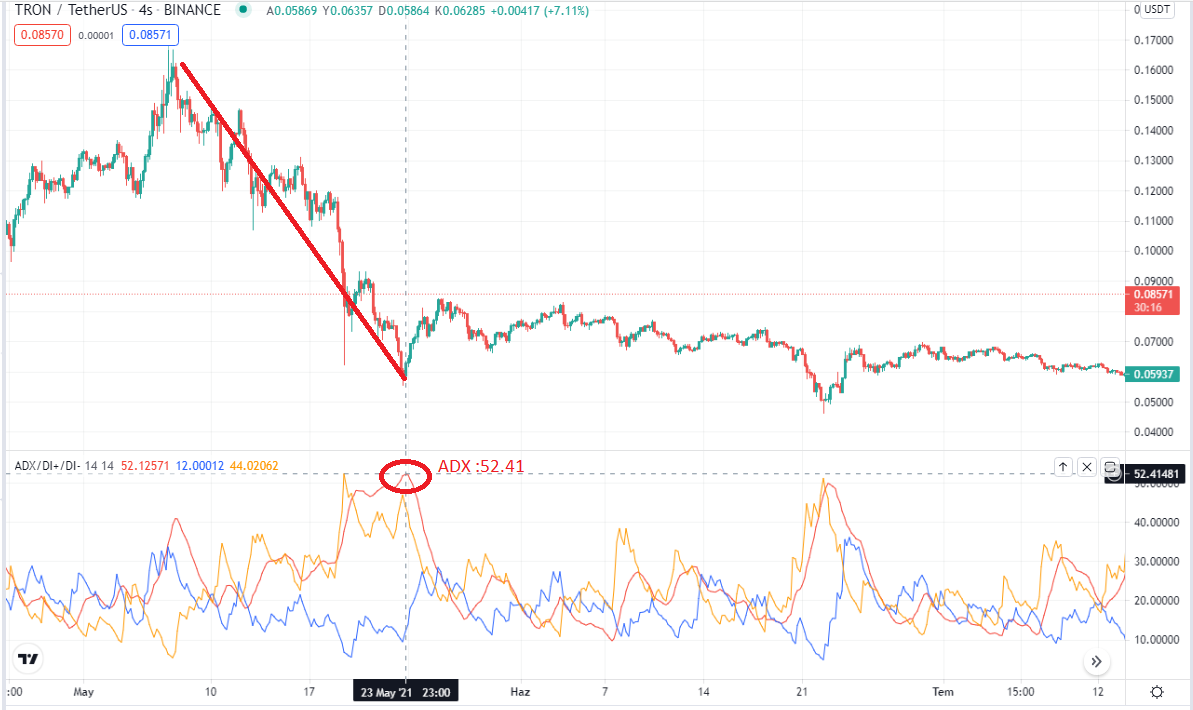
After the sharp drop in June, the ADX value reached 52.41. We can understand that the trend is quite strong. Because at that time, the price of all cryptocurrencies, including XRP, fell sharply. As there is a bearish trend in the market, the DI- line is up and the DI+ line is down. Since the ADX value is high, the difference between the two lines is also quite large. It is rare that the ADX value is between 50-75. Therefore, after the 50-75 range, there is usually a change in the direction of the trend. If you look closely at the chart, XRP price started to rise after a while.
In addition, support and resistance points between these values are also broken.
Extremely Strong Trend: There is a very strong trend. The ADX indicator shows the 75-100 range. This is quite rare. It happens in a very short time. Sudden and sharp price changes cause this. The news in the market creates panic or enthusiasm among traders and this is reflected in the price.
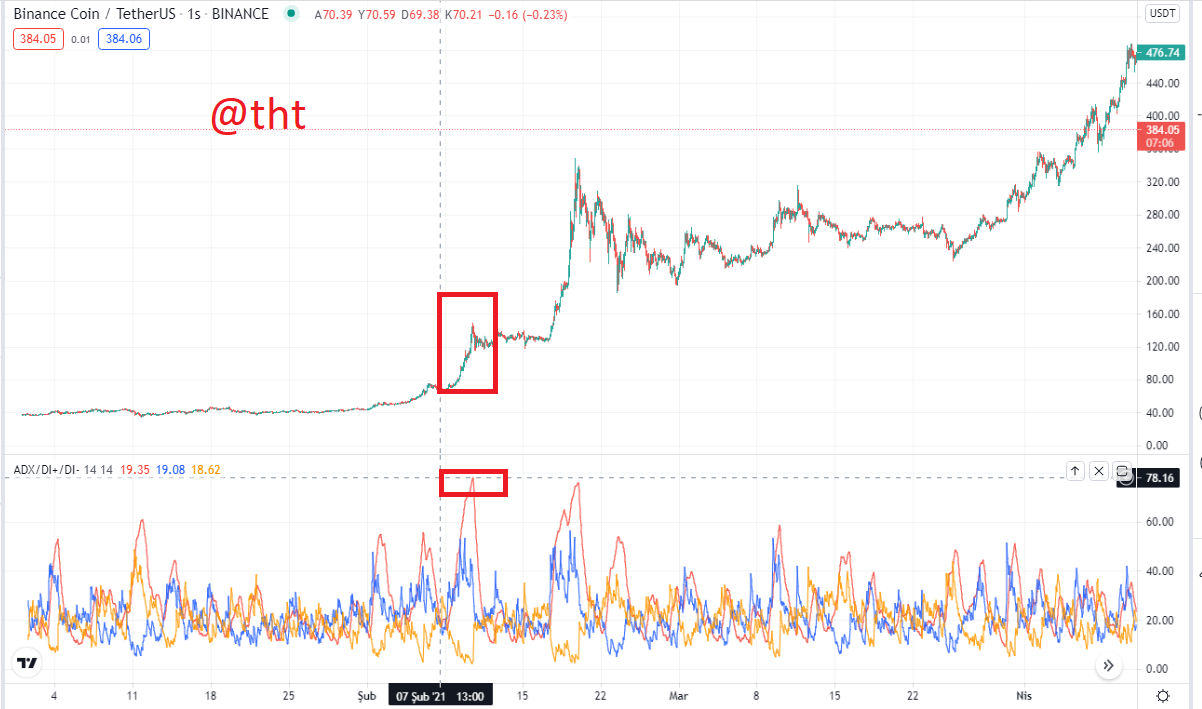
To see the charts where the ADX value is extra high, you need to decrease the time frame of the chart. Like 1 hour. On the BNB/USDT chart, the ADX value on February 21 is 78.16. At that time, the BNB price had increased by almost 100%.
How to filter false signals.
As with other indicators, false signals may appear on the ADX indicator. We can filter or reduce such false signals.
One of them is to increase the number of periods in the indicator. When we reduce the number of periods in the ADX indicator to, for example, 7, the ADX indicator will become very price sensitive. Therefore, it will generate too many signals and the number of false signals will increase.
When we increase the number of periods to 30, the indicator will show less sensitivity to price. The number of signals will decrease. As the number of signals decreases, the number of false signals will also decrease. But as I said before, this will cause the indicator to be a lagging indicator.
This trend is thought to reverse when the ADX line or value falls, but this is a misconception. When the ADX value drops, it means that the trend is a little weaker. When the ADX value decreases, the asset price may increase. We can talk about the existence of a trend when the ADX value is 25 and above.
Now let's look at them graphically.
Another way to filter false signals in the ADX indicator is to use it in conjunction with other indicators.
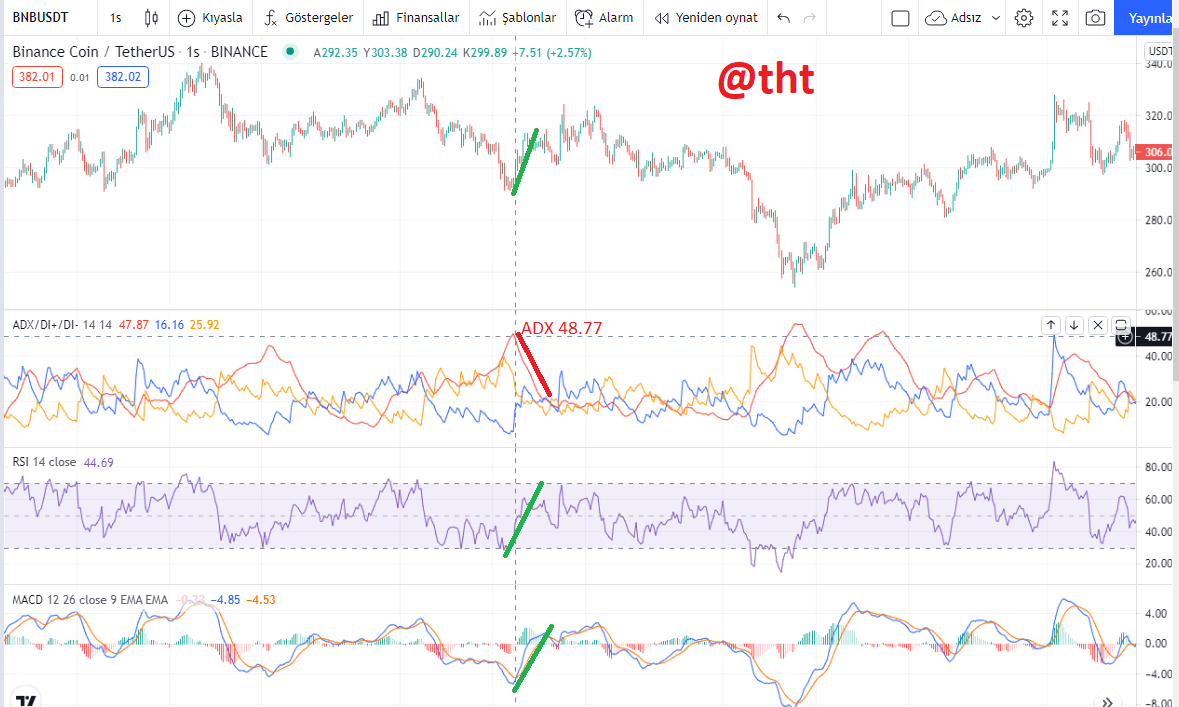
I applied the ADX, MACD and RSI indicators to my chart at the same time.
The value of the ADX indicator is 48.77, so the trend is very strong.
The MACD indicator is giving a buy signal on the chart. Because the MACD line crosses the signal line from bottom to top.
The RSI value is below 30 and gives a buy signal.
Although the MACD and RSI indicators are giving a buy signal, the value of the ADX indicator is decreasing. Although the BNB price is increasing, the ADX value is decreasing.
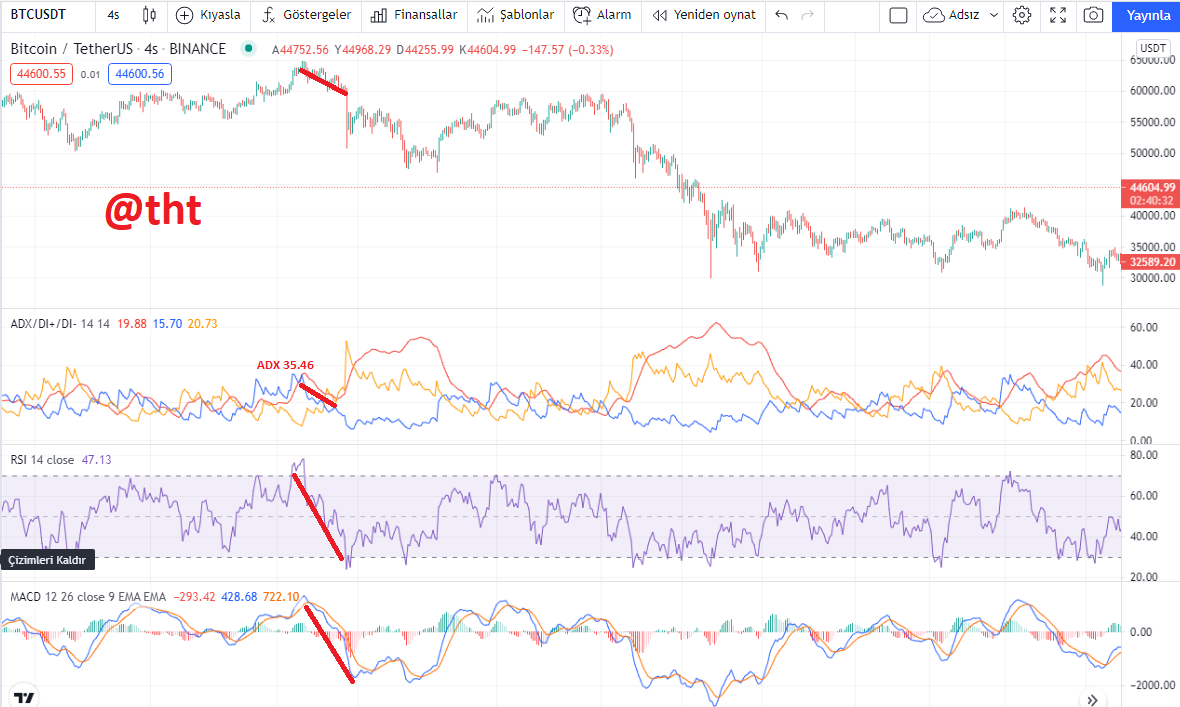
The ADX value is 35.46. This means that the trend is strong. Although the price is falling, the ADX value is also falling. Buy signals are available on MACD and RSI indicators.
Finally, I would like to say the following: The ADX indicator value decreases during trend changes. For example, when the trend direction is bearish, a sudden uptrend will lower the ADX value. Although the trend is very strong, there is a decrease in ADX value. This is because the trend has changed.
In some cases, although the ADX value decreases, there is no change in the trend. Because in this case, there has been a weakening in the strength of the trend.
To better understand such situations, using the ADX indicator together with other indicators at the same time will give us clearer results.
5. Explain what a breakout is. And How do you use the ADX filter to determine a valid breakout? (Screenshot required)
Breakthroughs occur in all financial markets. Breakouts occur in strong purchases or strong sales. During any bullish breakout occurs if the resistance level is exceeded. Again, during a decline, a break occurs if the support level is exceeded to the downside. In some cases, fractures occur, but this lasts for a very short time. This is also called fake breakout. The asset price comes back to the resistance or support level. In such cases, the stop loss explodes and traders lose. They buy assets high or sell assets low.
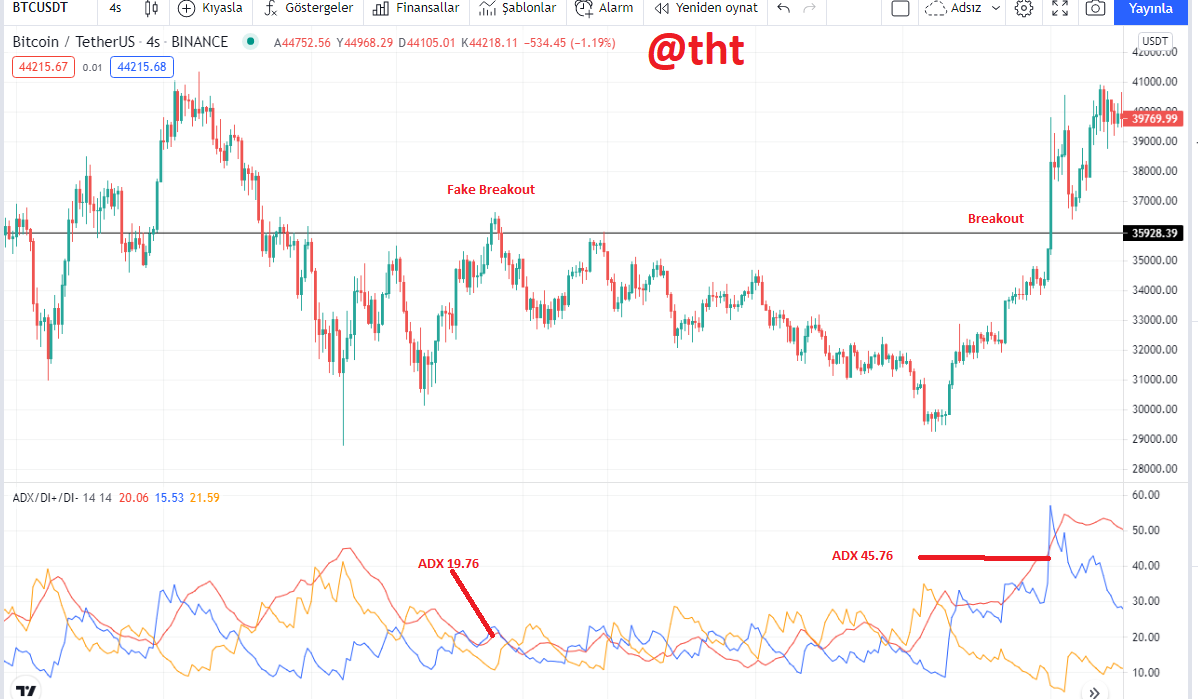
I marked 2 breakout areas on the chart. One of them is fake and the other is real.
At the fake breakout, BTC price retraced after slightly past the resistance level. We can easily understand that this is a fake breakout, because the ADX value is below 25. The trend is quite weak when the ADX value is below 25. A true breakout to the upside only occurs with strong buys. Volume is required for a price increase. When price and volume will increase, the trend will be strong and the ADX value will be above 25. The ADX value is 19.76 on the chart where the fake breakout occurred.
The ADX value is 45.76 when the actual break occurs. This value gives us the signal that the trend is strong. With strong purchases, BTC has exceeded the resistance level and a break has occurred. With the price increase, the volume has also increased. The trend has become strong. For a real break to occur, the ADX value must be above 25.
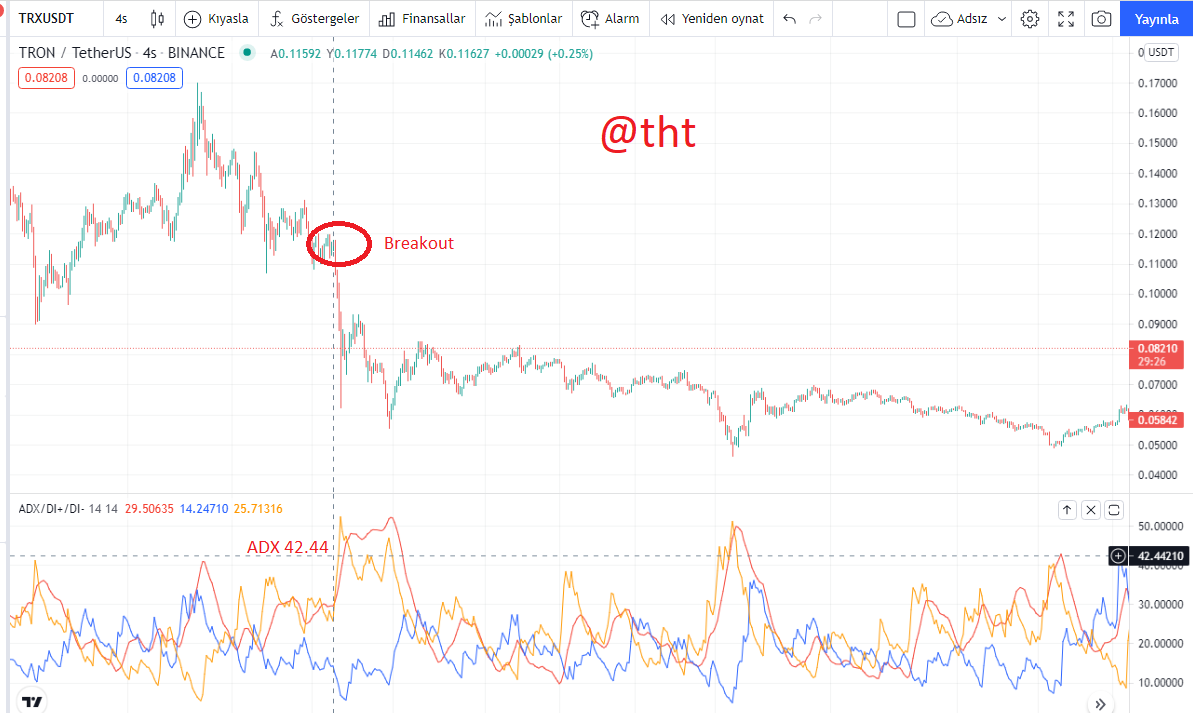
In this chart, the direction of the trend is downward. The ADX value is 42.44 where the breakout occurred. This means that the trend is strong and the breakout is real. Strong selling must occur for the support point to be broken. When strong selling occurs, the ADX value is above 25. On fake breakouts, the trend is weak and the ADX value remains below 25.
6. What is the difference between using the ADX indicator for scalping and for swing trading? What do you prefer between them? And why?
Scalping Trading
Scalping trading is a trading method in which traders make multiple transactions per day. In this trading method, traders close their positions after making small profits by using large volumes in small time intervals such as 1 minute, 5 minutes. Before making their trades, they determine the support and resistance points and make their trades according to these points. For some it is a risky business. According to some, profit can be easily made in a short time.
Scalping traders can identify key support and resistance points and trade through the ADX indicator. The risk is high in trades made in a short time. Also, traders are more likely to get erroneous signals using the ADX indicator. The purposes for using the ADX indicator should be the strength of the trend. To confirm the strength of the trend, to determine the direction of the trend, they should also use other indicators that give good signals in short timeframes. If they use the ADX indicator and other indicators, their success rates will increase.
Also, scalping traders should prefer short time periods. So they get more signals. When too many signals are received, they will also receive false signals. They should use other indicators to filter out these biased signals.
Swing Trading
Swing Trading traders detect fluctuations in asset price and take positions. They hold their positions for a few days. Trading on the scalping trader method takes longer. It is a method used by more patient traders. There are advantages as well as disadvantages.
When swing traders use the ADX indicator, they should use longer period periods. When a longer period is used, for example 30 periods, there will be a decrease in the number of signals received this time. In addition, the indicator will signal with a delay. Therefore, it is necessary to determine the most suitable periods for swing trading with practice.
It is necessary to be disciplined because the waiting or positioning time is long.
There is no need to use a lot of indicators when trading Swing Trading. It will be convenient to use the ADX indicator along with the pivot points and the Ichimoku indicator. You can get clearer positions by using 4-hour or daily charts.
The scalping trading method does not match my trading method. While it is sometimes possible to take profits within short time periods, incalculable conditions will cause losses when they occur. 1 unsuccessful trade can destroy the profits from 2-3 successful trades.
That's why the Swing trading method is more suited to my trading style. After a few days of waiting, I can execute my trades and make a profit when favorable conditions arise. In this trading method, I can increase my performance by using the ADX indicator along with other indicators.
Conclusion
The ADX indicator is an indicator that gives us an idea of the strength of the trend. It takes a value between 0-100. As the value increases, the strength of the trend increases, and as the value decreases, the trend begins to weaken. When we use the ADX indicator alone, we can only get an idea of the strength of the trend. When we use it together with the DI+ and DI- indicators, we can get signals about the direction of the trend.
It will be more effective when the ADX indicator is used with trend follower indicators such as RSI, MACD, Vortex.
Thank you professor for this lesson. I learned what the ADX indicator is and how to use the indicator. Using this indicator, I got ideas on how it would benefit me in trading.
Cc:
@steemitblog
@kouba01
Hello @tht,
Thank you for participating in the 7th Week Crypto Course in its third season and for your efforts to complete the suggested tasks, you deserve a 10/10 rating, according to the following scale:
My review :
An article with excellent content in which you have provided a set of useful information to answer the questions posed, and I took some notes :
To get the correct ADX result, you need to calculate DX values for at least n periods then smooth the results.
In the last question your answer was clear and your choice is convincing.
Thanks again for your effort, and we look forward to reading your next work.
Sincerely,@kouba01
Thanks professor. I wish you good luck in your work.