TRADING USING DOUBLE TOP AND DOUBLE BOTTOM - 10% to @Tron-Fan-Club

Hello everyone and welcome to my blog.
In today's topic, we would be looking into trading using the double top and double bottom strategy.
This trading strategy is one of the common strategies used by day traders in catching trend reversals and pullbacks.
It is done by taking note of some key support and resistance areas on price chart. These areas tends to pullback or reverse prices once it get to them thus making traders to either take a sell or buy position based on trend direction.
.png)
In as much as these strategy is usually effective, there's an issue on how to know whether the price will actually form a double top or double bottom or is it just going to break through the support or resistance level.
The above issue is what will lead us into looking at some practical examples on how to trade the double top and double bottom strategy.

The double top is formed when a price rejects on a key support area due to loss in momentum. In other to trade the double top strategy, we will be needing to add a momentum indicator since it's a momentum trade.
The momentum indicator we will be using will be the RSI which will help us to identify whether a price testing a resistance area is more likely to break it or reverse.
So in other to make an entry using the double top formation, wait for the double top to form and after the complete formation of the double top, wait for a reversal candle. Once the reversal candle is spotted, check the resistance for a possible formation of a bearish divergence and once it's spotted, you take a sell entry.
- See below
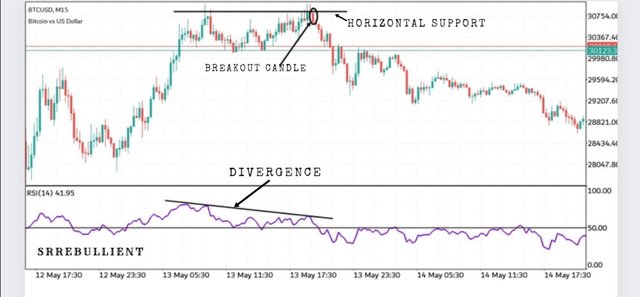
From the above, we will see that all conditions were met. The divergence formation is what tells us that there's a loss in momentum in bullish momentum which signals a possible bullish-to-bearish price reversal.
The double bottom is similar to double top but opposite. It is formed when a price rejects on a key resistance area due to loss of bearish momentum.
It is traded similar to a double top by adding a momentum indicator preferably RIS which will aid in spotting loss of momentum on a price at a double bottom resistance.
In making an entry using the double bottom, we will have to first wait for a reversal candle to form or subsequent bullish candle. After that we confirm it there's a divergence which would indicate a loss in bearish momentum. After that, we will take a buy position.
- See below
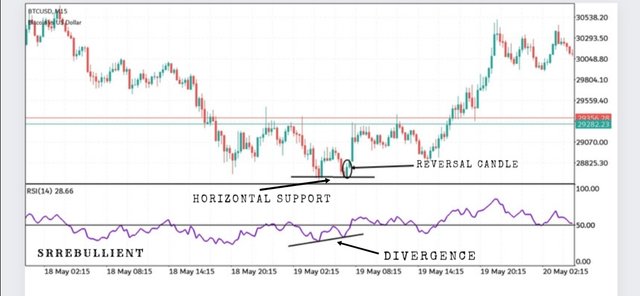
From the above we will see that all conditions are met and and a successful reversal occurred.
- EXIT
In taking an exit position using the double top and double bottom strategy, it is best for the stop-loss to be set slightly above the reversal candle for a double top while the target is set in consideration of the stop-lose in a 1:2 ratio. The same thing is applicable to the double bottom but in a reverse manner.
The double top and double bottom is a reversal pattern which occurs due to loss in momentum of a bullish or bearish price. This reversal pattern is mostly utilized by traders by adding a momentum indicator which will aid them is identying the level of price momentum.
The fact at the price is either at the support or resistance in addition with a bullish or bearish divergence along side a reversal candle, provides enough confluence for a trader to confidently take a buy or sell position.
Another thing to note in trading the double top and double bottom pattern is that it should be done on at least a 15min time frame or higher because the higher the time frame, the more prominent the support and resistance levels.
Thanks for reading...
Tweet link
https://twitter.com/EbullientSrr/status/1528852948008280064?s=19
Thank you for contributing to #LearnWithSteem theme. This post has been upvoted by @zmoreno using @steemcurator09 account. We encourage you to keep publishing quality and original content in the Steemit ecosystem to earn support for your content.
Regards,
Team #Sevengers
The double top and double bottom has Alot of market pyschology within it
In the sense that in both instances the price was able to break the previous point hence indicating weakness or trend.
I employ you to read more on this article on market psychology
https://steemit.com/hive-165917/@victoh78/business-activity-market-psycholgy
Thank you for your contribution.
It's deeply appreciated.
This is a helpfull post thank you for sharing
I'm G lad you found it helpful
a technique that is certainly worth trying but at the moment I'm not the best but later if the market is normal I'll try
I'm glad your found the technique worth trying.
Thank you so much.
hope it will get better soon
In fact, today you have brought one of my interesting trading techniquess. You have really explained very well about this Double top and Double bottom strategy.
This is indeed an important post in trading. These are the things a new trading should know and you have explained it in a beautiful way. Thank you for sharing.
I'm glad you found it interesting.
Thank you
There are many strategies for trading and this is one of it.
It is advisable to use a strategy that works for a trader.
Well, this is a nice strategy anywell
Thank you for your comment.
Another trading technique shared, this is nicely explained and written
Thank you. I'm glad you found it interesting.
You did a great task in coming up with that content
Thank you.