Bitcoin Leverage Trading Analysis: BTCUSD Daily Chart Insights
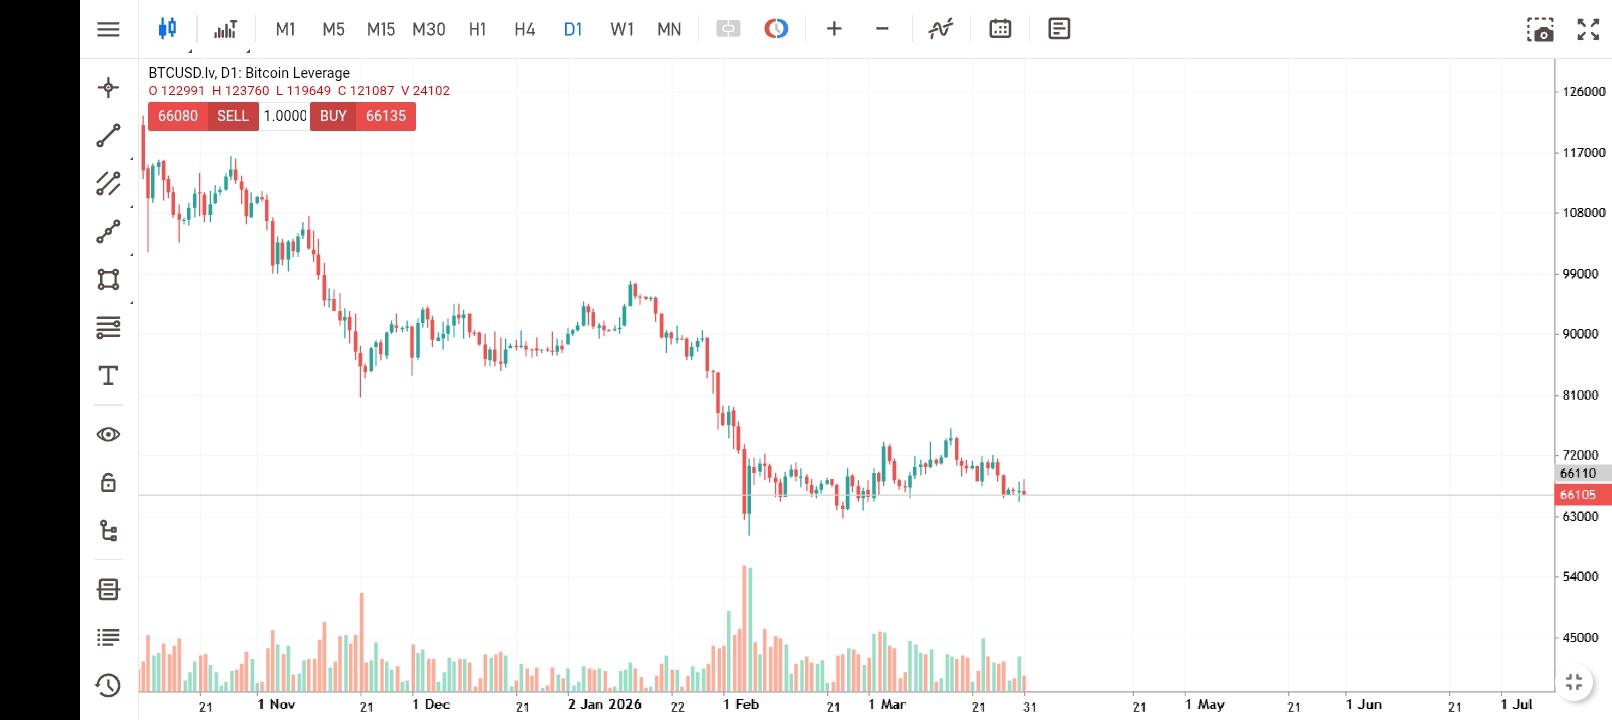
Bitcoin daily chart from early 2026. The chart highlights key price movements, including a significant downtrend starting in November 2025, followed by periods of consolidation and volatility. Volume bars at the bottom indicate trading activity, which spikes during major price shifts.
The downtrend starting in November 2025 is quite notable, and it's interesting to see the periods of consolidation that followed - I'm curious to see how the price will move in the coming weeks. The volume spikes during major price shifts also suggest a high level of interest from traders.
I agree, the downtrend from November 2025 really sets an important context for understanding the current market dynamics. The consolidation phases that followed definitely indicate a market trying to find its footing amid uncertainty. It will be fascinating to observe how the price behaves in the coming weeks. I’m keeping a close eye on potential breakout points or further volatility that could shape the next trend.