SUI/USDT Technical Analysis: The Consolidation Breakout Strategy
Body:
Is the market taking a breather, or is it preparing for a massive move?
If you have been watching the SUI/USDT charts over the last few days, you aren't alone. We’ve been trading in a tight consolidation range, and while many are getting impatient, I see a high-probability setup forming right under our noses.
🔍 The "Squeeze" Phase
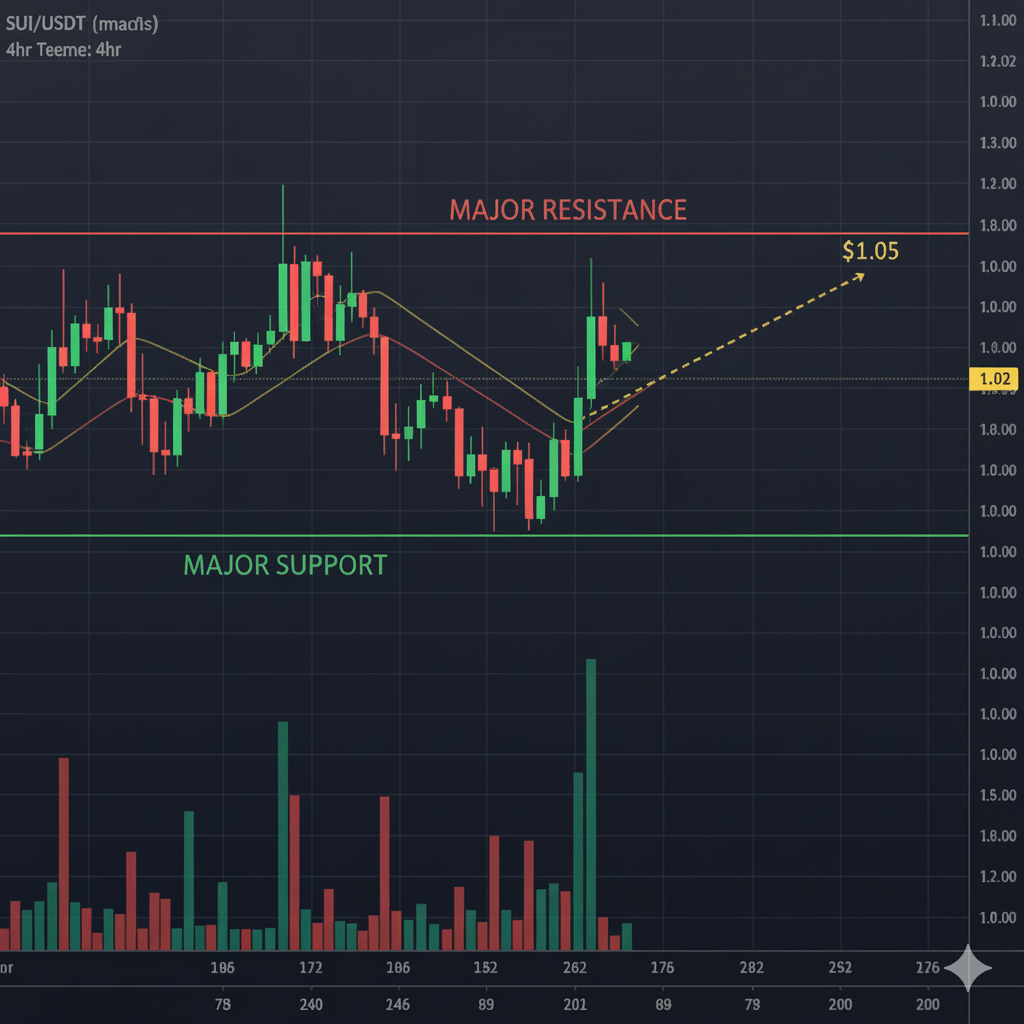
In technical analysis, consolidation isn't a sign of weakness—it's a sign of a market gathering fuel. Currently, we are locked between two critical walls:
The Ceiling: $0.92 (Major Resistance)
The Floor: $0.78 (Major Support)
💡 Why I’m Watching These Levels
The Breakout Scenario: If we see a volume-backed push above $0.92, we are likely looking at a trend reversal toward $1.05 and beyond.
The Caution Zone: If the $0.78 support fails, it’s time to step back and preserve capital. Never fight the trend.

🚀 What’s Your Strategy?
I’m currently staying neutral, waiting for the market to show its hand. Breakouts are easy to spot in hindsight, but in real-time, it’s all about risk management.
Are you buying the dip at support, or waiting for a breakout confirmation? I want to hear your perspective! Let’s discuss in the comments. 👇
Disclaimer: This is not financial advice. I’m sharing my chart work for educational purposes. Always do your own research.