TRIA/USDT — What Really Happened Today (Based on the Screenshot)
TRIA/USDT — What Really Happened Today (Based on the Screenshot)
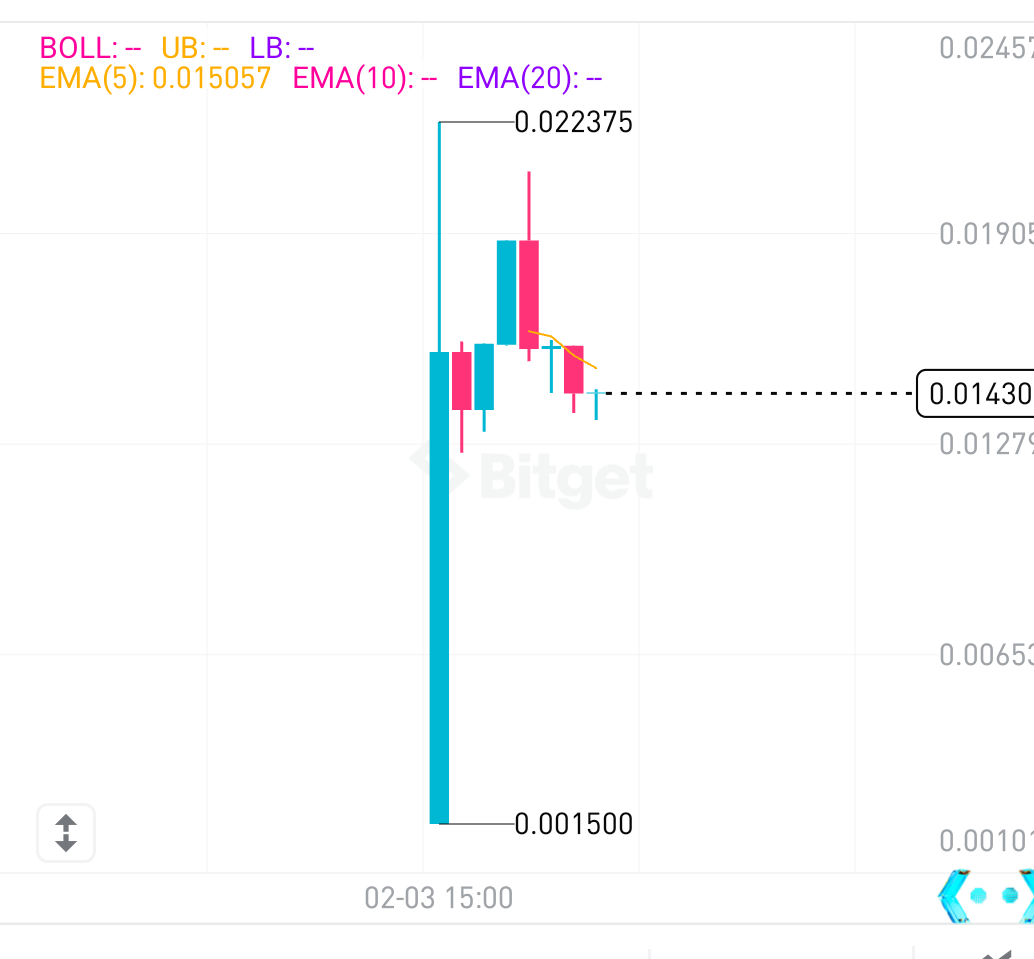
TRIA/USDT delivered one of those moves that instantly grabs attention. According to the screenshot, price exploded from a low of 0.001500 and pushed all the way up to 0.022375, before cooling down near 0.014303. A +853.53% move in a single day is not something you see often, even in crypto.
Looking at the 1-hour chart, the move started with a massive impulse candle. That kind of candle usually signals sudden demand — either strong buying interest or a liquidity-driven pump. After hitting the high, long upper wicks appeared, which clearly shows profit-taking at the top. Early buyers didn’t hesitate to lock in gains.
Right now, price is hovering close to the short-term average. EMA(5) is around 0.015056, and the market is trading just below that level. This suggests hesitation. Momentum has slowed, and the market is trying to decide whether this was just a spike or the beginning of a broader move.
The 24-hour volume (865.68M TRIA) and turnover of 13.08M USDT confirm that this wasn’t a quiet move. Heavy participation means emotions were high — fear of missing out on the way up, and fear of giving profits back on the way down.
At this stage, TRIA is no longer in “easy money” territory. Chasing after an 800%+ candle is risky. The chart now demands patience. Either price builds a base above key levels and continues, or it slowly fades as hype cools off.
Moves like this remind us why risk management matters. Big pumps feel exciting, but they test discipline just as much as skill. In crypto, surviving the move is more important than catching every candle.