Quantitative Finance on TRON: Building and Backtesting a Mean Reversion Strategy
The cryptocurrency market operates 24/7, making it an ideal environment for quantitative trading strategies. Rather than relying on emotions or news alone, quantitative finance uses mathematical models and statistical analysis to identify trading opportunities.
In this article, we'll build a simple Mean Reversion strategy that anyone can test on historical TRON (TRX) price data.
Why Mean Reversion?
Financial markets often experience short periods where prices move excessively away from their average. A mean reversion strategy assumes that these deviations eventually return toward the mean.
The basic idea is simple:
Buy when the price is significantly below its recent average.
Sell when the price rises significantly above it.
One common statistical tool for measuring this deviation is the Z-Score.
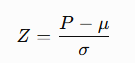
Where:
P = Current Price
μ = Rolling Moving Average
σ = Rolling Standard Deviation
Trading Rules
Z < -2 → Buy
Z > 2 → Sell
Otherwise → Hold
Why This Matters
Unlike random trading signals, quantitative strategies can be:
Backtested
Optimized
Measured objectively
Automated
The goal isn't predicting the future—it's determining whether an idea has demonstrated a historical statistical edge.
Python Backtest Example
Below is a complete example that you can run yourself.
import yfinance as yf
import pandas as pd
import numpy as np
Download TRON historical data
data = yf.download("TRX-USD", start="2022-01-01")
Rolling statistics
window = 20
data["MA"] = data["Close"].rolling(window).mean()
data["STD"] = data["Close"].rolling(window).std()
Z-Score
data["Z"] = (data["Close"] - data["MA"]) / data["STD"]
Trading Signals
data["Signal"] = 0
data.loc[data["Z"] < -2, "Signal"] = 1
data.loc[data["Z"] > 2, "Signal"] = -1
Daily Returns
data["Returns"] = data["Close"].pct_change()
Strategy Returns
data["Strategy"] = data["Signal"].shift(1) * data["Returns"]
Cumulative Performance
data["Market"] = (1 + data["Returns"]).cumprod()
data["Strategy Equity"] = (1 + data["Strategy"]).cumprod()
print(data[["Close","Z","Signal"]].tail())
print(f"Market Return: {(data['Market'].iloc[-1]-1)100:.2f}%")
print(f"Strategy Return: {(data['Strategy Equity'].iloc[-1]-1)100:.2f}%")
Possible Improvements
Professional quantitative funds rarely stop at a single indicator.
Some ideas to improve this model include:
Volatility filtering
ATR-based stop losses
Position sizing using Kelly Criterion
Bayesian parameter optimization
Cointegration and statistical arbitrage
Regime detection using Hidden Markov Models
Machine Learning feature engineering
Walk-forward optimization
Monte Carlo robustness testing
Key Performance Metrics
When evaluating any trading strategy, total profit alone isn't enough.
Professional quants typically analyze:
Annualized Return
Sharpe Ratio
Sortino Ratio
Maximum Drawdown
Calmar Ratio
Win Rate
Profit Factor
Average Trade Duration
A strategy with lower returns but significantly lower drawdowns may actually be superior from a risk-adjusted perspective.
Final Thoughts
Quantitative finance transforms trading from guesswork into a process driven by data, statistics, and repeatable rules. While no strategy is guaranteed to remain profitable, rigorous backtesting and risk management can help identify approaches worth exploring.
This simple mean reversion model is just a starting point. As you gain experience, you can combine statistical signals, machine learning, and blockchain-specific metrics to create more sophisticated systems.
Have you ever backtested a strategy on TRON or another cryptocurrency? I'd be interested to hear what techniques or indicators you've found most effective.