Blockchain and Cryptocurrency Beginner - The Formation of Candlestick Patterns and Relationship to Price
The Evening Star Candlestick Pattern
The evening star candlestick pattern forms with three candlesticks that forms at the top of an uptrend. The evening star shows that the upward momentum is slowing down before there is a bearish move that indicates there is a possible reversal to a downtrend. The evening star pattern comprises of a Doji or a small red/green body candlestick in-between a large green/bullish candlestick and a large red/bearish candlestick.
The psychology behind the evening star candlestick pattern is that on the green or bullish candle where the buyers are in control, the buying pressure pushes the price all the way up and closing near the highs. The next candlestick that follows is a Doji candlestick which shows a slowdown in the upward momentum, because the buyers and sellers are in equilibrium, causing the opening price and close price are at the same level. The next candlestick that follows is a red or bearish candlestick where the sellers have now taken control, the selling pressure pushes the price all the way down and closing near the lows.
Candlestick Patterns and How Price Reacted After the Formation
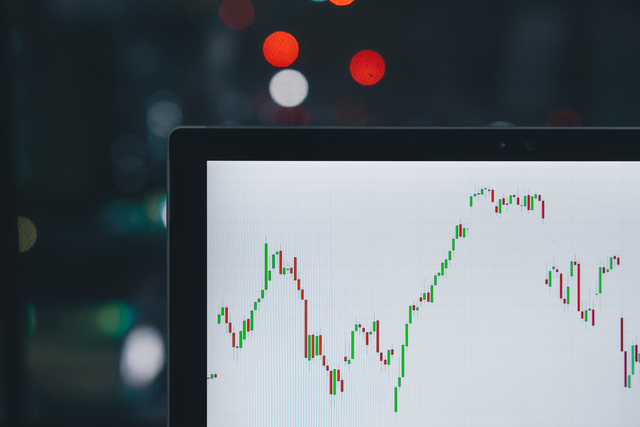
Bullish engulfing candlestick pattern
.png)
The Bullish engulfing candlestick pattern is also known as a reversal pattern because it forms at the bottom of the downtrend and shows that there is a potential that the downtrend is coming to an end and is about to reverse to an uptrend.
Looking at my screenshot of the BNB/USDT chart, we can see that the bullish engulfing candlestick pattern formed after the downward movement of the market and after the formation of the bullish engulfing candlestick pattern, the market reversed to an uptrend which is a clear example that the bullish engulfing candlestick pattern is a reversal pattern. We can say that the price of a BNB/USDT pair opened on the high on the red/bearish candlestick, the sellers pushed the price all the way down and the price finally closes on the low of the day. The green/bullish candlestick which follows next, opened near the low of the previous red candle, shows that buyers came in and took control of the market, and the buying force pushed the price all the way up into an uptrend.
Doji Candlestick Pattern
.png)
The Doji candlestick pattern is also known as an indecision in the market or the buyers and sellers are in equilibrium because neither the buyers nor sellers have taken control. The Doji candlestick pattern can also represent that the momentum of the existing trend has slowed down before the market continues in its current trend direction or reverses.
Looking at my screenshot of the AAVE/USDT chart, we can see that the Doji candlestick pattern formed at the bottom of a downward movement of the market and after the formation of the Doji candlestick pattern, the market reversed to an uptrend which is a clear example that the Doji can indicate that the market can either continue in its current direction or reverse to the opposite direction. We can say that the price of AAVE/USDT pair opened and closed on the same level. Both the buyers and sellers were on an equilibrium. The buying pressure and selling pressure in the market were on the same level. However, the buyers eventually took control of the market and reversed the direction to an uptrend.