Burned tokens, rewards, and inflation summary November 19, 2022 - Total burn estimates: 168,687K STEEM/SP and 63 SBD
Steemit launched the #burnsteem25 initiative on May 22, and the corresponding rewards started being delivered to @null on May 29. Subsequently, on August 9, Steemit announced that they'd be monitoring post promotions daily. Here is the next weekly update with PowerBI charts to visualize the burned token-related statistics since those dates.
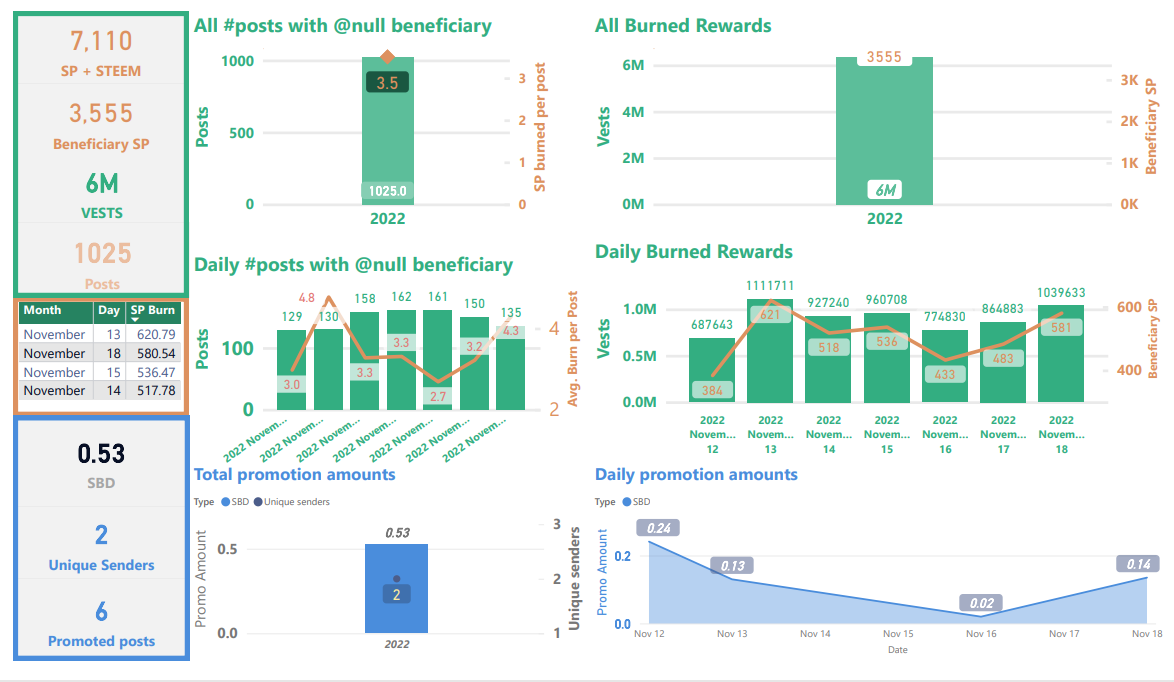
Slide 1 & 2: Burn amounts in beneficiary rewards and transfers to @null. (Weekly & All time)
Weekly totals were about 7,110 STEEM/SP and 0.53 SBD with 1,025 burnsteem25 posts (~6.9 STEEM + SP burned per post). This is up by 56 from last week's 7,054. There were no new entries in all time the top-4 list.
Weekly
All time

| Sidebars |
|---|
Top sidebar summary cards show total number of STEEM, SP, and VESTS burned, as well as the total number of posts with @null beneficiary settings. This is where the headline number comes from.
In the center-left sidebar is a new table showing the top-4 days in terms of burned beneficiary rewards.
Bottom-left sidebar summary cards show totals for SBD burned in post promotion.
| Graphs |
|---|
Top-left is a graph showing the number of posts and average SP burned per post by month.
Top-right: This shows the VESTS and the estimated SP beneficiary rewards burned per month.
Middle-left: This is a graph showing the number of posts and average SP burned per post, by day.
Middle-right: This shows the daily VESTS and the estimated SP beneficiary rewards that have been burned.
In all of the above graphs, VESTS are shown against the left axis, SP and STEEM are shown against the right.
Bottom: SBD transfers to @null. As readers are likely aware, SBD transfers to @null can get a post added to the /promoted page. The visualization on the left shows a monthly aggregation of SBDs transferred and a count of unique senders. The visualization on the right shows the daily record.
Slide 3: Rewards summary
Unchanged from the last eight weeks is that SBD printing has remained paused, due to the continuing sluggishness FTX meltdown impacting the price of STEEM (and crypto markets at large). With the present SBD supply, it looks like the median on-chain price for STEEM needs to get back to about $0.252 for SBDs to start printing again. With 102K burned and 5.05M in overall social rewards during the last 90 days, this represents an average burn rate of about 2%.

Curator rewards use the scale on the right, author and beneficiary rewards use the scale on the left. Thus, curation rewards appear to be scaled down relative to author & beneficiary rewards. Beneficiary rewards for @null in this chart (red) have been adjusted in order to account for both SP and liquid rewards. The top graph shows the monthly aggregations, and the bottom graph shows daily totals.
The new top-left sidebar shows estimates for the 90-day total of distributed "social rewards" (author, curator, and beneficiary), the 90-day total of curation rewards; and the 90-day total of burned beneficiary rewards.
The new bottom-left sidebar shows estimated daily 90-day averages for the same three values. In both sidebars, "social rewards" are calculated as [curation rewards] * 2. Based on these estimates, the burn rate is about 1.9% of all social rewards (this excludes interest paid for staking, rewards to witnesses, and SBDs to the SPS).
Slide 4: STEEM & SBD Supply as well as vested (i.e. staked or "powered up") STEEM
Noteworthy this week is that liquid STEEM as a percentage of current supply and of virtual supply declined for the sixth week in a row (top-right and bottom-left charts).
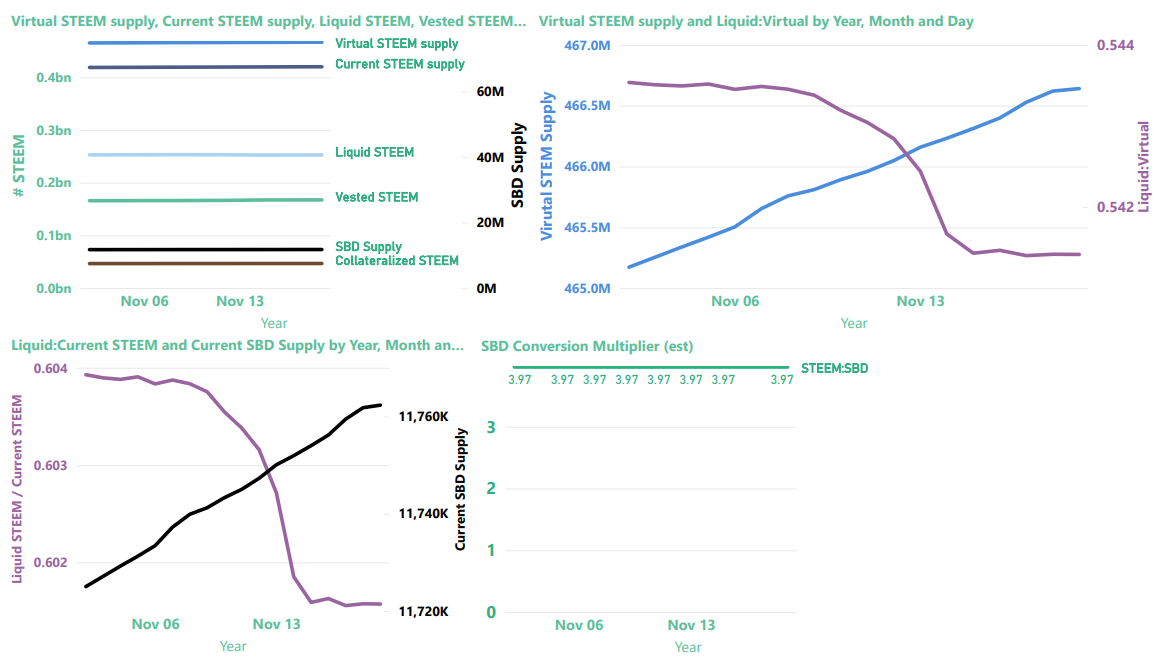
The top-left image provides a summary view of current and virtual STEEM supply, current SBD supply, liquid and vested STEEM, and the amount of STEEM reserved as collateral for paying off SBDs.
| Note |
|---|
Collateralized STEEM and current SBD supply actually represent the same value expressed in terms of STEEM or SBDs, respectively. They're aligned differently on the graph because they use different axes. |
The top-right graphic now contains a zoom-in on "virtual STEEM Supply" (left axis) and the ratio of liquid STEEM / virutal STEEM supply (right axis). As we learned, here, virtual STEEM supply is heavily influenced by price, so with STEEM prices down, it's not surprising to find the virtual STEEM supply increasing. The up-side of this is that it's now possible to burn more collateralized STEEM per SBD with post promotion.
The bottom-left visualization now contains the ratio of liquid STEEM / current STEEM supply (left axis) and a zoom-in on Current SBD supply (right axis)
The chart on the bottom right shows the value of SBDs in terms of STEEM, according to the blockchain conversion rate, not external markets. This is the inverse of the blockchain's: internal price (which is different from the actual feed median, for reasons that I don't currently understand).
Now, here are some more details about each of the values
| Parameter | Axis (left/right) | Meaning | Comments |
|---|---|---|---|
| SBD Supply | right | Number of SBDs in circulation | Equivalent in value to collateralized STEEM |
| Collateralized STEEM | left | Number of STEEM needed to pay off all SBD debt | Equivalent in value to SBD Supply |
| Vested STEEM | left | Number of STEEM staked as STEEMPOWER | |
| Liquid STEEM | left | Number of STEEM that's not staked or needed for SBD collateral | Calculated as (Current STEEM supply - Vested STEEM) |
| Current STEEM supply | left | Number of STEEM in circulation | |
| Virtual STEEM supply | left | Number of STEEM in existence |
Slide 5
Last week, I started downloading the actual curation reward transactions from the blockchain, so I can see how well the numbers match up with steemdb. After 8 days of downloading, it's caught up to July 7.
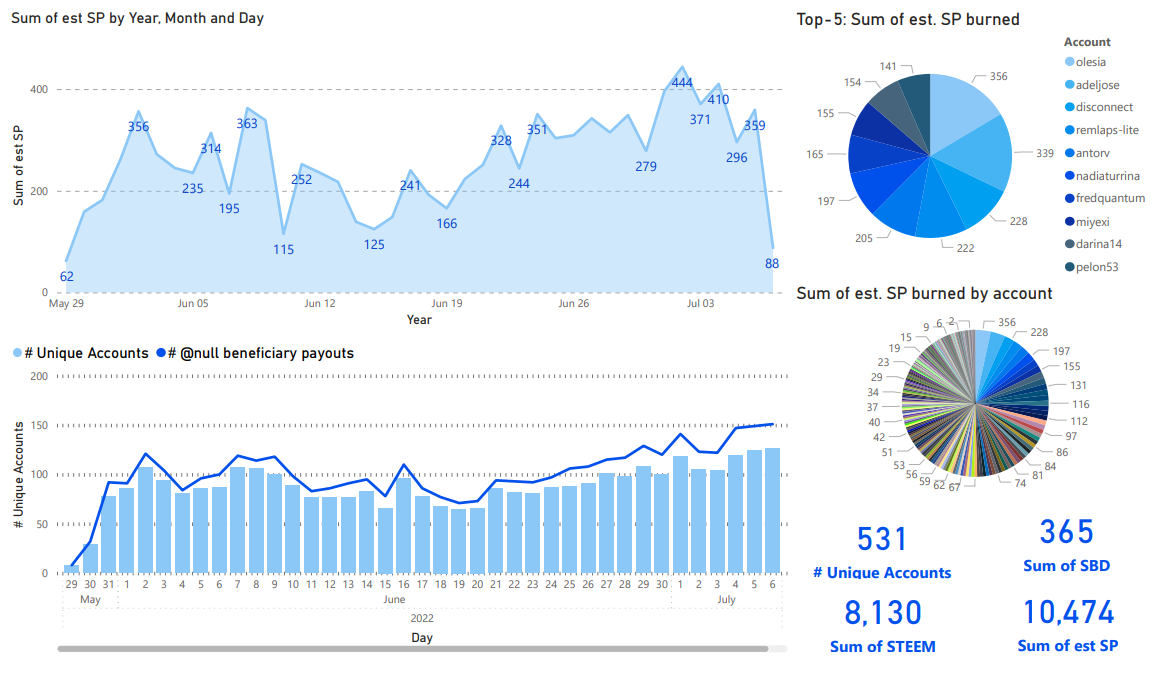
Some time ago, @pennsif had asked me about numbers of unique authors. When this data finishes downloading, I should be able to answer that. (knock on wood. ;-)
Thanks for reading!
For previous updates, see:
- Burned tokens, rewards, and inflation summary November 12, 2022 - Total burn estimates: 161,809K STEEM/SP and 63 SBD
- Burned tokens, rewards, and inflation summary November 5, 2022 - Total burn estimates: 154,548K STEEM/SP and 62 SBD
- Burned tokens, rewards, and inflation summary October 29, 2022 - Total burn estimates: 146,635K STEEM/SP and 62 SBD
- Burned tokens, rewards, and inflation summary October 22, 2022 - Total burn estimates: 138,248K STEEM/SP and 62 SBD
- Burned tokens, rewards, and inflation summary October 15, 2022 - Total burn estimates: 130,161K STEEM/SP and 61 SBD
- Burned tokens, rewards, and inflation summary October 8, 2022 - Total burn estimates: 121,925K STEEM/SP and 61 SBD
- Burned tokens, rewards, and inflation summary October 1, 2022 - Total burn estimates: 113,594K STEEM/SP and 61 SBD
- Burned tokens, rewards, and inflation summary September 24, 2022 - Total burn estimates: 104,675K STEEM/SP and 60 SBD
- Burned tokens, rewards, and inflation summary September 17, 2022 - Total burn estimates: 96,709K STEEM/SP and 60 SBD
- Burned tokens, rewards, and inflation summary September 10, 2022 - Total burn estimates: 88,781K STEEM/SP and 55 SBD
- Burned tokens, rewards, and inflation summary September 3, 2022 - Total burn estimates: 80,692K STEEM/SP and 54 SBD
- Burned tokens, rewards, and inflation summary August 27, 2022 - Total burn estimates: 71,850K STEEM/SP and 49 SBD
- Burned tokens, rewards, and inflation summary August 20, 2022 - Total burn estimates: 64,876K STEEM/SP and 37 SBD
- Burned tokens, rewards, and inflation summary August 13, 2022 - Estimated beneficiary burn since May 29: 56,855 STEEM
- Burned tokens, rewards, and inflation summary August 6, 2022 - Estimated beneficiary burn since May 29: 49,365 STEEM
- Burned tokens, rewards, and inflation summary July 30, 2022 - Estimated beneficiary burn since May 29: 42,556 STEEM
- Burned tokens, rewards, and inflation summary July 23, 2022 - Estimated beneficiary burn since May 29: 35,497 STEEM
- Burned tokens, rewards, and inflation summary July 16, 2022 - Estimated beneficiary burn since May 29: 28,408 STEEM
- Burned tokens, rewards, and inflation summary July 9, 2022 - Estimated beneficiary burn since May 29: 22,185 STEEM
- Burned tokens, rewards, and inflation summary July 2, 2022 - Estimated beneficiary burn since May 29: 15,312 STEEM
- Burned tokens, rewards, and inflation summary June 25, 2022 - Estimated beneficiary burn since May 29: 12,412 STEEM
- Burned tokens, rewards, and inflation summary June 18, 2022 - Estimated beneficiary burn since May 29: 8,994 STEEM
- Burned tokens, rewards, and inflation summary June 11, 2022 - Estimated beneficiary burn since May 29: 6,492 STEEM
Pixabay license, source
Reminder
Visit the /promoted page and #burnsteem25 to support the inflation-fighters who are helping to enable decentralized regulation of Steem token supply growth.
Hello! I came across an old post: https://steemit.com/utopian-io/@lostmine27/the-current-actual-inflation-rate-of-steem-is-quite-different-from-the-design-1545151936259
Could you tell me what is the current annual inflation of the STEEM token and is it in line with the project?
If I did the spreadsheet right, here's what the overall decline should look like, so 7% is right on target.
My understanding is that the "current_supply" inflation rate should always match the target, but the virtual_supply might vary a lot, depending mainly on the price of STEEM, so I guess the previous analysis was basically backing into the virtual_supply number.
Thank you for your answers and valuable information. I am interested in this topic and I knew for sure that I turned to the right person.
It is interesting in what way the inflation reduction is planned. From this post I understand that due to the reduction in the reward pool. Interesting. Of course, the developers predicted a constant increase in the price of STEEM, so the reduction of the reward pool is logical.
Is it fair to say that approximately 420271729.51 * 0.07 = 29419021 STEEM will be "printed" during 2022? (80,600 STEEM/day)
That's a decent estimate, but it's more complicated than that. And as I think about it, I guess I don't even completely understand all of the relevant factors. Some of the variables that come to mind include these:
Thank you for your clarifications. Now it is more clear to me.
I guess this is the code that does it:
So, they create new_steem as a percentage of virtual_supply, and then split that up into content rewards, vesting rewards (interest), SPS funding, and witness rewards.
The pieces that converts author rewards and SPS funding to SBDs happen a bit later.
Over the year, then, the virtual steem supply will increase by ~32,689,312 (466990176 * 0.07), and that will be split among VESTS, STEEM, and SBDs. But token burning and SBD -> STEEM conversion can also alter the mix, and it's also effected by the changing price of STEEM.
Thank you 🙂
Unless @steemchiller has something in SDS, I'm not aware of any way to get that information from the past. The author of that post used steemsql, but unfortunately steemsql went away during the Witness Wars.
At this point, the only place I know to get historical supply amounts is here, but that only covers about 2 weeks. So, I could calculate the 2-week interest rate from that fairly easily, but anything longer will take some time.
This isn't the first time I've missed steemsql.
Edited to add:
Based on virtual supply from the link above, the APR over the last two weeks has been (very roughly) about 7%.
It's roughly the same based on current supply, too....
The collapse of the FTX has been a blow to many in recent days. Many have lost their money invested in the exchange. I hope that the situation will normalize as soon as possible, all those who have lost will get their savings back. Good luck to you, thanks for the report.
Hi Remlaps,
Thank you for the information.
I can better understand Steem burns now. I've been trying to burn for the last week. I want to provide my best support for Steem/Steemit.
I am open to your suggestions, I would like you to share.
Best regards.
Total burn estimates: 168,687K STEEM/SP and 63 SBD, those are pretty substantial amounts, I hope the price reflects that.
Excuse me for my comment, but that's what I think, my habit is to always be real, sincere, maybe it's the reason for being alone for a long time, however I've gotten used to loneliness, more than people, no, no, real, no, not honest, they say what you want to hear, that person is not me and I never will be
The amount of burn this week is pretty good. It is up to us to increase this even more. In this case, it should be encouraged. need to introduce. the investor should know this
This post has been featured in the latest edition of Steem News...
If you would like to support Steem News and Witness Weekly please consider voting for @pennsif.witness
In order to make such a report, some knowledge is needed, and I, in turn, am a simple observer of the price of a coin. Today, there is hope that its price will return to its previous indicators, of course, the number of burned tokens affects the growth of the coin price.