Steem Total Value Powered Up - $38 million - July 24, 2022
This is next in my series of posts reviewing the amount and value of powered up STEEM on the Steem blockchain. For previous posts, see the end of this entry.
Noteworthy in the last week |
|---|
- Week over week, the number of powered up STEEM decreased by about 13K, or about 0.01%.
- Over the course of the week, we saw five daily increases and no new highs in number of STEEM powered up.
- The modeled value of powered-up STEEM gained ground against all comparison values, except for ETH. Changes ranged from -9% against ETH to +8% against TRX.
- In terms of all comparison values except for TRX, and USD, today's locked value is higher than the January 1, 2022 baseline.
- This week saw a total of 612K STEEM powered down, which is a decline of 11% as compared to last week's 690K STEEM.
Here are the numbers as-of a few minutes ago |
|---|
Total value locked in powered-up STEEM (USD): $37,998,526.65
STEEM market cap $95,440,735.69
Locked value in terms of other tokens:
| token | price | locked value equivalent | Jan 1, 2022 | pct of Jan 1 baseline |
|---|---|---|---|---|
| tron | $0.07 | 562,283,056 | 809,173,538 | 69.49% |
| steem-dollars | $3.05 | 12,458,533 | 11,284,131 | 110.41% |
| bitcoin | $22,786.00 | 1,667 | 1,300 | 128.27% |
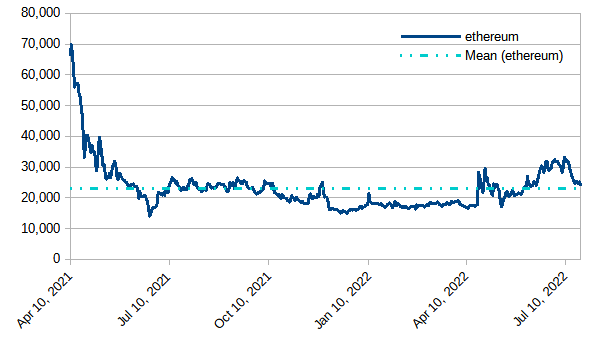
| ethereum | $1,603.64 | 23,695 | 16,501 | 143.60% |
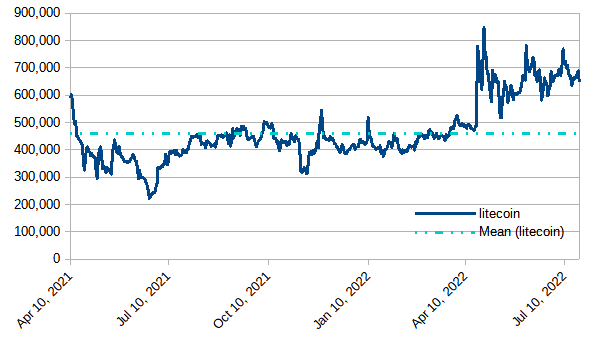
| litecoin | $59.09 | 643,061 | 411,561 | 156.25% |
| steem | $0.24 | 157,220,103 | 142,930,214 | 110.00% |
| USD | $1.00 | 37,998,527 | 61,837,042 | 61.45% |
|
|---|
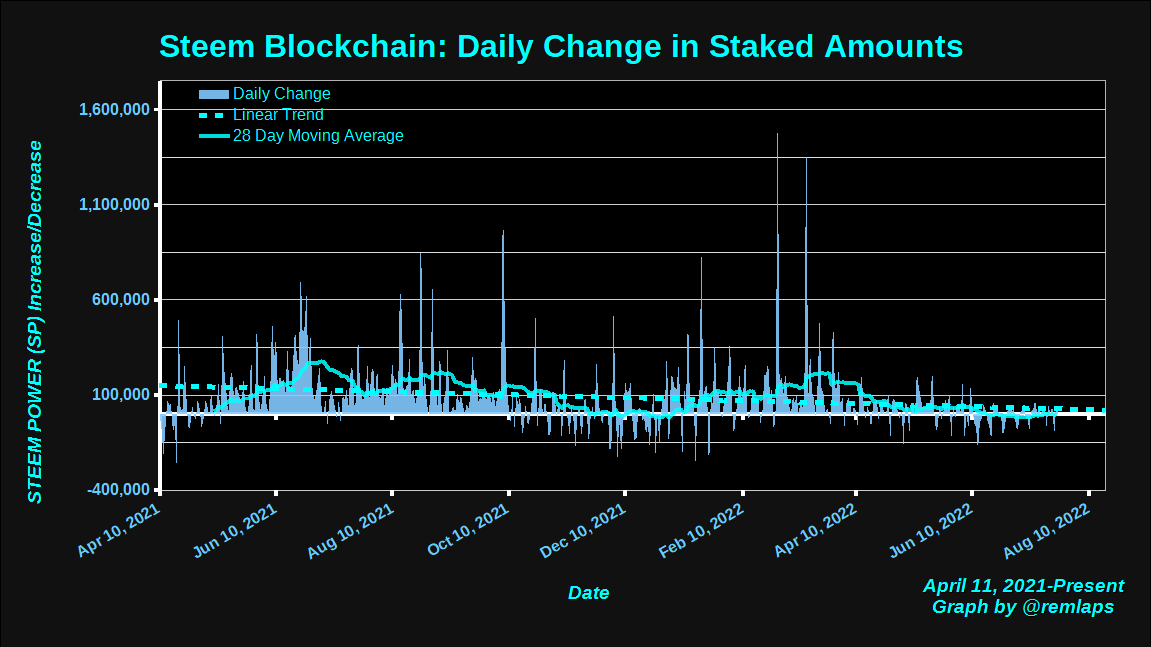
Daily Changes
Here is a chart of daily changes in powered-up STEEM from April 11, 2021 to present. The graph also includes a linear trend line and a 28 day moving average.
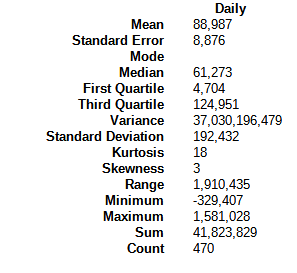
Here are some descriptive statistics, for numbers geeks.
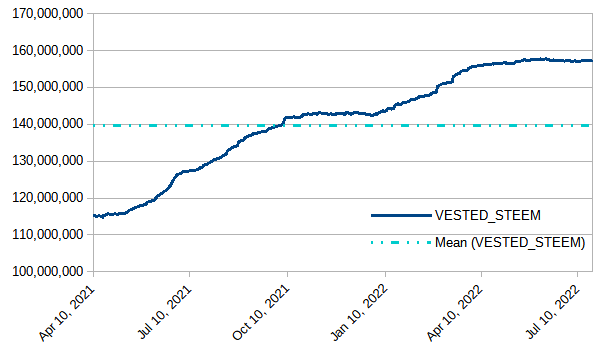
VESTED STEEM
With a weekly decrease of about 13k, or 1/100%, the graph is basically flat for its 7th consecutive week, with an imperceptible downslope.
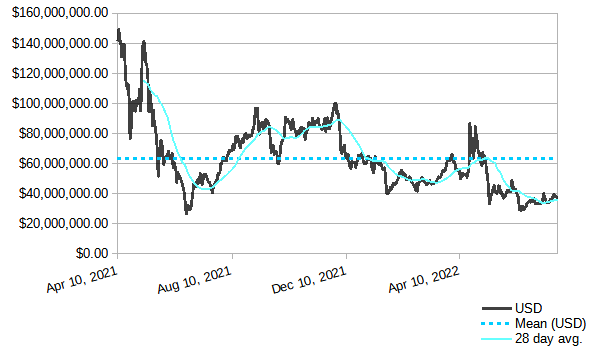
Modeled value of powered-up STEEM in terms of USD
In terms of USD, we saw a weekly increase of about 2.6 million dollars, or a little under 7 1/2%. The value is still below the long-term mean, and holds above its recent low near $34 million. It also remains above the low of ~27 million from June 22, 2021.
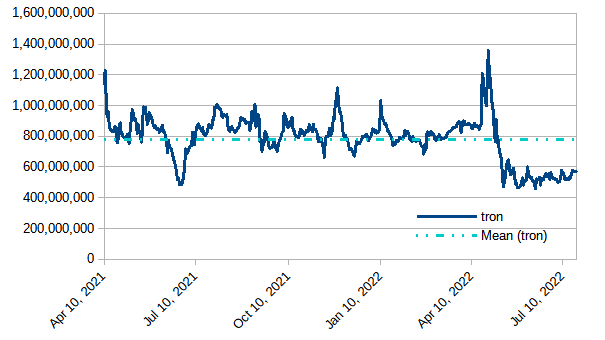
Modeled value of powered-up STEEM in terms of Tron (TRX)
Powered-up STEEM advanced against TRX by about 42 million TRX tokens or a little over 8%.
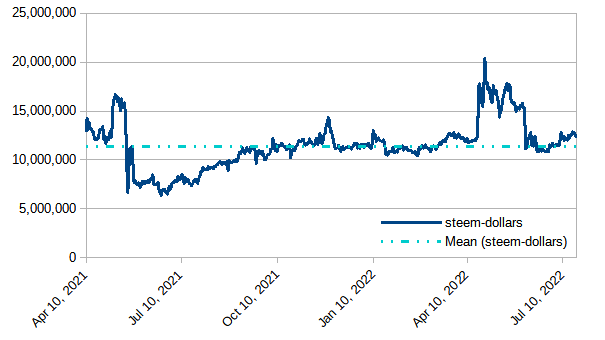
Modeled value of powered-up STEEM in terms of Steem Dollars
Up by about 252K SBDs or 2%
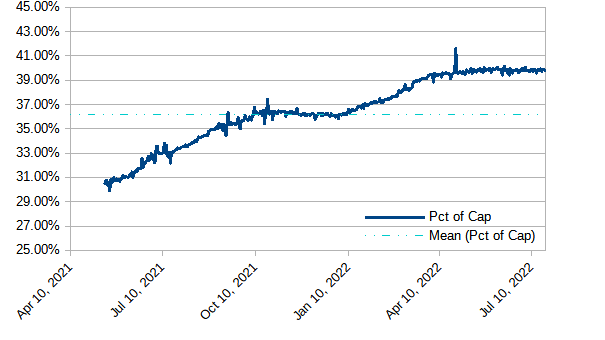
Modeled value of powered-up STEEM as a percentage of Steem's market cap
Still running basically flat for the last couple of months - aside from an anomalous spike on April 26. With today's observed value of 39.81%, we have now seen 111 consecutive days above 39%; 144 consecutive days above 38%; 175 consecutive days above 37%; 302 consecutive days above 35%; and 365 straight days above 1/3. Will it hold above 39%? Will it climb above 40%?
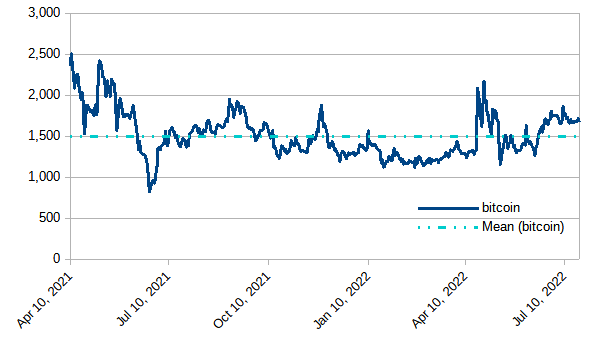
Modeled value of powered-up STEEM in terms of bitcoin (BTC)
Basically flat. Up by about 2 BTC, or 1/10% during the week.
Modeled value of powered-up STEEM in terms of Ethereum
With ETH's massive gains this week, powered-up STEEM lost ground by about 2K ETH, or about 9%.
Modeled value of powered-up STEEM in terms of LTC
Up by almost 12K, or 2%. Still running well above the historical average.
Daily Powerdown Activity
Here is graph with data from steemdb.io to show daily completed and pending powerdown activity. With 611K in powerdowns last week and 556K pending for next week, we can expect powerdowns to decline next week by about 9% or more.
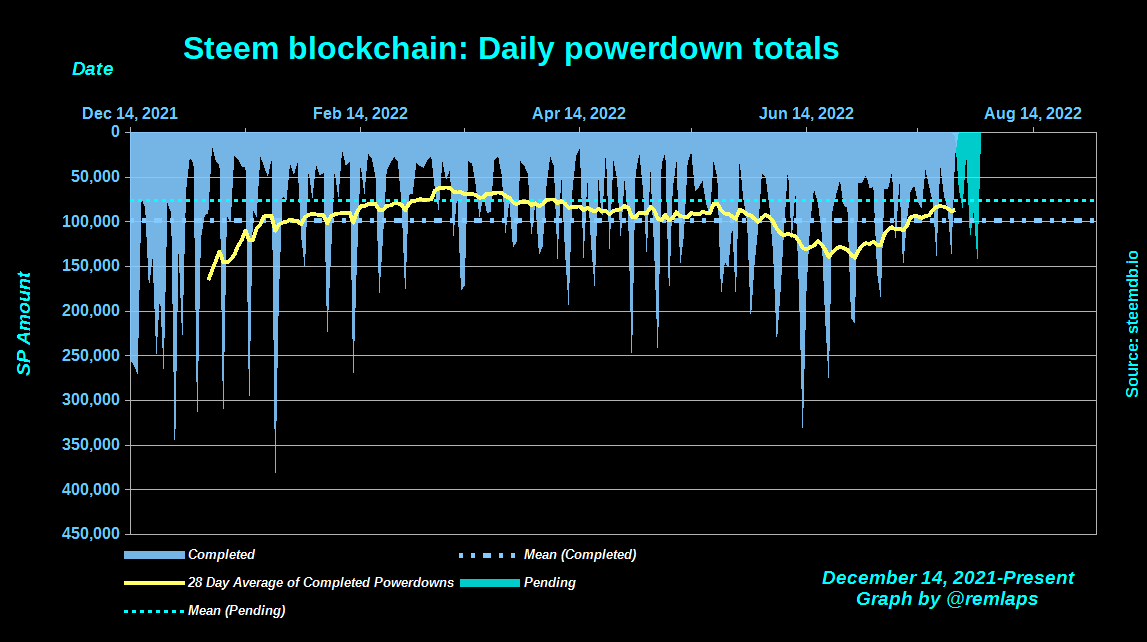
The horizontal lines are the average values for completed (blue) and pending (cyan) powerdowns, and the yellow line is a 28 day moving average of completed powerdowns.
Here are some descriptive statistics for the numbers geeks:
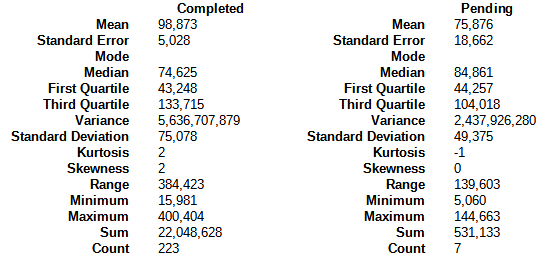
And with a total of 1,206 pending power downs, here are the times, dates, and amounts of the top-10:
 1  2022-07-30T01:20:18 - 128,066,726 MVESTS, 70,827 STEEM
 2  2022-07-28T11:25:33 - 113,994,185 MVESTS, 63,044 STEEM
 3  2022-07-26T06:42:48 - 79,143,661 MVESTS, 43,770 STEEM
 4  2022-07-29T19:18:42 - 78,046,257 MVESTS, 43,163 STEEM
 5  2022-07-28T10:00:18 - 76,114,966 MVESTS, 42,095 STEEM
 6  2022-07-31T16:01:06 - 60,099,975 MVESTS, 33,238 STEEM
 7  2022-07-29T05:27:54 - 36,170,961 MVESTS, 20,004 STEEM
 8  2022-07-25T20:10:00 - 34,412,823 MVESTS, 19,032 STEEM
 9  2022-07-30T11:37:51 - 32,361,504 MVESTS, 17,897 STEEM
10  2022-07-30T10:40:57 - 30,812,124 MVESTS, 17,041 STEEM
Notes
- Reference prices for STEEM and other tokens are downloaded from coingecko.com
Previous posts
- Steem Total Value Powered Up - $34 million - July 3, 2022
- Steem Total Value Powered Up - $37 million - July 10, 2022
- Steem Total Value Powered Up - $36 million - July 17, 2022
- Steem Total Value Powered Up - $38 million - July 24, 2022
For links from 2021 and the first half of 2022, see these posts:
- Steem Total Value Powered Up - $67 million - January 2,
20212022 - Steem Total Value Powered Up - $36 million - June 26, 2022

Pixabay license, source
Reminder
Visit the /promoted page and #burnsteem25 to support the inflation-fighters who are helping to enable decentralized regulation of Steem token supply growth.
The flat curve in VESTED STEEM in recent weeks and the near constant value of powered-up STEEM of around 40% of STEEM's market cap lead me to conclude the following:
Only 40 % of the rewards are powered up on average. What happens to the rest? Do the other 60% go on the exchange? Since only STEEMs have been printed for some time now, this should be a direct result, shouldn't it?
Would that mean that the clubs miss their mark?
Based on watching the first and last graphs alongside the ones you mention, my take is that BAU is somewhere between flat and slowly increasing. From there, when powerdowns rise, the percentage declines, and when big outside powerups happen, the percentage rises.
IMO, the bottom line to explain the long flat curve is that the big powerdowns have outweighed big powerups for about the last quarter.
I could be wrong, but I don't think the curve tells us much about the clubs. I think the daily rewards are too small (as a percentage) to show up here.
At times when any cryptocurrency increases we feel good, the opposite happens when it goes down, it shouldn't be like that, we know that this market is manipulated, what we should do is take advantage of the right moment.
I wish you a happy day
I'm a big fan of dollar cost averaging in order to smooth out the volatility. It's hard not to get caught up in emotions with wild price swings, though.
nice analysis. Based on this analysis, it's easy to predict the Steem price. in other words, as the price of steem changes, there is a change in the number of powerdowns and powerups.
Hive is a unique platform. HBD is a very important stable coin
Your post is manually rewarded by the
World of Xpilar Community Curation Trail
STEEM AUTO OPERATED AND MAINTAINED BY XPILAR TEAM
https://steemit.com/~witnesses vote xpilar.witness