Steem Total Value Powered Up - $47 million - March 6, 2022
This is next in my series of posts reviewing the amount and value of powered up STEEM on the Steem blockchain. For previous posts, see the end of this entry.
Noteworthy in the last week,
- With a gain of 1.58 million, Monday's download recorded the largest daily increase in powered-up STEEM since I started keeping records last April.
- We observed seven consecutive daily increases and new highs in the number of staked STEEM this week. This was the first seven day streak since October 10 (when the streak of daily increases stood at 35).
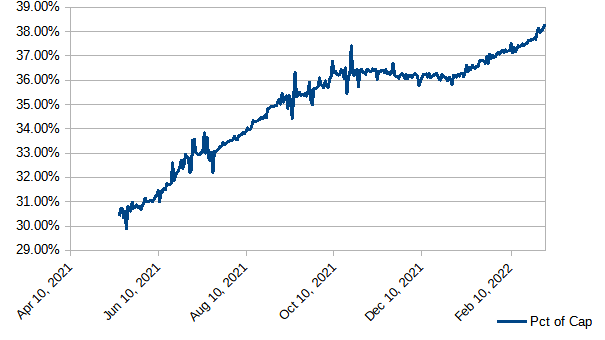
- As a percentage of market cap, powered-up STEEM crossed above the 38% line for the first time on Tuesday (March 1), and again from Thursday until today.
- The modeled value for powered-up STEEM lost ground by less than 5% against all comparison tokens and against the USD.
- With 520K STEEM powered down last week and 310K this week, we saw an overall decline in power downs by about 40%.
Here are the numbers as-of a few minutes ago:
Total value locked in powered-up STEEM (USD): $46,636,228.79
STEEM market cap $121,984,223.27
Locked value in terms of other tokens:
| token | price | locked value equivalent | Jan 1, 2022 | pct of Jan 1 baseline |
|---|---|---|---|---|
| tron | $0.06 | 778,425,143 | 809,173,538 | 96.20% |
| steem-dollars | $4.26 | 10,947,471 | 11,284,131 | 97.02% |
| bitcoin | $39,197.00 | 1,189 | 1,300 | 91.50% |
| ethereum | $2,645.07 | 17,631 | 16,501 | 106.85% |
| litecoin | $104.56 | 446,023 | 411,561 | 108.37% |
| steem | $0.31 | 151,045,579 | 142,930,214 | 105.68% |
| USD | $1.00 | 46,636,229 | 61,837,042 | 75.42% |
And here are the charts, based on data collected daily since April 10.
Daily Changes
Here is a chart of daily changes in powered-up STEEM from April 11 to present. The graph also includes a linear trend line and a 28 day moving average.
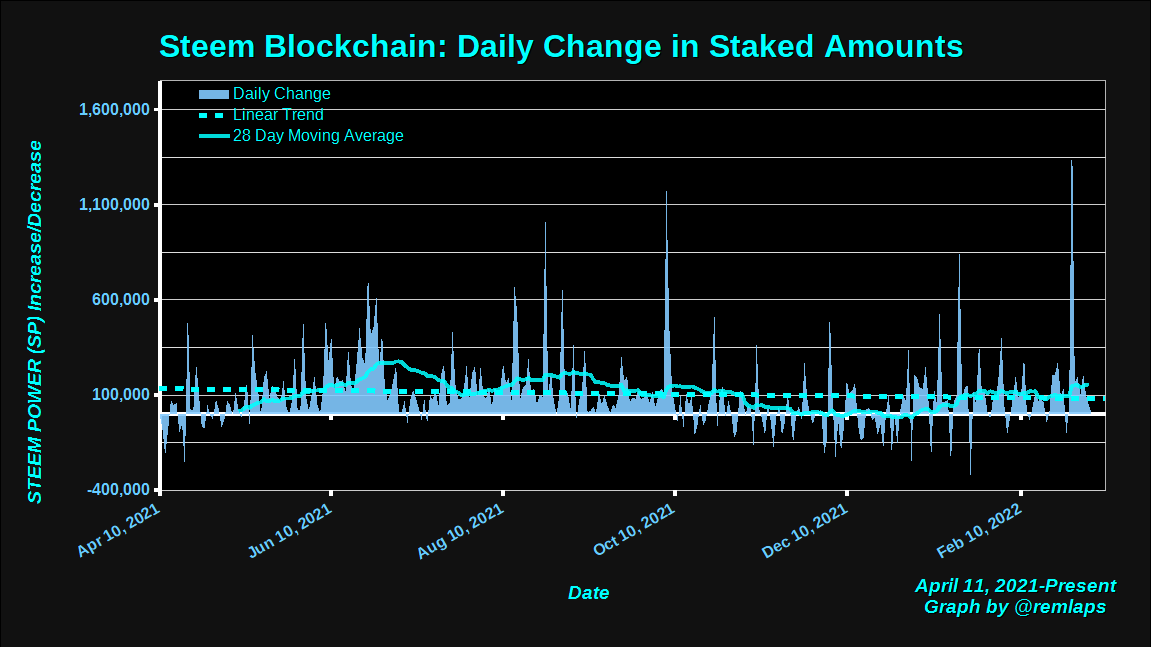
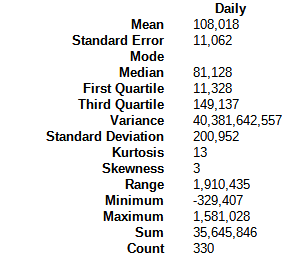
Here are some descriptive statistics, for numbers geeks.
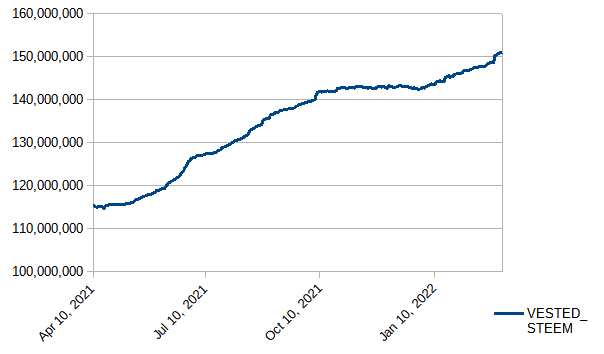
VESTED STEEM
With a weekly increase of about 2.4 million, this week saw seven out of seven daily increases and also new highs each day this week. This is the ninth consecutive week with a clear upward slope. We also saw an all time high daily increase of about 1.6 million on Monday (Feb. 28).
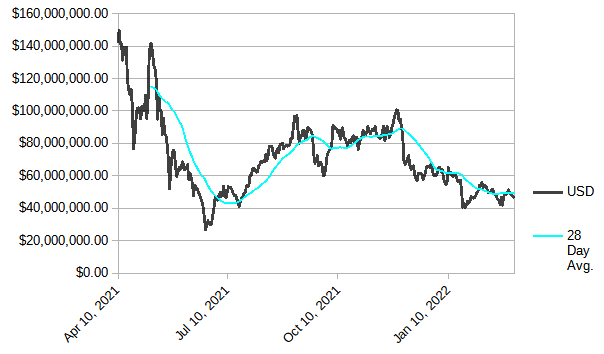
Modeled value of powered-up STEEM in terms of USD
In terms of USD, we saw a weekly decrease of a little over $2 million, or 5%. The value remains above its summertime and more recent lows.
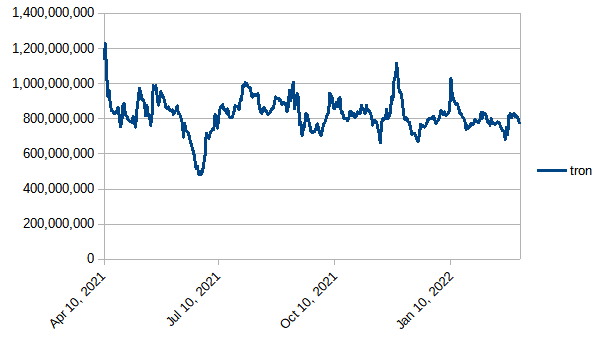
Modeled value of powered-up STEEM in terms of Tron (TRX)
Tron gained strength against powered-up STEEM by 35 million tokens, or about 4%. At today's download time, the total had drifted back below the 800 million line, but as of a few minutes ago it's above 800 million again.
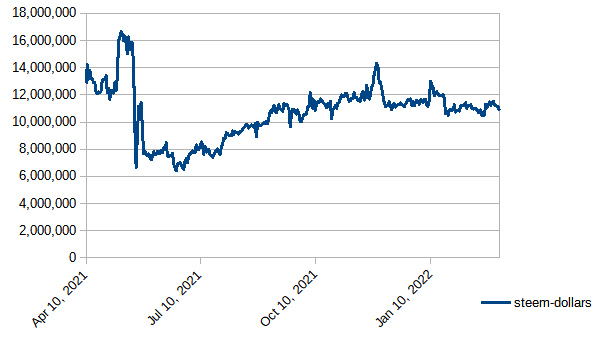
Modeled value of powered-up STEEM in terms of Steem Dollars
Down by about 40k SBDs, or a little under 4 1/2% this week.
Modeled value of powered-up STEEM as a percentage of Steem's market cap
Gained ground this week, crossing above 38% for the first time and reaching a new high at 38.24% yesterday (March 5). We have now seen 4 consecutive days above 38%; 35 consecutive days above 37%; 65 consecutive days above 36%; 162 consecutive days above 35%; and 225 straight days above 1/3. Also, the graph has started to reestablish an upward-seeming slope since the beginning of 2022. Will it hold above 38%? Will it reach new highs or even go above 39%?
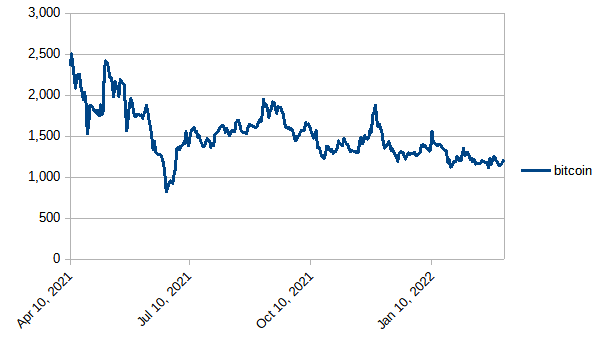
Modeled value of powered-up STEEM in terms of bitcoin (BTC)
Down by about 55 BTC, or 4 1/2%, during the week.
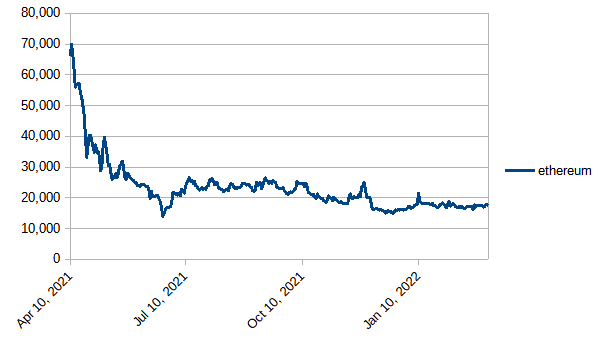
Modeled value of powered-up STEEM in terms of Ethereum
With a loss in strength of about 21 ETH, powered-up STEEM was slightly down, but basically flat against ETH..
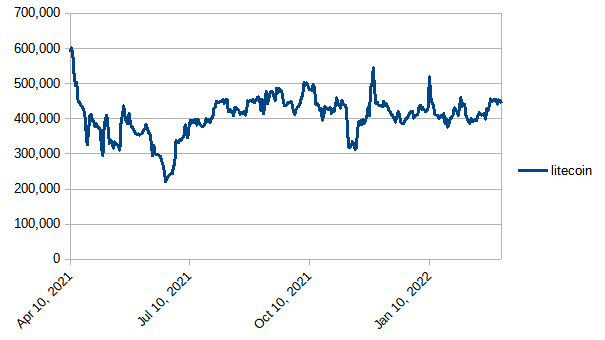
Modeled value of powered-up STEEM in terms of Litecoin
Powered-up STEEM lost ground by about 6k LTC, or 1%. Still hanging around the 400k - 500k band.
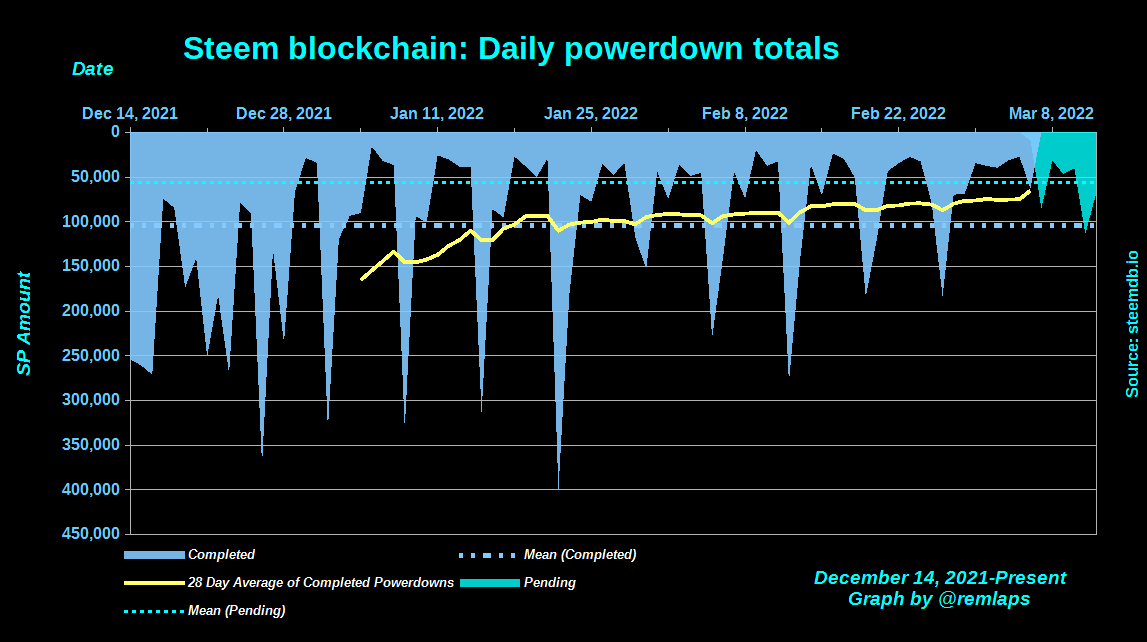
Daily Powerdown Activity
Here is graph with data from steemdb.io to show daily completed and pending powerdown activity. Overall, with about 310K powered down last week and 450K pending, we can expect an overall increase in powerdowns by about 48% or less in the coming week.
The horizontal lines are the average values for completed (blue) and pending (cyan) powerdowns, and the yellow line is a 28 day moving average of completed powerdowns.
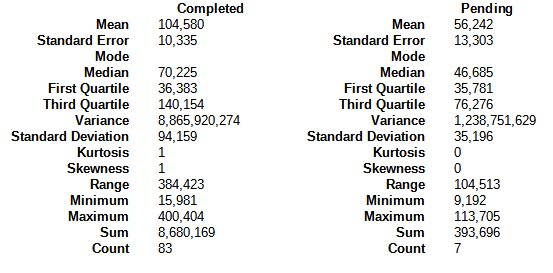
Here are some descriptive statistics for the numbers geeks:
Notes
- Reference prices for STEEM and other tokens are downloaded from coingecko.com
Previous posts
- Steem Total Value Powered Up - $67 million - January 2,
20212022 - Steem Total Value Powered Up - $57 million - January 9, 2022
- Steem Total Value Powered Up - $60 million - January 16, 2022
- Steem Total Value Powered Up - $43 million - January 23, 2022
- Steem Total Value Powered Up - $46 million - January 30, 2022
- Steem Total Value Powered Up - $54 million - February 6, 2022
- Steem Total Value Powered Up - $50 million - February 13, 2022
- Steem Total Value Powered Up - $46 million - February 20, 2022
- Steem Total Value Powered Up - $48 million - February 27, 2022
- Steem Total Value Powered Up - $47 million - March 6, 2022
I am facing problem to read your blog without desktop mode on my phone after 6 February 2022.
I'm sorry to hear that. February 6 is when I changed the table at the beginning to include the percent of baseline, so maybe it's something with the size of that table.. I'll see if I can find anything, but it works on my phone without desktop mode, so I don't have a way to duplicate the problem.
L'attuale capitalizzazione delle criptovalute è molto influenzata dall'attuale conflitto, tuttavia, penso che avrà una ripresa nei prossimi mesi, l'adozione di queste aumenterà il loro valore, l'abbiamo già attraversato, la volatilità di questo mercato
It's been a very good week. The increase in stake is incredible
I could not find the users who made the most SP on Steemdb.io. If I had reached him, I could have analyzed it better. Increasing SPs is beneficial for blockchain security
Buying at this moment and period is useful, it will be great opportunity
Hopefully steem value is going to increase very soon and this is perfect time to power up steem. We should encourage people to power up and stop power down. Thanks for your deep analysis.
The steem exchange rate is still as stable as last week. It has not strengthened or decreased significantly. I think if the powerdown volume can be reduced, then the price of steem will strengthen by a few points next week. That is my opinion
When the Steem price got cheaper, people bought it and made power ups.