The Magic Fibonacci Retracement tool that keeps making me richer
Fibonacci Retracement
Fibonacci Retracement is a very popular trading tool and it is becoming more and more popular in all markets, including Cryptocurrency. It’s one of my favorite trading tools when analyzing charts because the cryptocurrency market reacts very easily to the Fibonacci levels.
This will be a general explanation of how the Fibonacci retracement tool works and how it helped me make immense profits in the cryptocurrency market. You can go more in-depth about it here.
You only really need to learn one thing about Fibonacci retracement trading tool and that is the key levels (38.2%, 50%, 61.8%, 78.6%) that act as support and resistance. These key levels act as resistance when the price is going up and as support when the price is going down.
The levels mentioned above are very important because professional traders know that trends tend to retrace a certain percentage before they keep moving in their original direction. Using the Fibonacci retracement tool you can anticipate these possible reversals in a retracement. I find that the most frequent reversals happen at a 50%, 61.8% and 78.6% in the cryptocurrency market.
Note: 50% is not part of the actual “Fibonacci Sequence” but it is widely used by traders.
Let’s have a look at some recent Fibonacci retracements that I was able to play this week.
Example: DYN/BTC
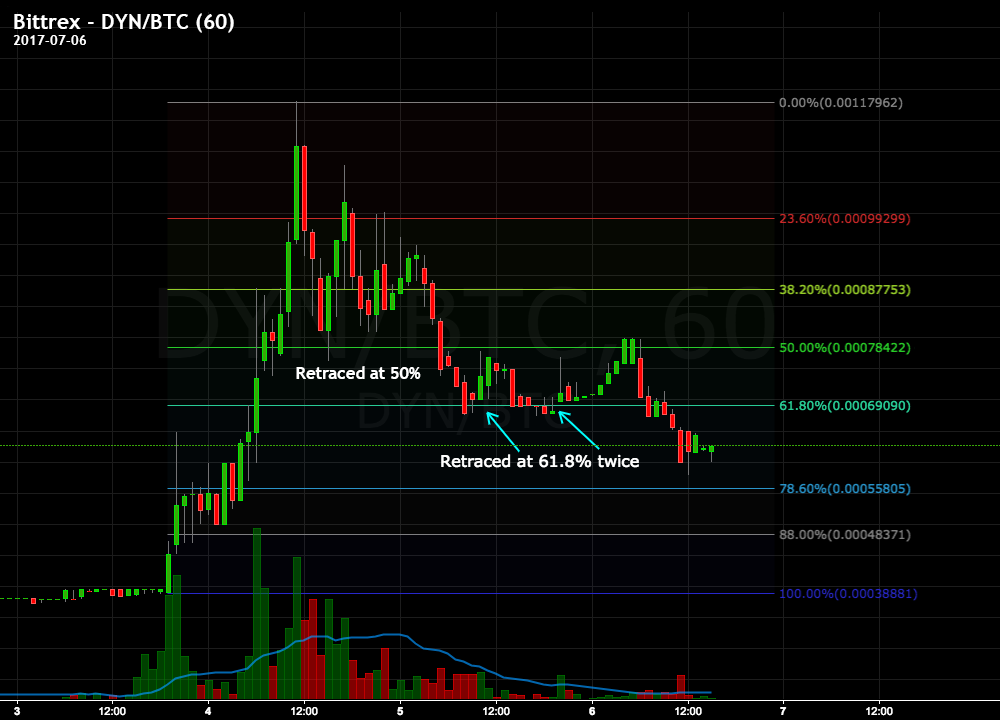
DYN had a nice 285% increase from around 38k to 118k satoshi before it started retracing. We can see on the chart that it reached the 50% Fib support level for a nice up candle profit before continuing and heading down to the 61.8% Fibonacci level where it reversed twice and tagged the 50% resistance almost both times. Now it’s heading for the 78.6% Fib retracement level where it will have to decide on respecting the 78.6% retracement or not.
Whenever a retracement starts, I always put my buy order at the 61.8% and 78.6% support levels because they are the most respected levels in most cases.
Example: AGRS/BTC
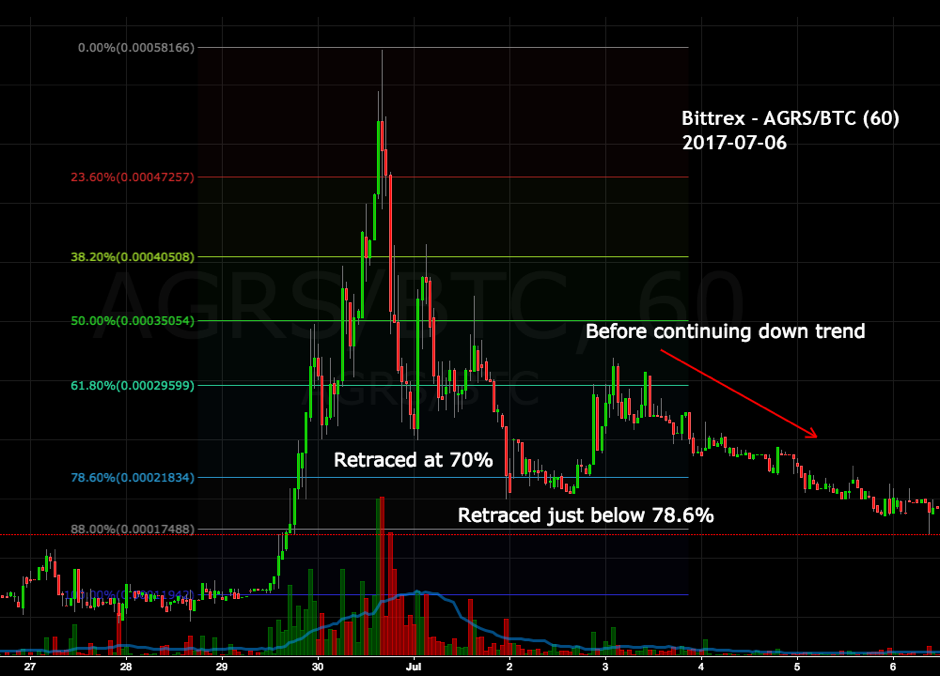
AGRS/BTC had a huge impulsive wave from around 11.5k Satoshi all the way up to around 58k Satoshi. That’s a 500% increase and a pretty big and sudden dump after that until it reached a 70% retracement and rocketed through the 61.8% and 50% retracement. So you can see that it didn’t respect the 61.8% retracement area and went straight down to about 70%. But even if you had filled an order at 61.8% and held, then you would have still bagged a profit after the reversal at 70%.
I find it then once a coin has made a significant Elliot impulsive wave up, then it is more than likely to break through the first 3 Fib retracement levels without any respect.
I can go on and on with different examples of the Fib retracement in my recent trades but if you are still not sure if the Fibonacci retracement tool works, then I would suggest you be safe and test out the 61.8% and 78.6% support levels because they have less risk of failing than the other levels from my experience.
We love using the fib retracement tool! Helps a lot with making some more educated "guesses" on where the markets will revers.
The fib expansion tool is another great Fibonacci based tool that we use to set profit targets in our long positions.
Good job! We will be following ;)