The Real Death Cross for Bitcoin - Have we been focused on the wrong Moving Averages?
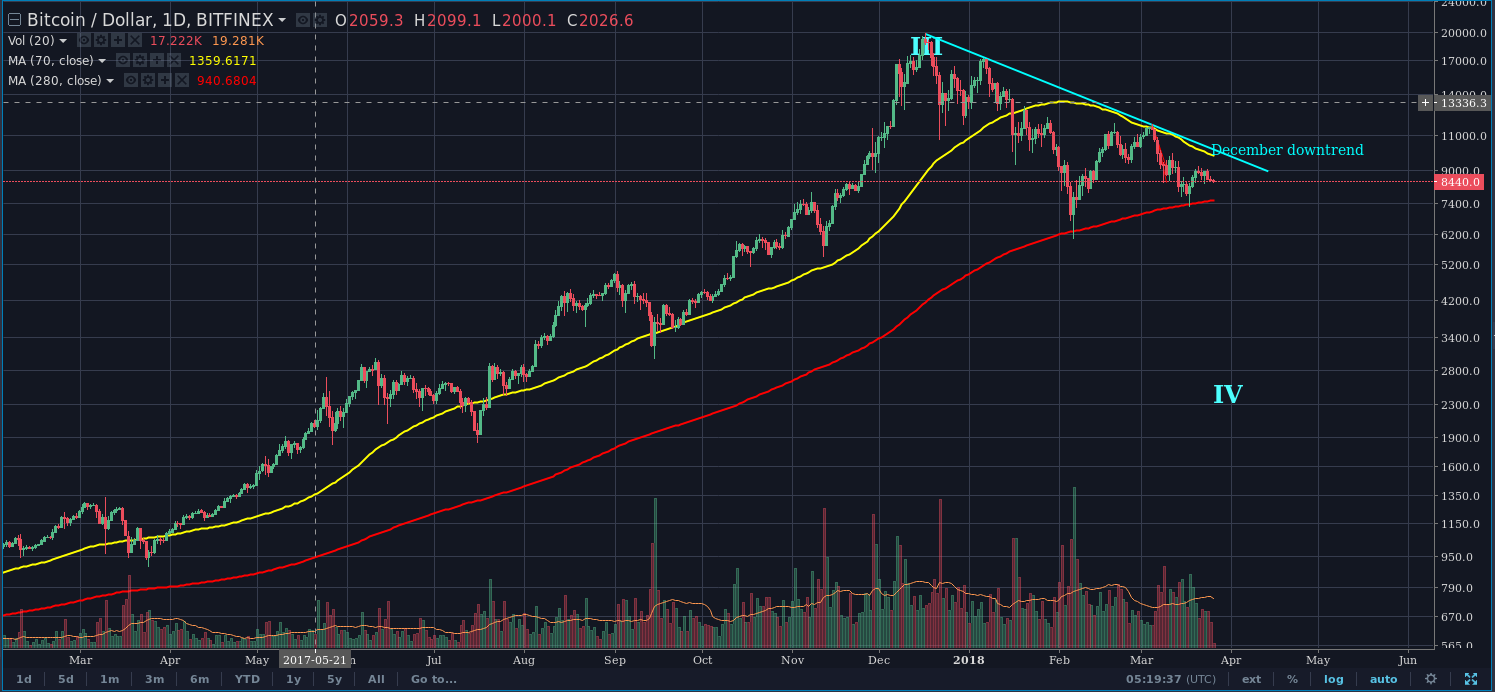
Stock markets use the 200 day MA and 50 day MA because one represents 40 weeks of trading, while the the other - 10 weeks. This makes sense for markets that only trade 5 days per week. Crypto markets trade 7 days per week, not 5. Would it not make a lot more sense for us to use the 70MA and the 280MA?
Let's compare the charts
Here's the 50MA/200MA
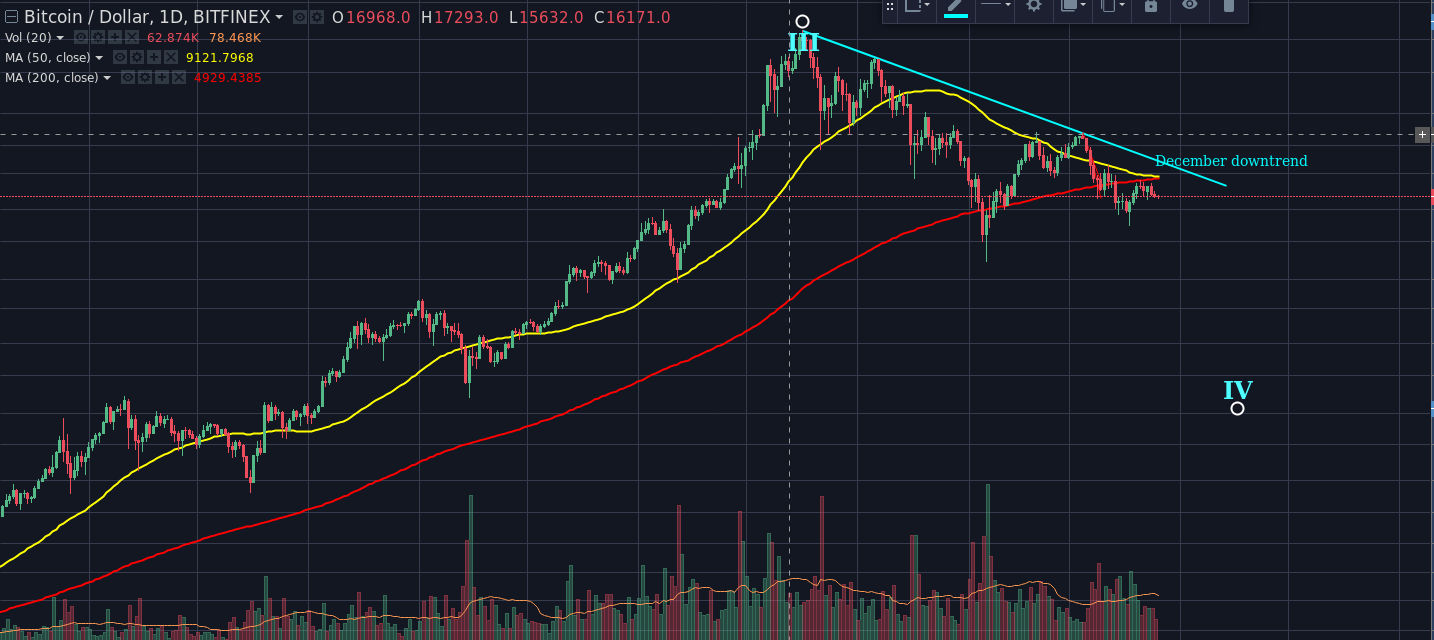
And now, the 70MA/280MA
And here's 2014, with both sets on the chart.
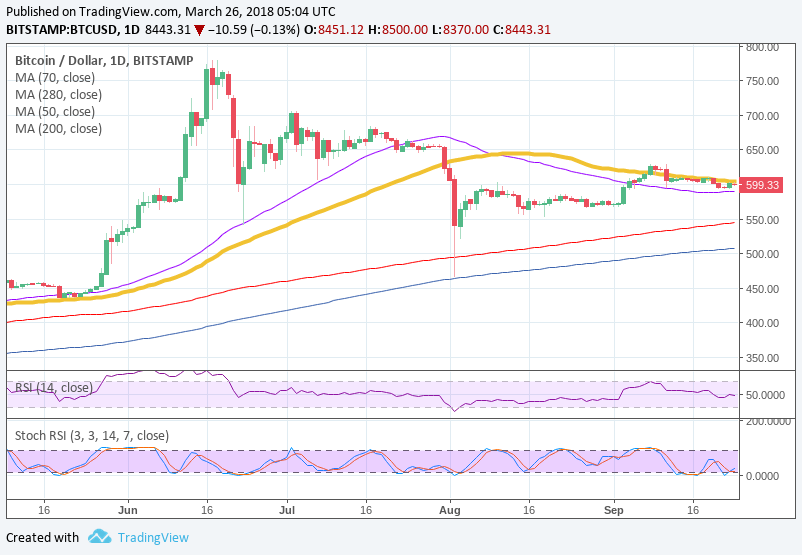
Yellow and Blue are 70 /280, Purple and Red are 50/200.
The 70 and 280 MAs appear to be more significant to me. What do you guys think?
For future viewers: price of bitcoin at the moment of posting is 8440.00USD
This post has received a 1.40 % upvote from @booster thanks to: @ashaman.