Bitcoin $BTC Under Pressure: What the BTC/USDT Chart Is Revealing
Bitcoin $BTC Under Pressure: What the BTC/USDT Chart Is Revealing
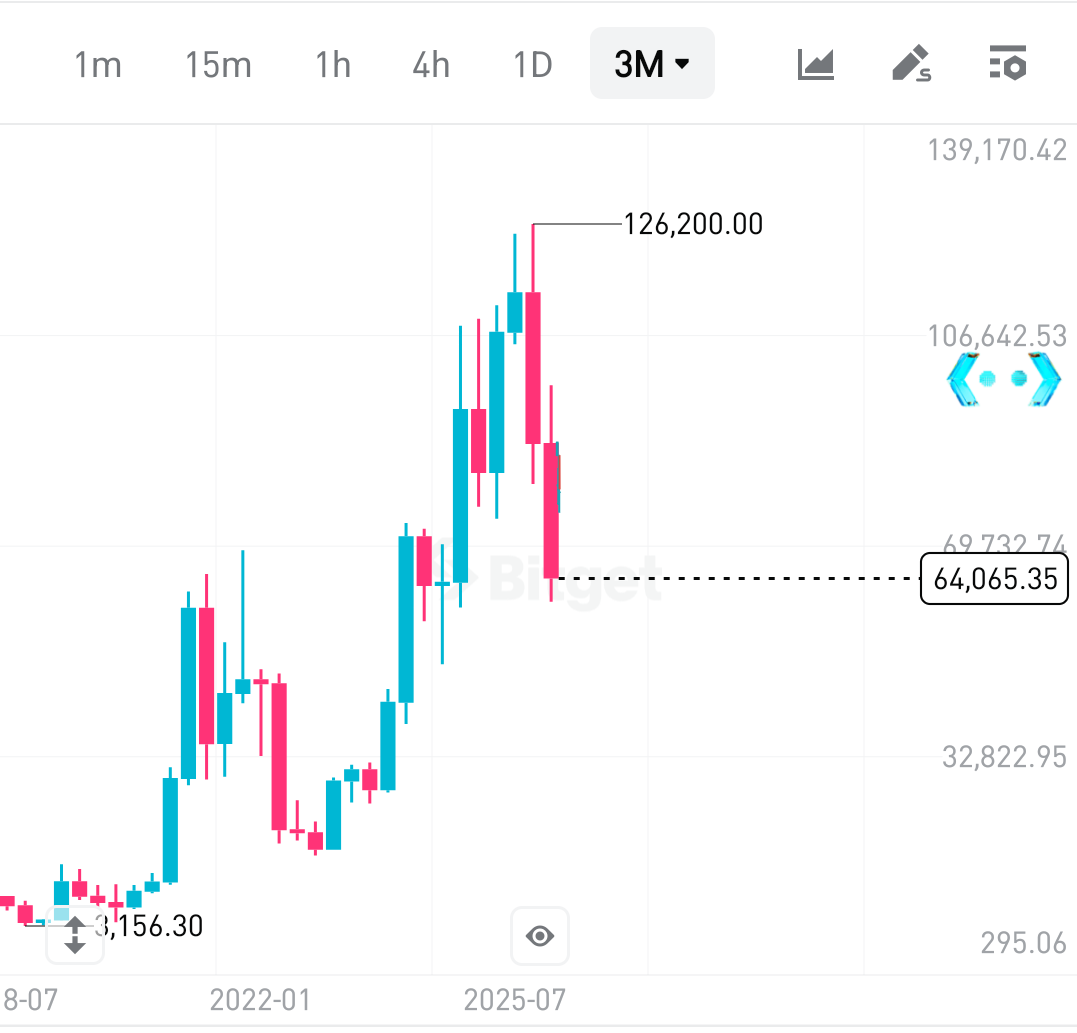
A close look at the BTC/USDT chart paints a clear picture of a market facing strong selling pressure. Bitcoin is currently trading around $64,012, reflecting a sharp 10.39% decline within the last 24 hours. This drop is not just a minor pullback—it signals a shift in market sentiment that traders cannot ignore.
Over the past day, Bitcoin attempted to maintain higher levels near $71,984, which marked the 24-hour high. However, buyers failed to hold that zone, and price quickly retraced toward the $60,000 area, which now stands as a critical short-term support. The rapid move downward suggests aggressive profit-taking and rising fear across the market.
Volume Confirms the Move
The 24-hour trading volume sits at approximately 25.71K BTC, with a total turnover of around $1.7 billion USDT. This level of activity confirms that the move is backed by real participation rather than low-liquidity volatility. When heavy volume aligns with strong red candles, it often reflects conviction from sellers.
Three-Month Perspective
On the 3-month timeframe, Bitcoin’s price action shows a dramatic rise toward the $126,200 region before facing a powerful rejection. That rejection became a turning point, triggering a sustained bearish move. Since then, price has consistently printed lower levels, indicating that the market is still in a corrective phase rather than a healthy consolidation.
Performance data further supports this view. While Bitcoin shows a modest +1.76% move today, the broader picture remains weak:
7 days: -24.03%
30 days: -29.95%
90 days: -37.44%
180 days: -46.34%
These numbers highlight how deep the correction has been over recent months.
What This Means for Traders
For traders, this environment demands patience and discipline. The $60,000 zone is acting as a psychological and technical support, but repeated tests weaken any level. If this support fails, further downside cannot be ruled out. On the other hand, any recovery attempt must first reclaim and hold above the $69,000–$70,000 range to signal renewed strength.
Final Thoughts
Bitcoin’s current structure reflects uncertainty and caution. While long-term believers may view this phase as a necessary reset, short-term traders should remain alert. The chart clearly shows that the market is no longer driven by hype, but by fear, volume, and hard decisions. In times like these, price action speaks louder than predictions.