Bitcoin price technical analysis
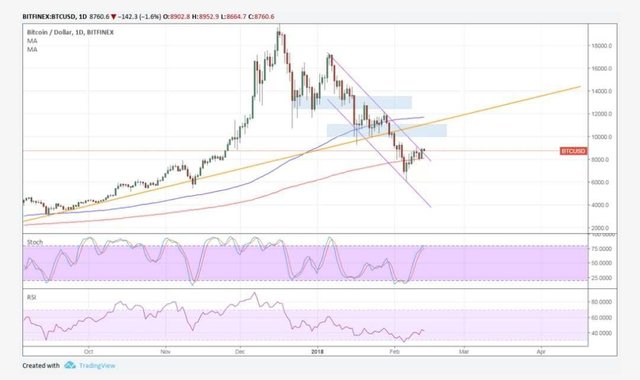
The 100 SMA is safely above the longer-term 200 SMA on the daily time frame, confirming that the path of least resistance is to the upside. The 200 SMA is holding as dynamic support as well.
A candle appears to be closing above the descending channel resistance, and this is an early signal of a reversal from the short-term sell off. From here, bitcoin price could set its sights on the $11000 to $12000 area of interest next. This lines up with a former horizontal support and a broken rising trend line.
After that, sustained bullish momentum could take bitcoin price to the next barrier around $13,000 to $14,000 which would be back above the trend line.
The 100 SMA is safely above the longer-term 200 SMA on the daily time frame, confirming that the path of least resistance is to the upside. The 200 SMA is holding as dynamic support as well.
Market Factors
Bitcoin price is also able to benefit from the improvement in investor sentiment these days. Note that the cryptocurrency has been trailing higher-yielders and risky assets like stocks and commodities, which tend to rally when traders are in the mood for more risk.
Apart from that, easing concerns about strict regulation in the cryptocurrency industry are in play. Following the Senate hearing encouraging regulators to give way to development even with increased oversight, other nations could follow suit and this might be evident in the upcoming global summits.
At the same time, crackdown efforts in South Korea appear to have taken the back seat as traders are now being more hopeful that governments and regulators could be more welcoming of bitcoin developments.
@bitcoin510 vote+comment
good.
Good analysis
Nice analysis