Bitcoin in fall see in the graphics?
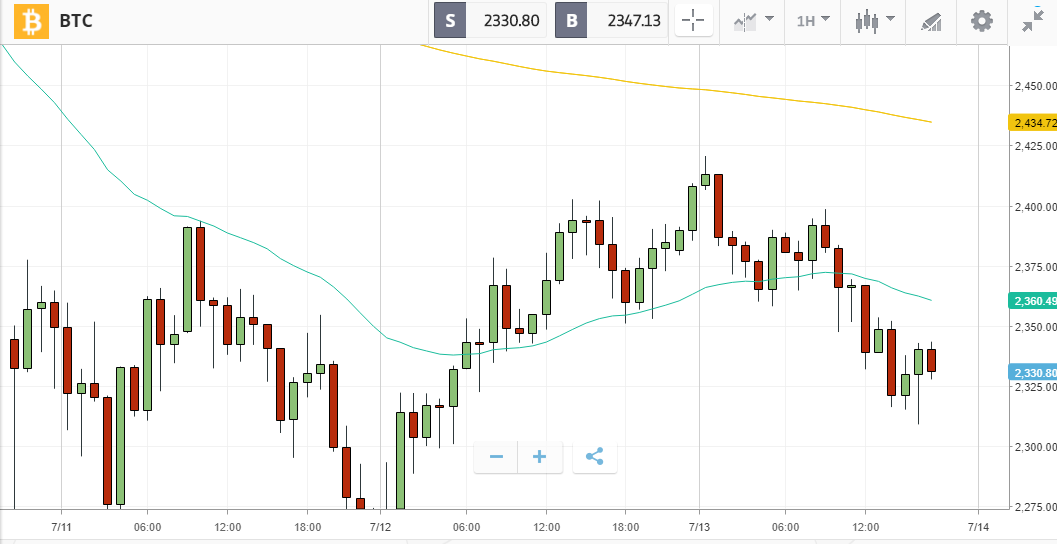
Bitcoin today has kept below the 200-month moving average, ranging from $ 2,417 to $ 2,313. Everything indicates that it goes down to support at $ 2,253. In the H1 chart
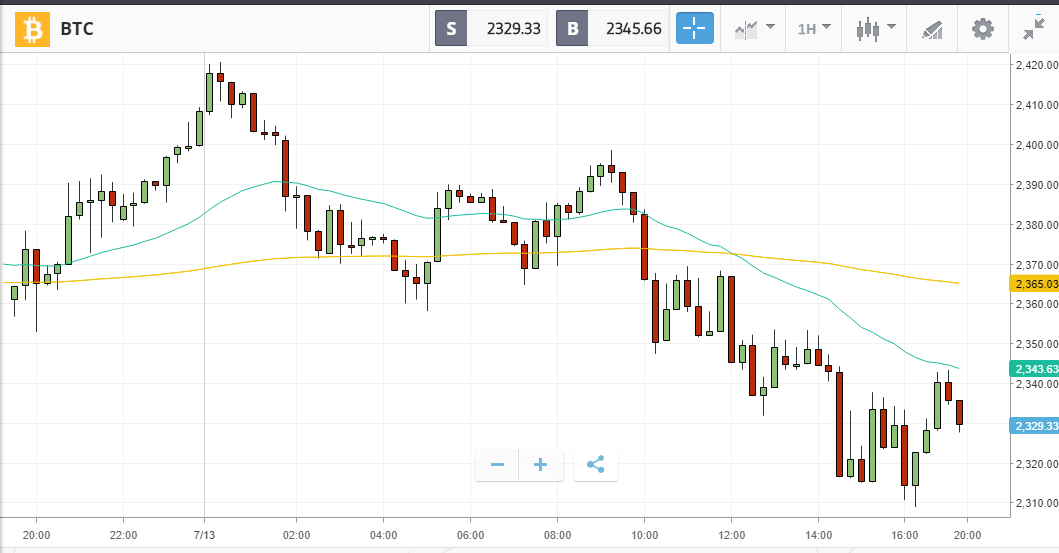
Also note that in the 15 minute chart it is below the 200-day moving average and the 34-day moving average. This is getting bitcoin down.
As coisas só vão melhorar depois de 1 de agosto. Até lá vai oscilar muito.
Obrigado jsantana