The Markets Are In A Panic - Are We Close To A Capitulation In Stocks & Bitcoin?
New Records Set For The Wrong Reason
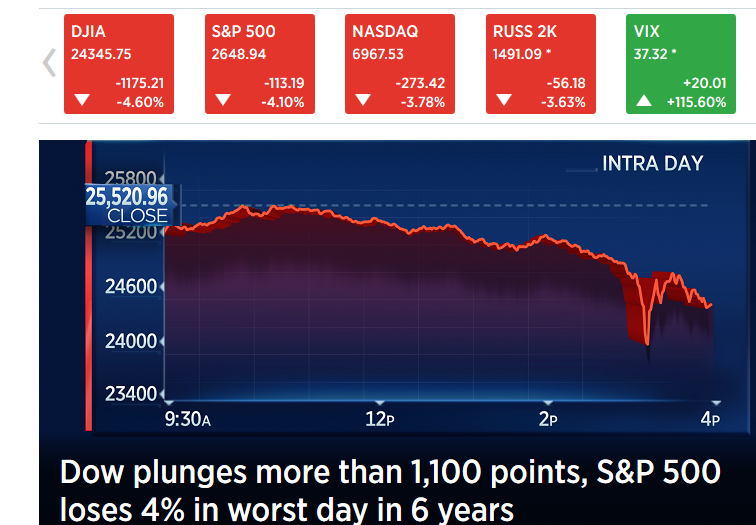
Today in the US stock market investors and traders witnessed something that has never happened before. The Dow Jones Index fell for the first time ever over 1000 points surpassing the previous record by over 400 points as the market closed down 1175 points lower at 24,345.
Although it sets a new record for points fallen it has not surpassed the record for the biggest percentage loss in the history of stocks as of yet but the year has a long time to go.
From the image below you can see that all the major indexes in the US fell sharply, while the VIX index which measures volatility had an amazing day with a whopping 115% move in a single trading day.
The Selling Continues In The Futures Market
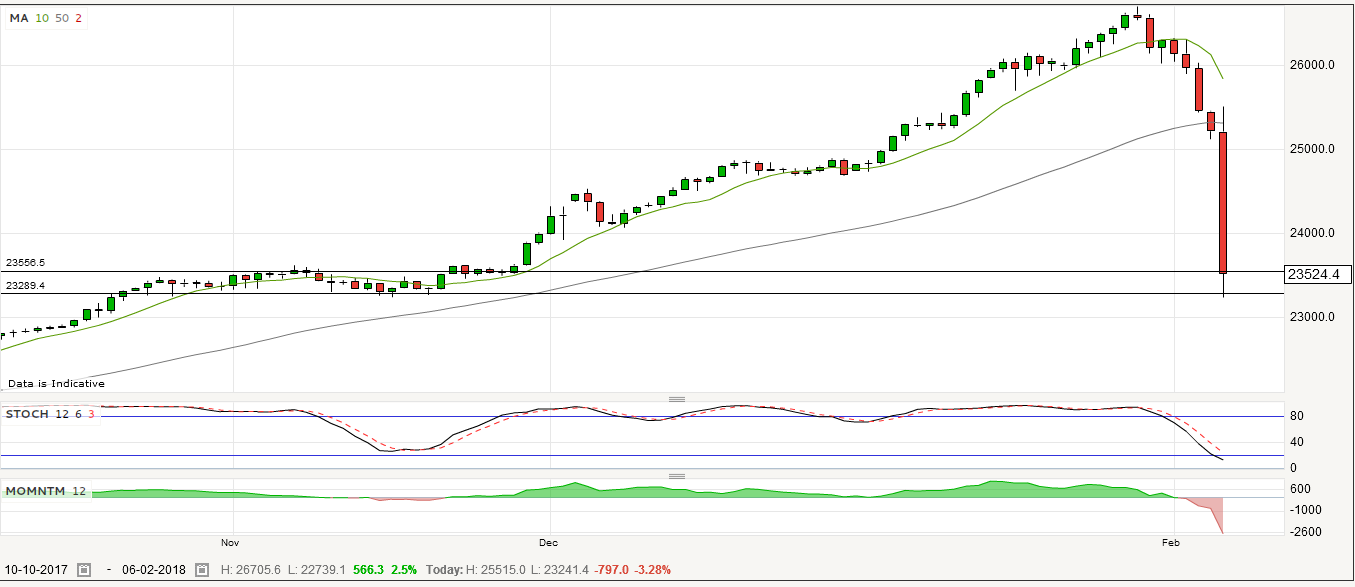
After the market closed in the US the DOW futures had quickly turned to further selling and was trading approximately 200 points lower minutes after the close of the market on the futures exchange.
However at the time of writing this post around lunch time in Asia trading, the DOW was trading a further 900 points lower around the 23,500 level. This is remarkable and shows the clear panic and potential capitulation that is about to reached in the market in the short term.
Capitulation is when we have reached a peak amount of selling and all the immediate sellers have exited the market and there is no one left to sell. When this happens we usually witness a sharp bounce higher which is usually a false signal or bull trap for novice investors and traders. Nevertheless the rise higher can be as spectacular as the falls.
Gold Finally Catches A Bid
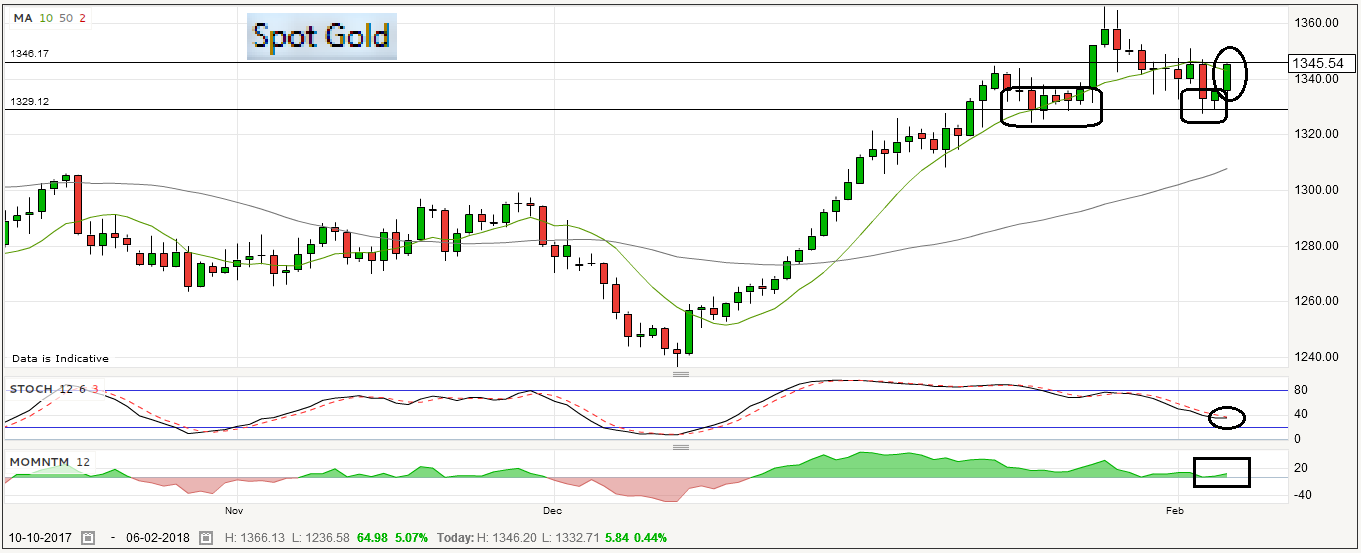
In today's panic market action the Gold market finally caught a bid and the price moved up slightly among the chaos in stocks. In early Asia trade the buying continued into the next day with the technicals showing a move higher is imminent.
After hitting a double bottom shown by the 2 rectangle boxes on the price action, the Gold price rallied higher and is currently breaking out above its 10 day moving average which is a bullish sign.
In addition the two momentum indicators I utilize (Momentum & Stochastic) are indicating a reversal is about to take place. First momentum is green and rising on the daily chart and secondly the stochastic is close to forming a bullish cross reversing pattern.
NB: A word of caution - The daily chart for Gold is still currently trading and has not finalized and confirmed the bullishness. Confirmation is required before we can see further follow up buying coming through in the Gold market.
We May Be Close To A Short Term Bottom In Bitcoin & Cryptos
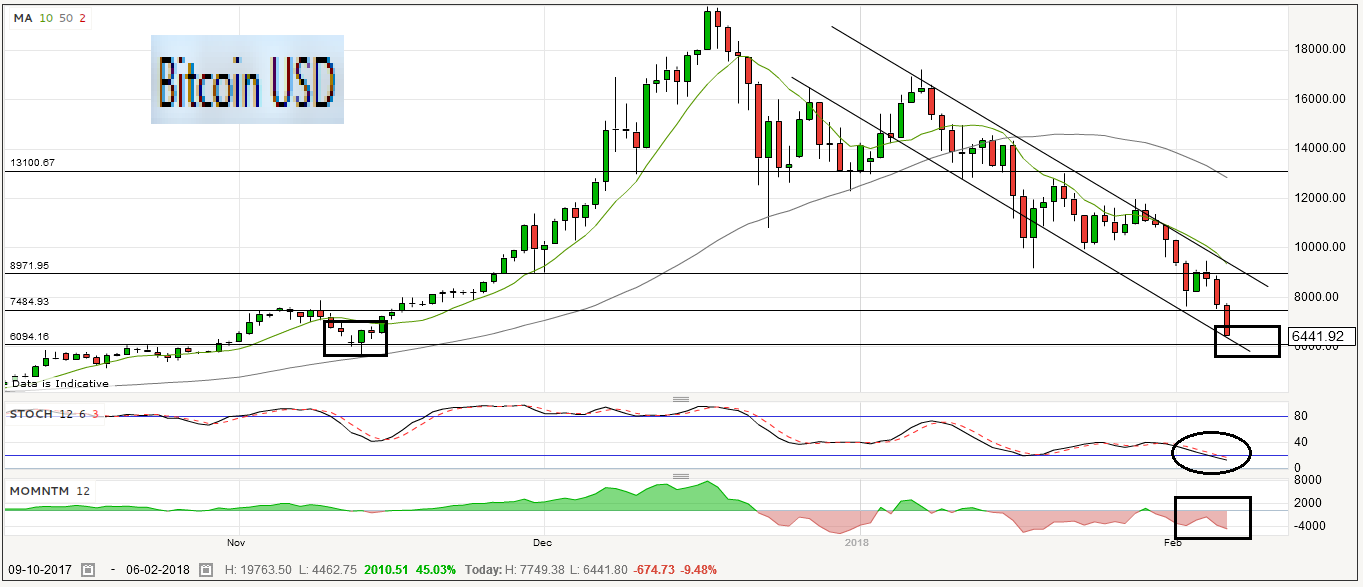
The current price action in Bitcoin has been brutal recently especially in the last 30 days where we have seen a fall of around 60%+ in this short time frame.
In the daily chart below you can see that there is a good possibility that there is still some more selling, as it approaches a key support line at around $6,000 - $6,100 price level. Given the price is currently around $6,400 there is some more pain ahead before approaching support.
The momentum indicators are flashing red and with the panic in the market across all risk assets, its possible that we may completely pass the support level.
However the fact that we are close to a key support level and we are touching the bottom of down trending channel suggests to me that we could see a short term bounce in Bitcoin and Alt coins in the coming trading days.
This would be especially true if some how the stock market was to reverse course today or the next few days with a calming official announcement from the FED chairman in the US.
My gut feeling is that if the selling continues in stocks we will soon that announcement sooner than later.
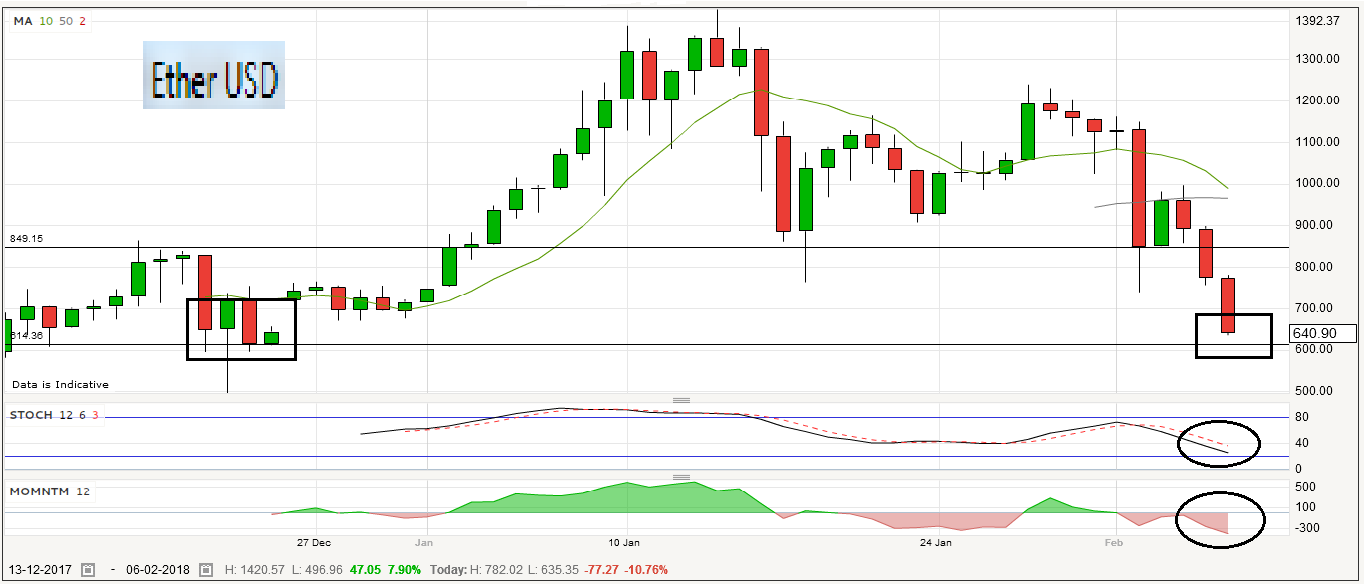
Ether Shows Similar Pattern To Bitcoin With Support In Sight
Ether has followed a similar fall down to Bitcoin haven lost over 50% in the last 2 weeks as the price currently is trading around the $640 level.
Based on the support levels shown Ether's support level is around the $600 - $610 level which is only a small distance to fall before reaching. Like Bitcoin the momentum indicators are confirming the current weakness in the Cryptos space for Ether.
Its possible in the current climate of the market that it too closes passed the nearing support level. This is especially true as the price action of Ether is tied to Bitcoins fortune like the other Alt coins for now. Therefore if we experience a short term bounce for Bitcoin Ether will follow through with a reversal as well.
Happy trading and stay CALM.
Thanks for viewing this post

Disclaimer: This post is for educational purposes only, and all the information contained within this post is not to be considered as advice or a recommendation of any kind. If you require advice or assistance please seek a licensed professional who can provide these services.
Sources:
Click the links below to view my latest Steemit posts:
Sydney Real Estate Investors Are In For A Rude Shock As The Market Finally Cools Down
Bitcoin BTC - Is A Breakout Imminent As US Stocks Come Under Pressure?
Nice post! I think if we can get one more major selloff in Bitcoin or stocks, that will be the bottom. Or at least we will get a good bounce before the next selloff. I see stocks selling off some more but not BTC. It has sold off so much already. I think 5000 is the bottom.
Thanks for your feedback - I really think the reversal will come from the direction the FED has on risk assets incl Bitcoin. Will be interesting this week though.
Hi @jasonstaggers asked me to reach out to you about joining Team Australia. you'd like to be part of it, then please check out this link for the instructions on how to join https://steemit.com/teamaustralia/@choogirl/team-australia-new-recruits-07-02-18-and-the-team-australia-hard-fork