Litecoin Analysis $LTCBTC Trading Pair @Poloniex - 4 Hour Chart (6/22/17)

Litecoin/Bitcoin Chart:
https://jp.tradingview.com/x/YaAOaVcd/
TL;DR Hopefully you went long! :)
Analysis:
We're going up! Hopefully you went long under 0.0165. I would take some profit here with an anticipated drop to re-rest 0.0165, if you went long from the green dotted line in my first post you're up ~13% Bitcoin went up just a bit, right along side my arrow. When I chart on the 4hour bars I try to stick with charting the next 6 bars only. Frequently I'll see traders draw straight lines on the hourly chart, but straight lines rarely happen, especially on the hourly; unless of course, you're trading a pair that is low volume. Today I'll also be including an $LTCUSD, $LTCXMR, $XMRBTC, and $XMRUSD charts.

Bitcoin/USD Chart:


Litecoin/USD Chart:
https://jp.tradingview.com/x/B65QhWdU/
Analysis: The $LTCUSD pair is looking very similar to $LTCBTC. I'd be watching for a re-test of $43 before going higher, and also watch closely for the blue swoop to play out somewhere around the arrow I've drawn. The green and purple lines are key areas identified in the $LTCBTC chart, just converted and re-drawn for the $LTCUSD pair :)

$LTCXMR Chart:
https://jp.tradingview.com/x/BOX52lfE/

Analysis:
Now I know what you're thinking, "@daniweav no one trades this pair! " and you'd be right, except you're wrong because there's volume on this pair and traders are making money from it. If I was any better at this, I would have pulled up this chart 2 days ago for my first $LTCUSD analysis so I could have told you to buy $LTC so you could make a move and pick up some cheap $XMR to increase your buying power. For that, reader, I apologize :( But I hope this lesson of missing out has explained why it's important to chart the $LTCXMR pair. One of my favorite "obscure" pairs to watch is $ZECETH but that's for another series I suppose :)

$XMRBTC Chart:
https://jp.tradingview.com/x/C1S3GrAR/
Analysis:
$XMRBTC is a buy, looks like it's going to appreciate against Bitcoin soon, becuase there is a weak looking triple bottom. You can read more about the tripple bottom pattern here: http://www.investopedia.com/terms/t/triplebottom.asp

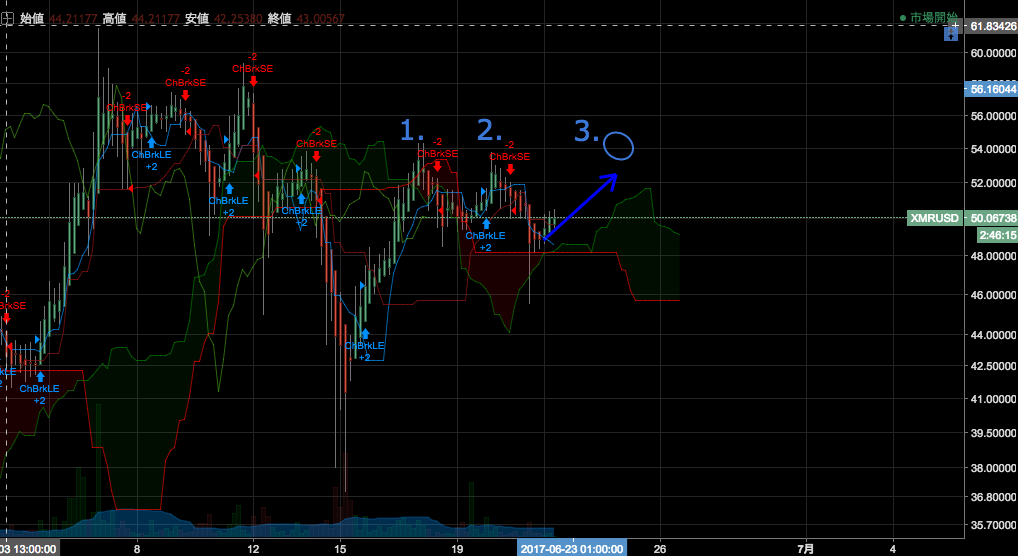
$XMRUSD Chart:
https://jp.tradingview.com/x/9xQafE69/
Analysis:
Triple top inbound, look for TP around $54 and keep a tight stop-loss at the cloud. I don't trade $XMRUSD very often, but this is a good opportunity to make an easy 7% if you're able to grab up enough size. I would definitely go short-term and sell $XMR has the tendancy to go down after a brief bull run.
Wrap-up:
Well traders, there you have it. My brief analysis of Litecoin, including some others this morning. Please upvote, follow and resteem if you found this post useful. I work on these charts for free, and Steemit is really the only way I have to keep things going outside of donations! Thanks for reading, I really hope this helps! Requests for trading pairs are open!
//Disclaimer: None of the content published here constitutes a recommendation that any particular security, portfolio of securities, transaction or investment strategy is suitable for any specific person. None of the information providers or their affiliates will advise you personally concerning the nature, potential, value or suitability of any particular security, portfolio of securities, transaction, investment strategy or other matter.
Very nice analysis, but I can't take it serious without rainbow colours and animal drawings. Keep it up!
Thanks @khonsu! I'll see if I can add some rainbows and animal drawings to my charts next time around :)