Technical analysis BTC-USD
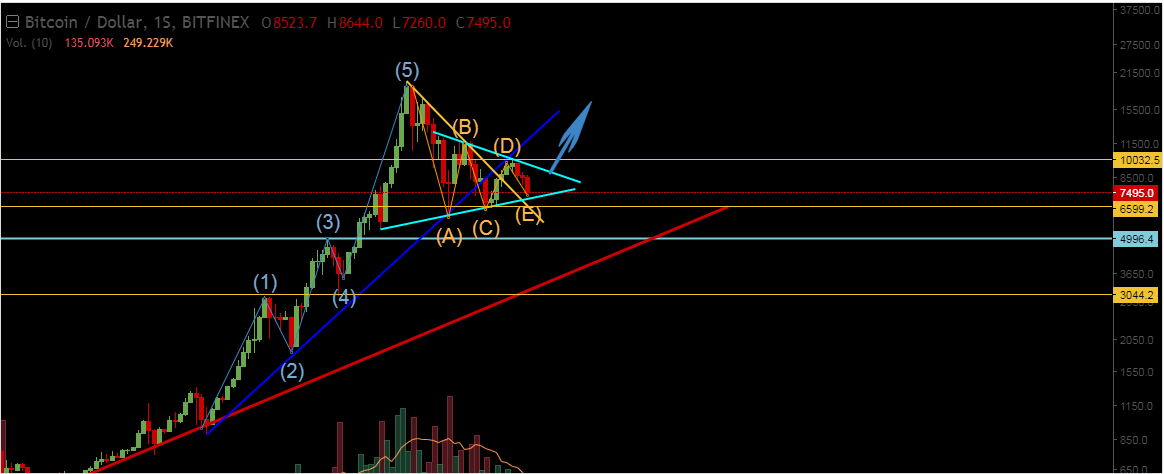
During the year 2017, BTC moved through a wave impulse of elliot 1,2,3,4,5, so in 2018 we can see a correction boxed in a continuation triangle A, B, C, D , E, the last point that is "E" is already touching the bottom of the triangle, if it bounces at this point we can see a bullish BTC in the remainder of the year, reaching new historical highs.