BITCOIN Daily Charts Seeing Some Nice Looking Love

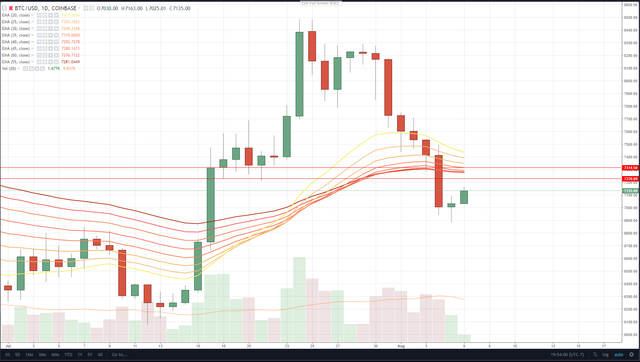
This BTC daily chart is shaping up to be nice looking for the time being. We just closed out a nice bullish reversal looking candle at the bottom which touched support above the levels we'd thought. This was the first bullish candle in a week after seven straight bear candles with decent volumes. I was a little surprised about this and I thought we'd touch support lower. Needless to say, I'm still pleased at the set up so far. Now, we need the bulls to make sure they step in and confirm this reversal.
On a technical level, stochastic RSI crossed bullish after being slammed against the floor. We will definitely see a bear flag bounce at a minimum. RSI on the daily hasn't dipped into oversold territory yet, but it is now tilted up and heading up signaling bull pressure.

Unfortunately, we lost support of the EMA's two days ago, meaning these will now be the resistance band to pass. Additionally, it will likely meet up with price level resistance and prove to be another difficult level to pass. This EMA level also matches up with price level resistance on the 4-hr chart as well, with price resistances at $7,230 and $7,315.
As such, a likely scenario in this situation is an expected consolidation wedge as the bears take a breather.
On the support side, we still have HUGE support at the $6,800 level and an upward trend line. We're at a held daily higher low, so hopefully we can see bulls top $8,500 for a daily high.

Thanks for todays update , Good stuff
Congratulations @exxodus! You have completed the following achievement on Steemit and have been rewarded with new badge(s) :
Click on the badge to view your Board of Honor.
If you no longer want to receive notifications, reply to this comment with the word
STOPTo support your work, I also upvoted your post!
Yay. Thanks.