Daily Bitcoin Price Analysis - Formed A Nice Looking Hammer, Is It Enough?
We had one helluva roller coaster today for Bitcoin, I think we were down at least 16% at most but then we managed to get some buyers coming in and we closed the day at about 2% down. Here is the daily chart:
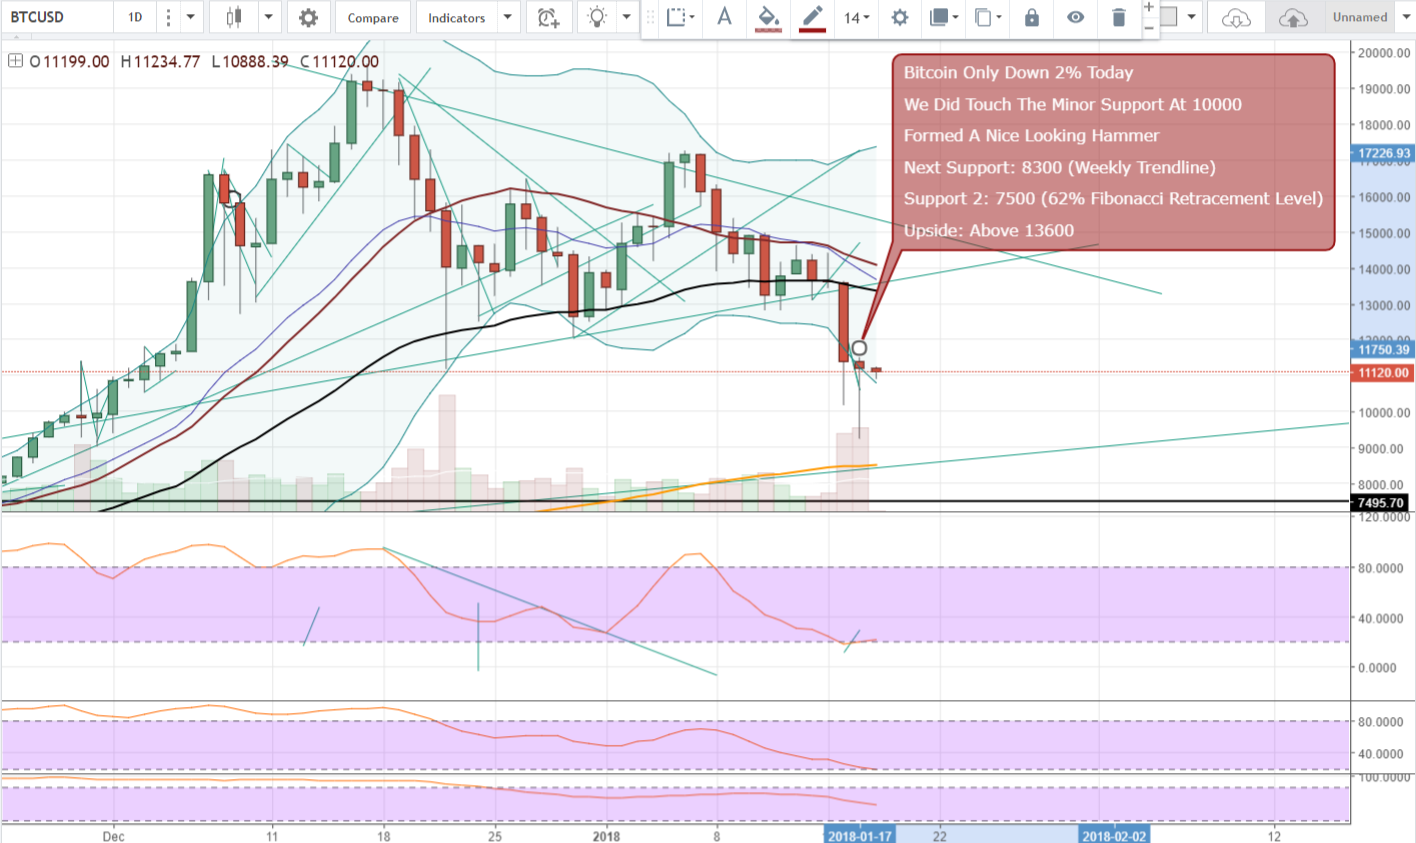
Comment: The low of the day was 9222 (Bitstamp) and that was a little bit lower than the minor support level at 10000. We could continue to fall here and I am looking at 2 support levels and those are 8300 which is the weekly support trendline and then the worst case scenario, 7500 which is the 62% fibonacci retracement level.
However, we did touch the bollinger band median on the weekly chart today so perhaps that could be enough for this pullback. We will have to see.
If we are looking at the upside, Im going for 13600 as the first target and there isnt really that much of resistance until we reach that level so that could be a quick journey.
Happy trading!
I really don't hope for a worst case scenario. I woke up today and had greens in my portfolio, that was such a good thing to see. I really hope the market will stabilize now lol
Yup, lot of emotions when you own cryptos. Lets hope that the worst case scenario will not occur.
I’m just concerned that it’s just a single candle and nothing else. I would even call it an indecision candle rathe than a reversal candle at this stage too.
Still can’t make a call with any conviction here.
Yeah, it could very well be, we dont have any confirmation yet and from a technical view for the long term, I would like to see a solid foundation and then we will have to go lower...
Nice work bro