Bitcoin(BTC) Update : Similarity pattern in a bullish wedge.
In a previous article(EMA dead cross? A Red alert for Bitcoin) I warned about the possibility of a long-term decline in bitcoin. I am still concerned about the long-term downtrend, but this time I will give an optimistic scenario of bitcoin.
Similarity pattern in a bullish wedge
When analyzing a chart from the perspective of 'elliott wave', 'pattern' is the most important part of the analysis. So, in this analysis, I carefully observed the pattern that the chart produced. I have observed a fractal(marked as yellow boxes) in the wedge pattern on the chart below. I call it a 'tendency', this means that there is a high probability that the pattern following will repeat the preceding pattern.
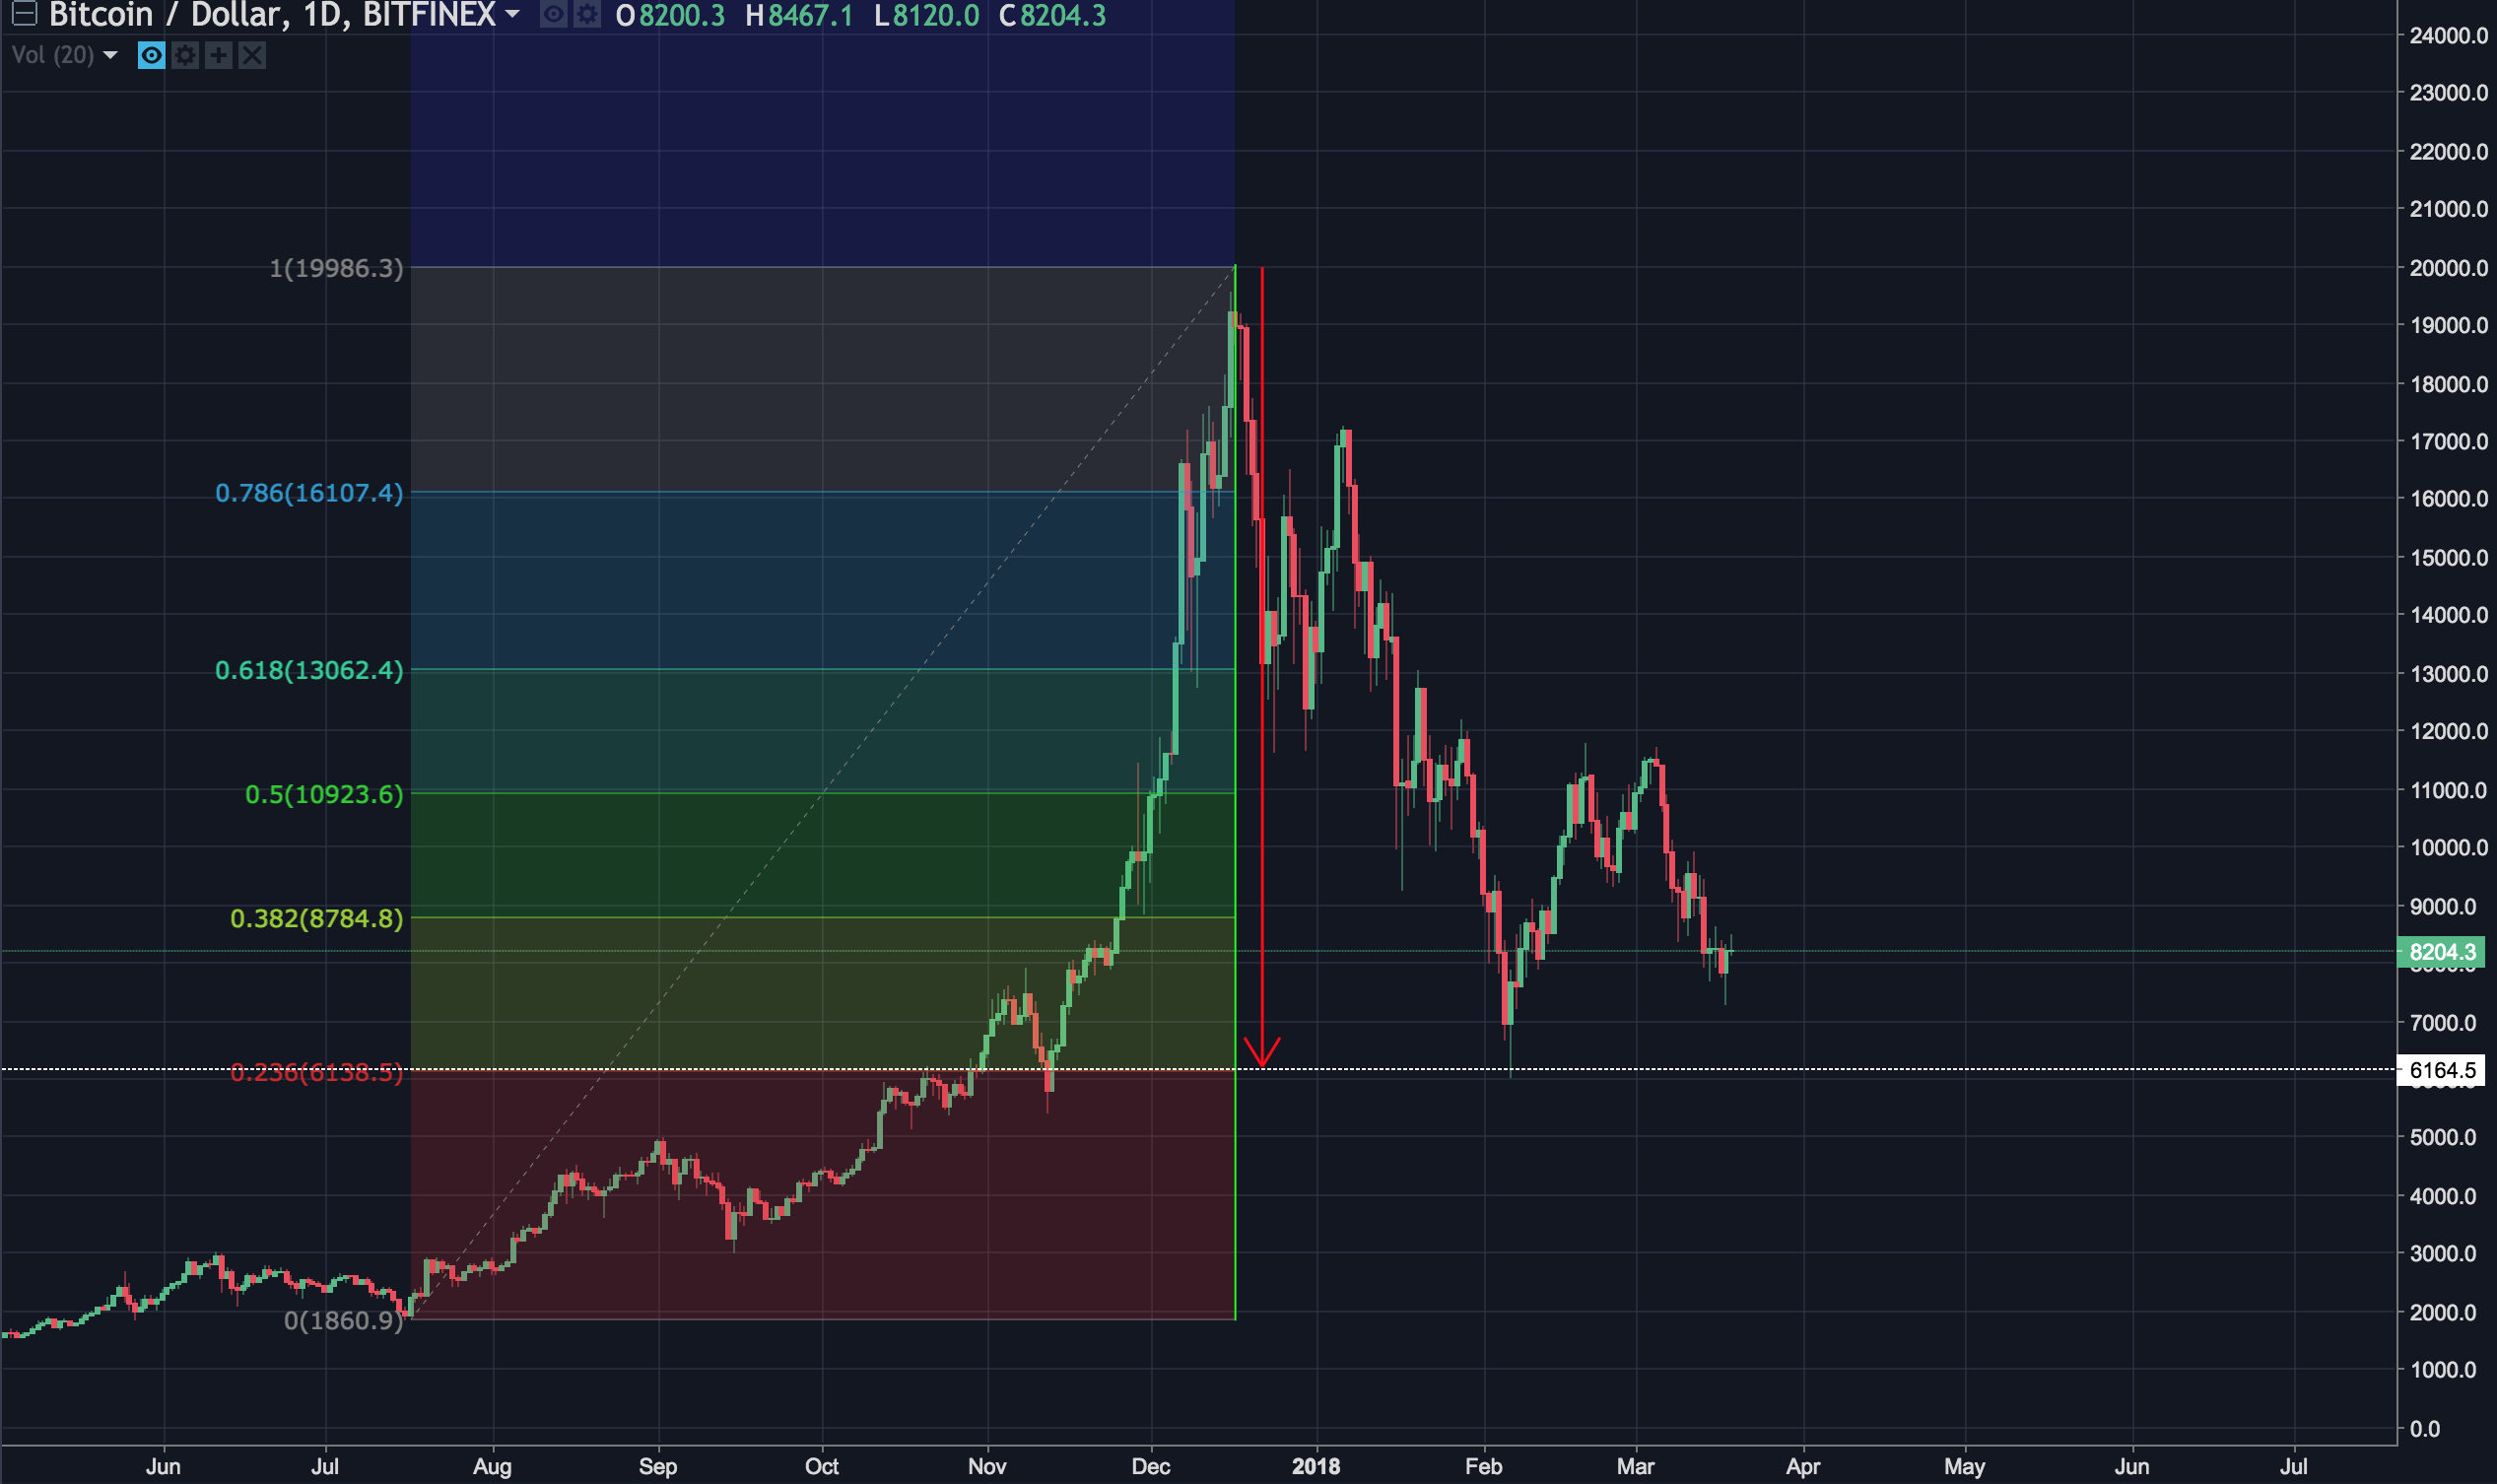
The chart below shows a more detailed view of the above 'trendency'. In the first pattern (large yellow box) the price fell to 0.236 Fibonacci Retracement value of previous elliott impulse wave. And, in the second pattern (the little yellow box), the price touched the 0.236 Fibonacci Retracement value of the previous wave, as like as in the first pattern. It means, rising stage may come in soon. But this rise will not be satisfactory.
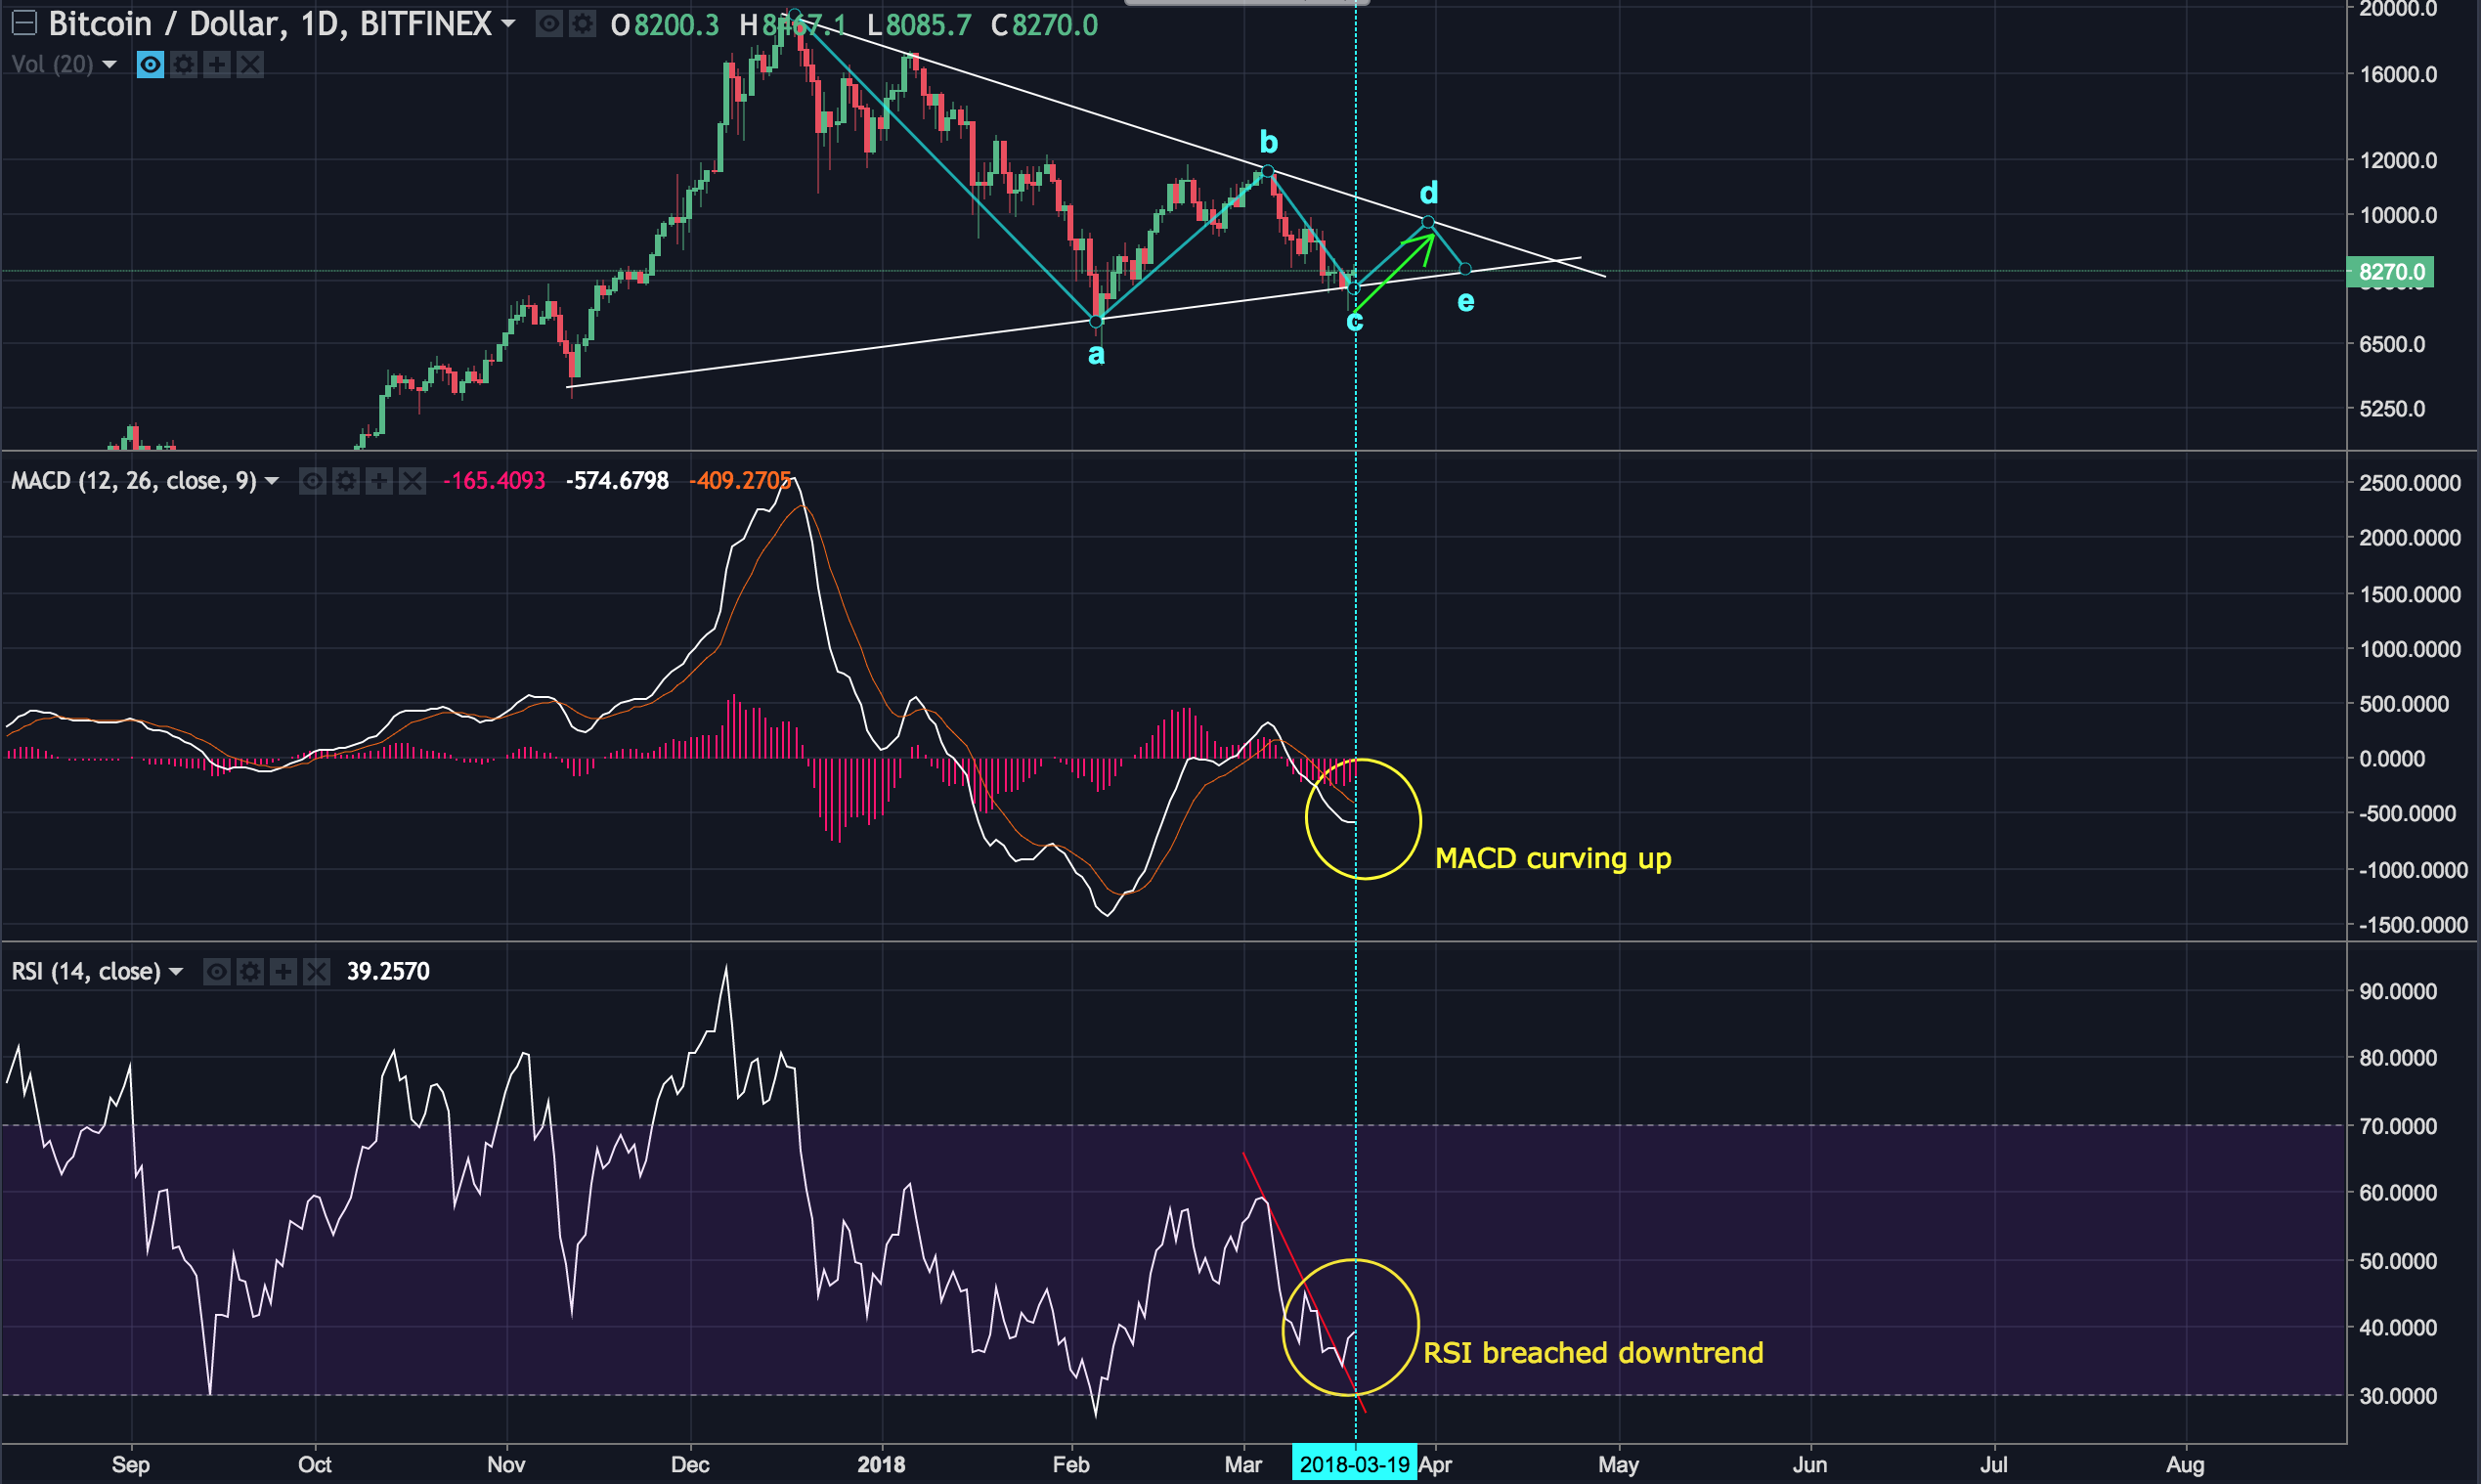
As you can see on the chart, I think the bitcoin is moving on the wedge pattern and now it heading towards the 'd' wave. Therefore, the bitcoin price can go up to about $ 9700 and can going back to downtrend after. Of course, the price can breach the downward trend line at the 'd' point, but it seems to require strong buying to be that way. We need to be watched carefully if bitcoin reached at that point.
- If you get any help from this posting, press 'UPVOTE'!


Dude, I can't upvote. You just copy Haejin, but I don't think you know what you're really doing
I agree that there is a similar analysis, but it is not right to say that it is a copy. Look at all the other posts I've made. Do you really think I'm copying?