Bitcoin Update(18/06/2017): Is Correction Over????
Today, I received one text message from my wife in which she was wishing me HAPPY FATHER's DAY on my little son behalf. As, Bitcoin can be consider as a father of all digital currencies existing today, this analysis is my way to wish Bitcoin, HAPPY FATHER's DAY!
Bitcoin has hit its all time high of $3000 on 11/06/2017 and since then it has been correcting. It did hit a low of $2050 in this correction but quickly recovered and that candle I marked in yellow just to remind readers that I have correctly predicted that down move in my analysis on 12/06/2017(https://steemit.com/bitcoin/@jimmyrai28/bitcoin-update-12-06-2017-correction-coming-after-another-new-high) and i am not going to take credit of that correction , because I am just a chart reader and that time i said what chart shown.
So, now the question arises, is correction over in BITCOIN prices, for that i want to draw your attention on chart below and I want to notice a FORMATION of lower highs but higher lows, which clearly indicates this script do recover from 'knee jerk reaction' but still need more power to negate its short term downtrend and this is first point.
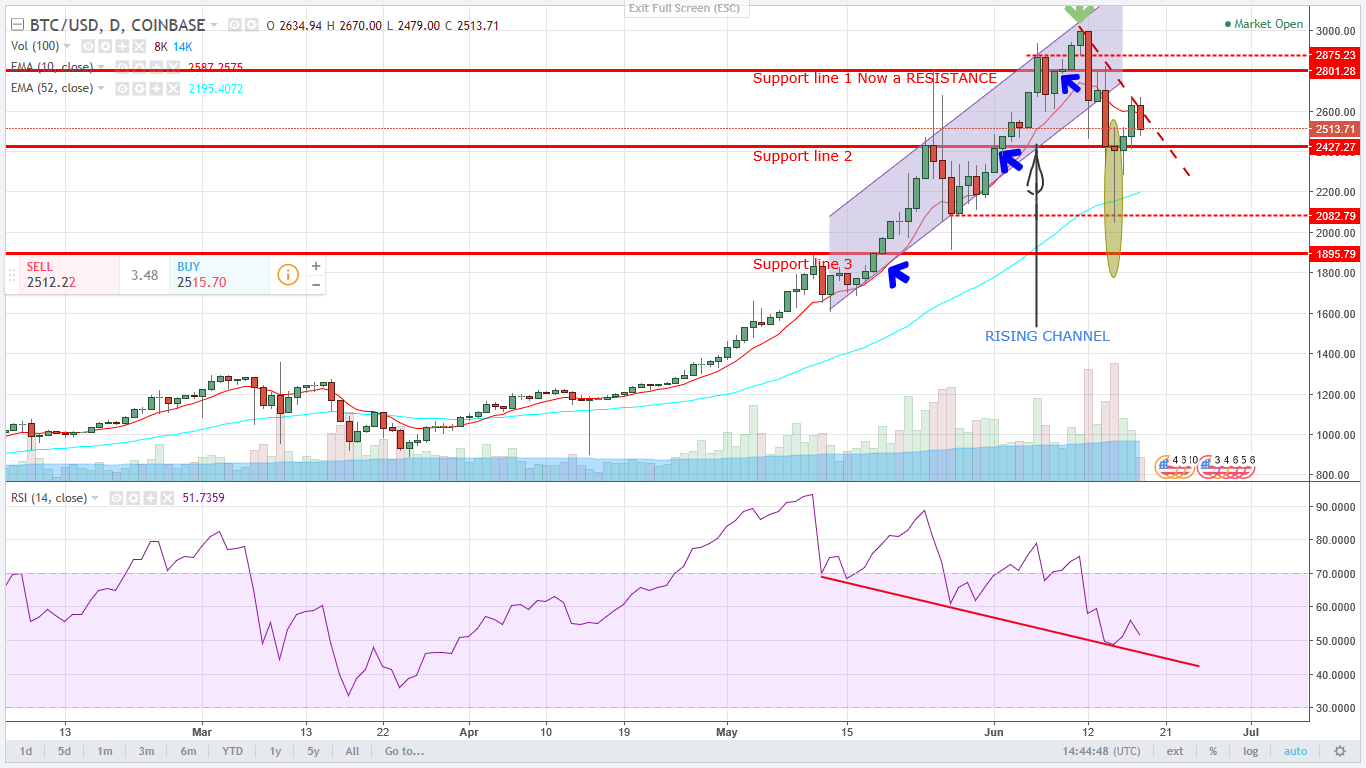
Secondly, i want you to take note of SUPPORT 2 which is at $2435 on chart below and one can clearly notice a base provided by this support, so this is a positive sign that Bitcoin has well respected this support , break of this may lead to futher fall and test of next support 50 days EMA(blue wavy line), which it did tested before in ongoing correction.
Thirdly, I want you to take note of 10 Days EMA(Red wavy line) in chart below and one can clearly notice that Bitcoin has been trading below this Moving average for last four five days, which is negative sign for this script as this shows a weekness of BULLS and dominance of BEARS.
Lastly, I have drawn SHORT TERM FALLING TRENDLINE (Red dotted diagonal line) on chart below, this trendline is providing resistance to BITCOIN and one can notice that this script do try to breach this trendline yesterday but failed to sustain and in todays trading its open at $2634 after closing previous day at $2512, but falling since then making red candle for the day till the writing of this analysis. It seems that Bitcoin again try to test its support sometime during remaining trading hours.
In summary, this script needs to close above 10 day EMA i.e. above$2586 and also above short term falling trendline really to convince investors that a correction in prices is over, otherwise It will breach support eventually proving me right again as I was in view of retest of low($2050) made recently.
If you like my analysis do upvote, follow, comment @jimmyrai28
if not then criticize, this also will be highly appreciated.
You can also drop a comment in 'reply' if want you want me analyze any script of your choice.
Please visit my previous post https://steemit.com/bitcoin/@jimmyrai28/bitcoin-update-16-06-2017-correction-over-or-not-million-dollar-questionfor my concern and prediction
great content. I'm also into trading cryptos and indices.
After the second correction in a very short period of time i'm expecting the continuation of new alltime highs in BTC for the following weeks ;-)
Thanks for appreciation , and i also predicted second follow up correction in my 16/06/2017 update
Resteemed your bitcoin view. Let's see where we are heading.
Oh thanks, and thanks for your kind visit!!!