BTC/USD ANALYSIS
In the last two years, Bitcoin has always bounced sharply from the oversold levels on the RSI.
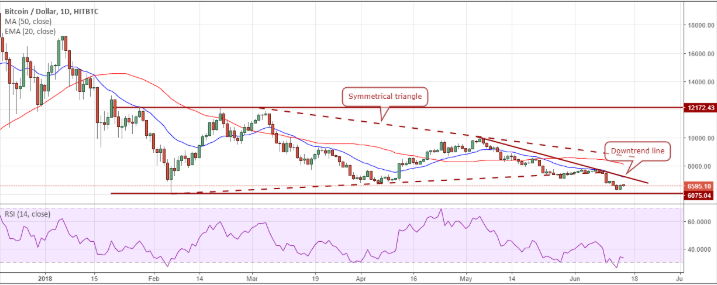
This streak was broken when the most recent pullback from $7,106 on May 29
could only rally to $7,755.61. Hence, traders should avoid initiating
long positions only on the basis of the RSI signal.
A number of analysts are advocating downtrend for the digital currency.
We, however, have maintained that it is likely to remain range bound
with the bottom being $6,075.04. The leading digital currency
has not broken below the intraday lows made on February 06,
and the moving averages have been crisscrossing each other frequently,
which is a proof that the trend is not down but range bound.
The best way to trade a range is to buy, when the price
is at the bottom of the range. However, we have introduced
an added filter to increase our factor of safety.
In 2018, a break out of the 20-day EMA has been a short-term trading opportunity.
If history repeats itself and the BTC/USD pair embarks upon a rally,
we want to buy it once it breaks out and sustains above the 20-day EMA.
The overhead resistances are $7,755.61, $8,566.4 and $8,888.
CHEERS
Go here https://steemit.com/@a-a-a to get your post resteemed to over 72,000 followers.