Bitcoin Technical Analysis - Bullish And Bearish Scenarios
Weekly chart
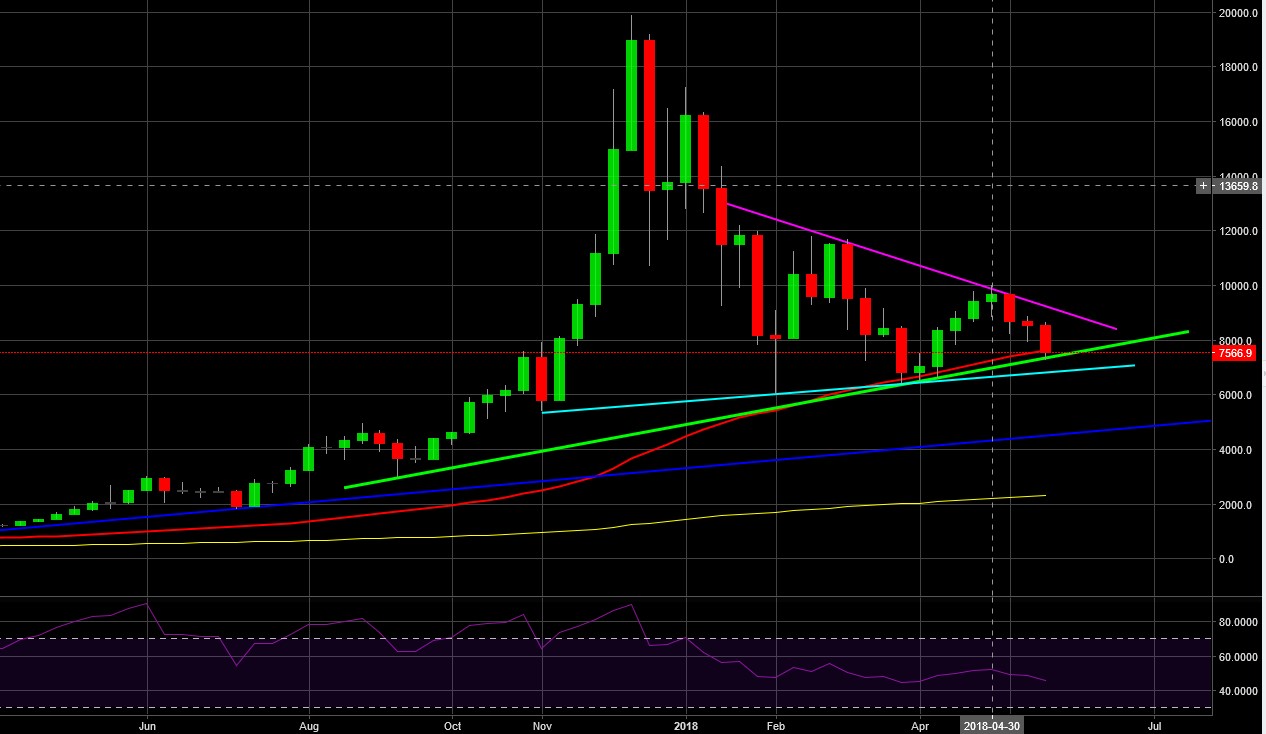
It's important to remember the big picture so let's start with the weekly chart. This bear market that started in December looks like just a healthy correction which the market needed. Price is still above the 50-week moving average which has worked as a support in the past.
Daily chart
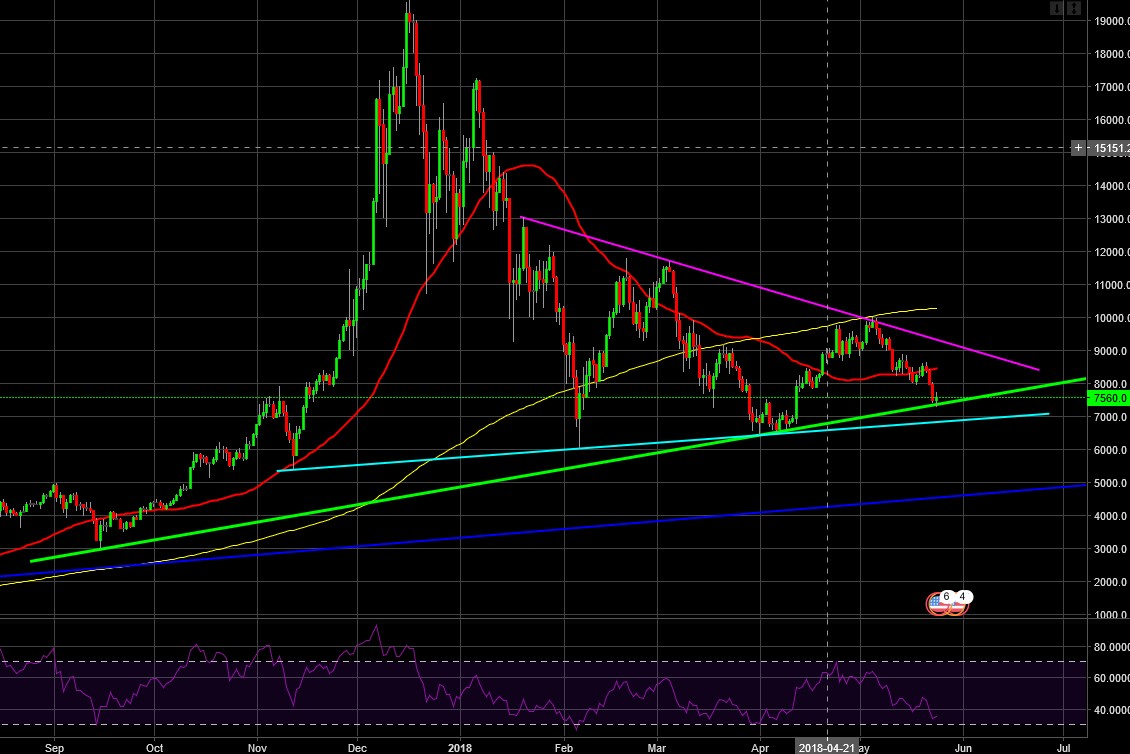
I'm considering the purple line as the last trendline defense for the bears. Even numbers like 9000 and 10 000 are still likely to hold the price back in the short term but if BTC breaks the purple line, I'm expecting a rise to around 12 000 usd - at first.
4-Hour chart
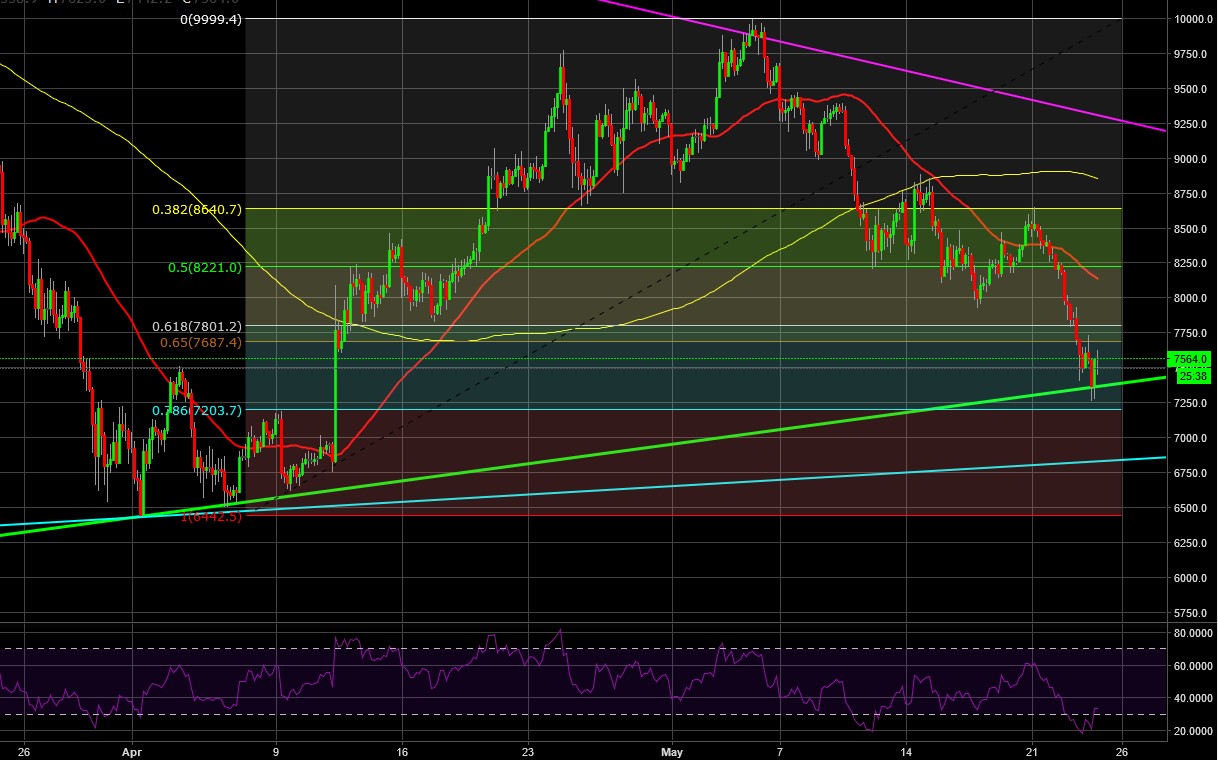
I haven't considered the green trendline as an equally important support as the baby blue line, but the price has nevertheless found some support there. It probably helped that the 0.768 Fib level was right below it. I had waited for a few days for the price to drop near 7200.
You might need to open up the image to get a clear look of the candles we've seen during the last 12 hours. At the bottom there is a great signal of reversal - two identical candles (except that the first is red and the second is green) with relatively long wicks down.
The big picture still looks good to me, and that's why I bought more at 7300 usd. I'm hoping the price can now jump up and retest the purple trendline. That is the most important resistance to look out for. If BTC can climb up now, Elliott Wave theory suggests the price rises at least to 10 800 but I'm personally looking for a price closer to 12 000 - a zone that has workes as resistance and support in the past. Once BTC reaches that target, there should be a minor correction before we start chasing all time highs.
If the 0.768 Fib level at around 7200 usd doesn't hold, it's very likely the price will keep falling towards 6500 where we saw support in April. The baby blue trendline could still save BTC if 7200 fails. If the price somehow falls below 6500, then the price would obviously test the previous low at 6000. If 6000 fails too, there's really nothing to keep the price from falling to 5000 where a support zone could be met with another trendline going up. However, It's way more likely that BTC goes closer to 9000 than 6000 in the near future.
Allow me to assist: https://steemit.com/cryptocurrency/@bitbrain/what-did-i-say