Bitcoin Technical Analysis - Rising Wedge Leads To Decline?
A quick Bitcoin update:
4h chart
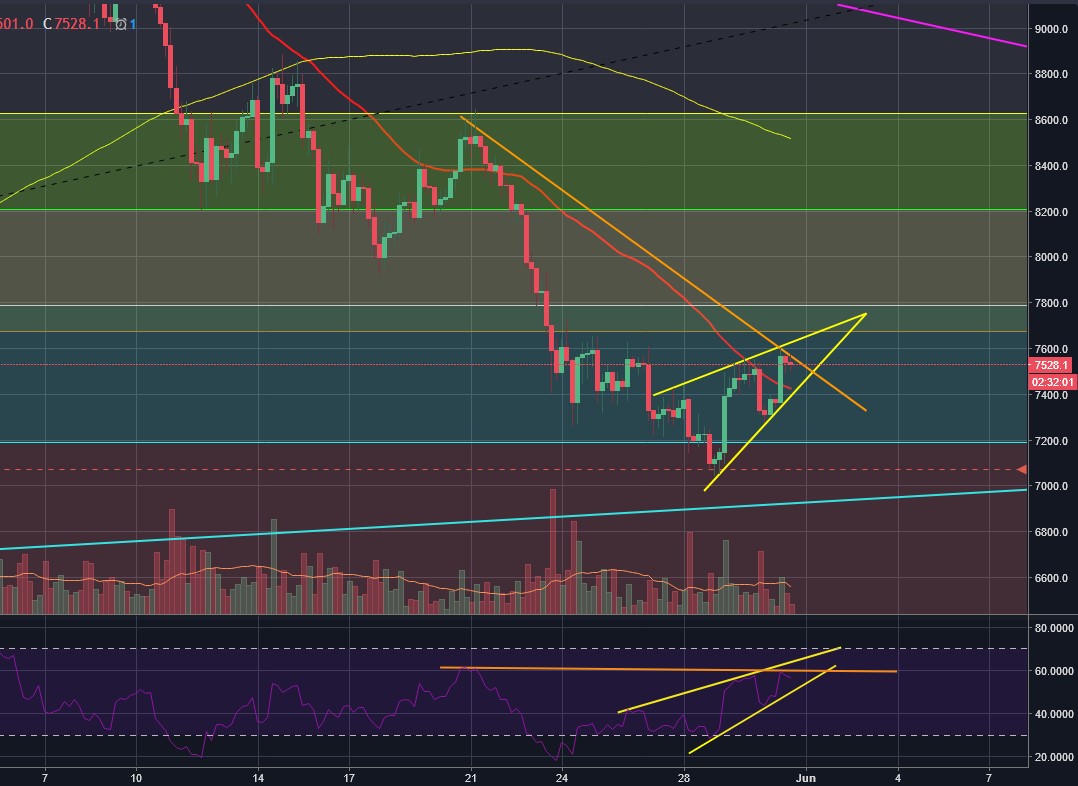
Bitcoin has formed a rising wedge, a pattern that breaks to the downside more often than not. To support the bearish view, you can also observe the RSI divergence drawn with the orange lines.
Daily chart
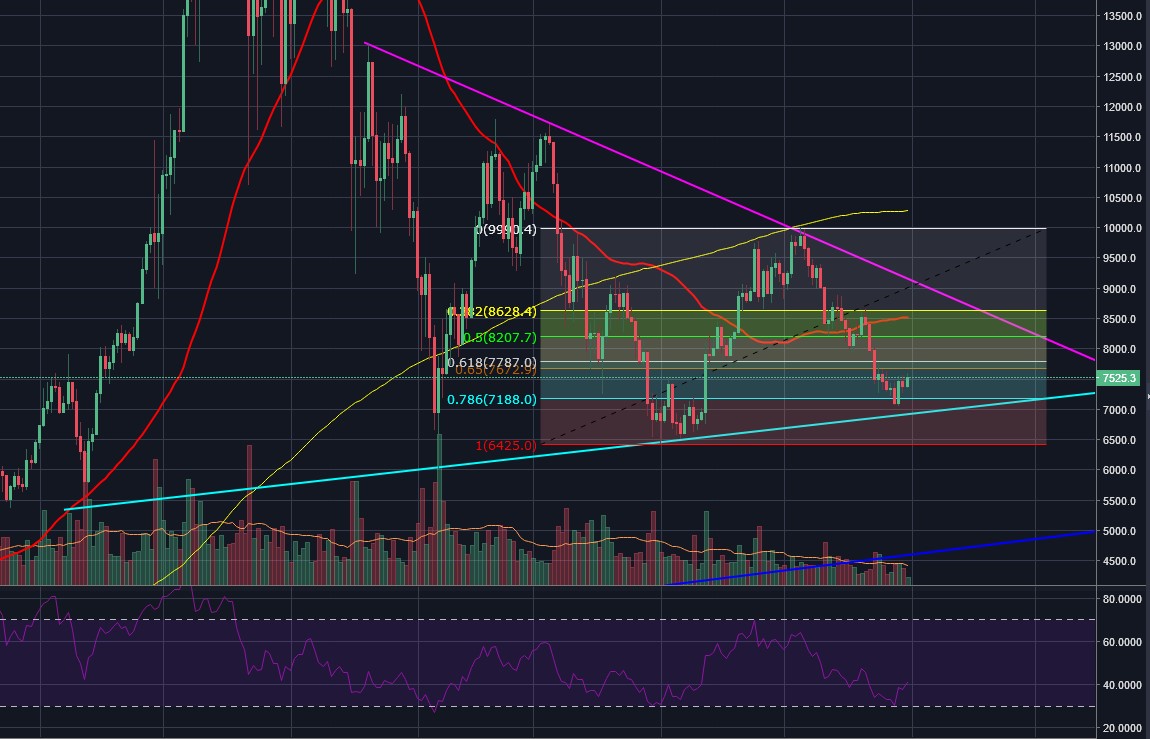
The daily chart looks good for the bulls but I'm still expecting a minor decline before going any higher than the wedge on the 4h chart allows. Bitcoin is also below the 50-week moving average but i don't think the bulls should be worried about that, and instead focus on the completion of the large wedge pattern on the daily chart for now.
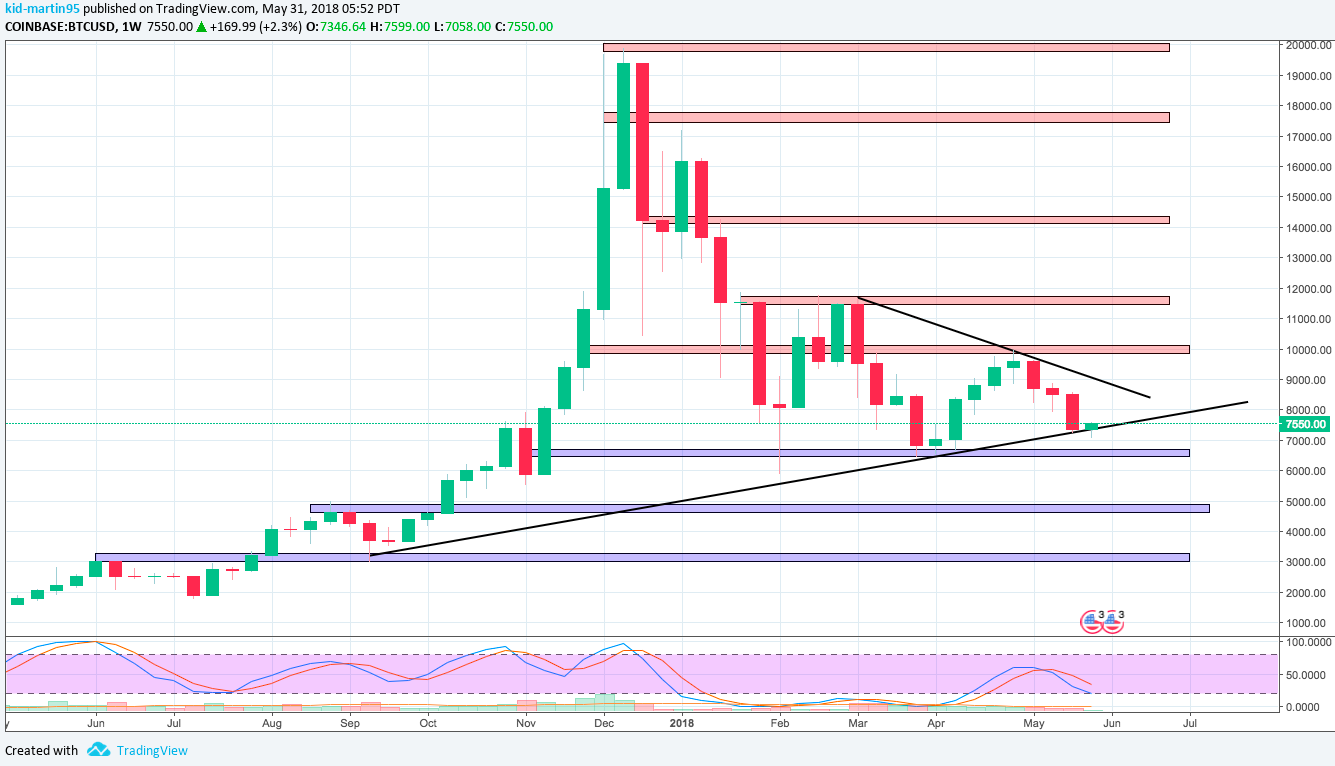
Waiting for a daily close above $7,600 before taking any buys. Definitely still have some room towards the downside, possibly towards $3,000.