BTC Make money, money. Make money, money, moneeeeyyyy!
Yesterday i made the first analysis after a long time.
I guess the last one was 7 days ago. Or longer.
Unfortunately i didn't spent much time with my analysis.
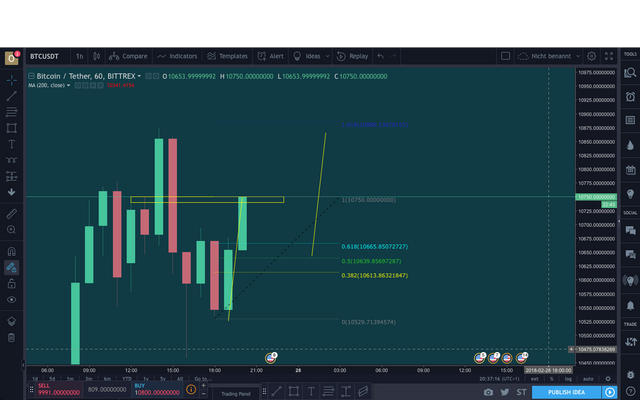
I just draw the yellow lines in it.
I do not define an entry. I've wanted to predict just the way of the price action.
Let's see. BTC on 1H chart
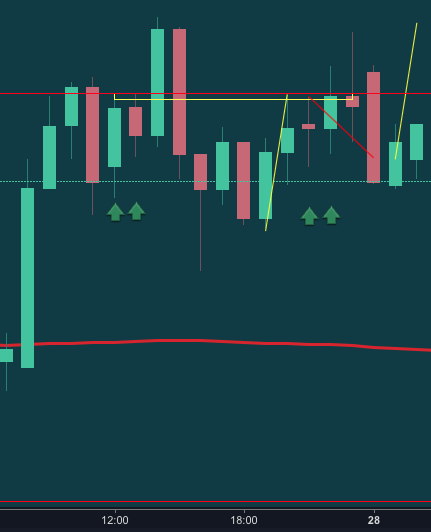
BTC is over the EMA indicator but near to it.
There was a significant point on Feb., 27th between 12 pm and 14 pm.
The prices reached the highest points 10740 at 12 pm and 10750 at 13 pm.
After the price dropped at 16 pm on 10459.

The 4th marked candle has it's close over the 2nd marked candle.
For me, this is an indication for a bullish trend.

Let us see, what comes next.
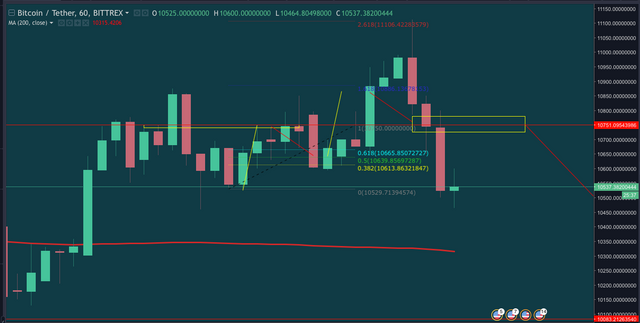
So this ist what happend after I went to sleep.
The price was pretty predictable.

If so, he can drop till the EMA and pulls back to go high to the moon, like I was on yesterday evening.
Cheers, folks!
only.ray
up up and up
I Upvoted and Followed you.. Do the same for me And we could help each other Earn ..!!..
Hi, check out my fx technical analysis blog. I think you can apply some. principles for trading cryptos. And if you find it interesting consider following. 👊
Following you!